J. of the Braz. Soc. of Mech. Sci. & Eng. Copyright 2012 by ABCM October-December 2012, Vol. XXXIV, No. 4 / 423 Vincent H. Wilson
[email protected] PRIST University Center for Research and Development 613 403 Thanjavur, Tamilnadu, India
Udayakumar
[email protected] National Institute of Technology 620 020 Trichirappalli, Tamilnadu, India
Optimization of Diesel Engine
Parameters Using Taguchi Method
and Design of Evolution
The objective of this work is to optimize the control parameters of the direct injection (DI) single cylinder diesel engine with respect to NOx (Oxides of Nitrogen) and fuel emissions through experimental investigations and Taguchi method. A single cylinder 5.2 kW diesel engine was selected for this experiment. Five parameters such as clearance volume, valve opening pressure, nozzle-hole diameter, static injection timing and load torque were varied at four levels and the responses such as NOx emissions and fuel economy were recorded. The optimum values of the response variables could be predicted using S/N ratio and optimum combination of control parameters were specified. Results of confirmation tests showed good agreement with predicted results. Thus the relationship between the diesel engine operating parameters with NOx and b.s.f.c (brake specific fuel consumption) could be understood using Taguchi method of experimental design.
Keywords: diesel engine, NOx emissions, Taguchi method, injection parameters
Introduction1
Direct injection diesel engines occupy an important place in the developing countries since the power agricultural pumps, small power tillers, light surface transport vehicles and other machineries. The problem of increasing atmospheric pollution and the fast depletion of the fossil fuels demands severe controls on emissions and a high level of fuel economy. Many innovative technologies are developed to tackle these problems. Taguchi has introduced the loss function concept which combines cost, target and other variations into one metric. The concept of robustness is also developed and it ensures that the system functions correctly. The S/N is a figure of merit and relates inversely to the loss function. It is defined as the ratio of the amount of energy for intended function to the amount of energy wasted (Shuhel Yoneya, 2002).
Orthogonal arrays are significant parts of Taguchi methods. Instead of one factor at a time, all factors are varied simultaneously as per the design array and the response values are observed. It has the ability to evaluate several factors in a minimum number of tests. Design of experiments (DOE) approach is cost effective and the parameters are varied simultaneously and then through statistical responsible for the engine emissions and fuel analysis the contribution of individual parameters towards the response value observed also could be found out. The design and operating parameters are the main factors opening economy. The fuel injection parameters like injection valve pressure, static injection timing and the area of nozzle hole spray also have influence on emissions and fuel economy. In this work DOE approach is used to find the effect of design and operating parameters on NOx emissions and b.s.f.c. The predicted results and experimental values are compared and found to have good agreement.
Literature Review
Using DOE, Shuheil Yoneya et al. (2002) have optimized exhaust emissions and fuel consumption with an Exhaust Gas Recycling (EGR) system. The application of Taguchi technique in various engineering optimization problems was well explained by Resit Unal and Edwin B. Dean (1991). Their analysis presented an overview of the Taguchi method for improving quality of the product and reducing the cost.
Salem et al. (1998) have predicted the effect of different injection pressures, injection advance angles and different fuel-hole diameters (orifice) on the NOx emissions. In this analysis it was concluded that
Paper received 22 October 2009. Paper accepted 3 March 2010 Technical Editor: Demetrio Neto
reducing the NOx emission level without noticeable loss of power can be achieved by appropriate adjustment of injection parameters.
Injection timing, injection pressure, intake gas temperature, engine speed and load were taken as parameters for the design optimization study. The effect of the above parameters – injection pressure, fuel injection timing, intake gas temperature and engine speed on NOx emissions and smoke were investigated and a strong correlation between the injection timing and NOx emissions was reported.
An increase in injection pressure contributes to fuel economy by improved mixing. Simultaneous reduction of NOx and particulate emissions was reported by combining the retarded injection timing and EGR. Optimal combination of design and operating parameters was identified, which can regulate emissions and improve brake specific fuel consumption. For identifying the optimal combination of injection schedule and fuel spray cone angle, Genetic algorithm process was used. The effect of changes in the operating parameters like nozzle spray holes, piston to head clearance, nozzle protrusion, injection pressure, start of injection timing and swirl level on emissions was studied using Taguchi design of experiment methods. This method was found to be useful for simultaneous optimization.
Yang et al. (2002) has studied the effects of injection timing, fuel quantity per fuel pulse and injection rate on NOx emissions and has observed that among the various factors relevant to diesel combustion, fuel injection plays a major role in the fuel air mixing and combustion process thus determining the exhaust emissions. It was also observed that the injection timing and injection rate play a major role in controlling NOx emissions. Using Taguchi method and ANOVA the percentage contributions of the effect of parameters-speed, load, injection timing plunger diameter, nozzle valve opening pressure, nozzle-hole diameter, number of nozzle holes and nozzle tip protrusion were investigated on engine noise, emissions and brake specific fuel consumption (Z. Win et al., 2005). Otto Uyehara has investigated the effects of injection timing, injection pressure and spray-hole diameter on the NOx emissions.
Exhaust Emissions from Diesel Engines
NOx in diesel engines are formed due to the high temperature during combustion process. Use of very high injection pressure, retarded injection timing and EGR are some of the common in- cylinder techniques adopted for reduction apart from the after treatment like urea injection, catalytic converters and so on.
Experiment Details and Methodology
The experimental set up consists of a direct injection single cylinder diesel engine coupled to an Eddy current type dynamometer for loading. The signals from the combustion pressure sensor and the crank angle encoder are interfaced to a computer for data acquisition. The control module system was used to control and monitor the engine load, the engine speed and measure the fuel consumption. Windows based engine performance analysis software package “Engine soft” is used for online performance evaluation. The samples of the exhaust gases are measured for the NOx emissions.
Injection timing was altered by adjusting the number of shims under the seat of the mounting flange of the fuel pump. When the number of shims were added timing was retarded.
Changing the nozzle spring tension changed the nozzle opening pressure. When the spring preload was increased by tightening the nut above the spring the nozzle opening pressure was increased. Four different nozzles had different combinations of hole diameter and number of holes. Number of gaskets were increased and decreased to change the clearance volume. Engine cylinder pressure was measured using quartz miniature pressure transducer mounted in the cylinder head of the engine. Italy make Kane Quintox exhaust gas analyzer was used to measure NOx, carbon monoxide and hydrocarbon exhaust gas levels.
The criteria for optimization of the response parameters was based on the smaller the better S/N ratio.
−
=
∑
= r i iy
r
N
S
1 21
log
10
/
,where yi represents the measured value of the response variable- i.
The negative sign is used to ensure that the largest value gives an optimum value for the response variable.
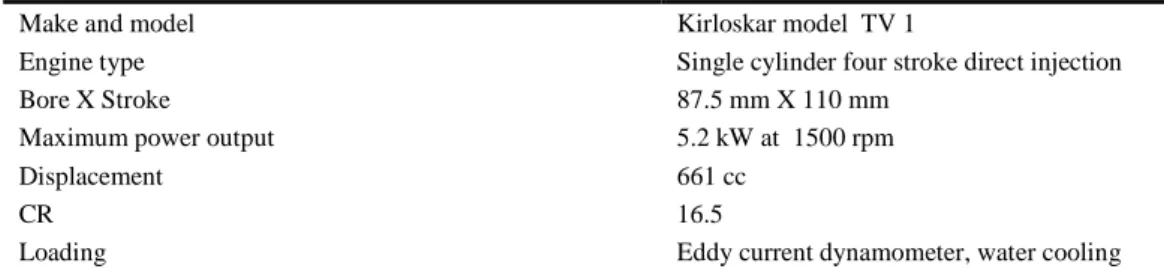
Table 1. Engine specification.
Make and model Kirloskar model TV 1
Engine type Single cylinder four stroke direct injection
Bore X Stroke 87.5 mm X 110 mm
Maximum power output 5.2 kW at 1500 rpm
Displacement 661 cc
CR 16.5
Loading Eddy current dynamometer, water cooling
The objective of the work is to investigate the engine operating parameters and injection parameters having maximum potential for reducing NOx emissions, for improving the fuel economy and to identify the optimizedrange of input parameters for low emissions and better fuel economy.
Taguchi technique is used to identify the key factors that make the greatest contributions to the variation in response parameters of interest. Taguchi recommends orthogonal array (OA) for laying out of the experiments which is significant part of this method. Instead of varying one factor at a time, all factors are varied simultaneously as per the design array and the response values are observed. It has the ability to evaluate several factors in a minimum number of tests. The results of the experiments are analyzed to achieve the following objectives.
1. To establish the optimum conditions for the NOx emissions and b.s.f.c.
2. To estimate the contributions of individual parameter to the response.
3. To predict the response under optimum conditions. 4. To run the confirmation test for validation.
The optimum condition is identified by studying the main effects of each of the parameters. The main effects indicate the general trend of influence of each parameter.
The ANOVA (analysis of variance) is the statistical treatment most commonly applied to the results of the experiment in determining the percent contribution of each parameter against a stated level of confidence. Study of ANOVA table for a given analysis helps to determine which of the parameters need control.
The steps involved in Taguchi method are:
1. Identifying the response functions and control parameters to be evaluated.
2. Determining the number of levels of the control parameters. 3. Selecting the appropriate orthogonal array, assigning the
parameters to the array and conducting the experiments. 4. Analyzing the experimental results and selecting the
optimum level of control parameters.
5. Validating the optimal control parameters through a confirmation experiment.
In the present investigation, the S/N data analysis has been performed. The effect of the selected control parameters on the response functions has been investigated. The optimal conditions are established and verified through a confirmation experiment.
Experimentation and Analysis Selection of control parameters
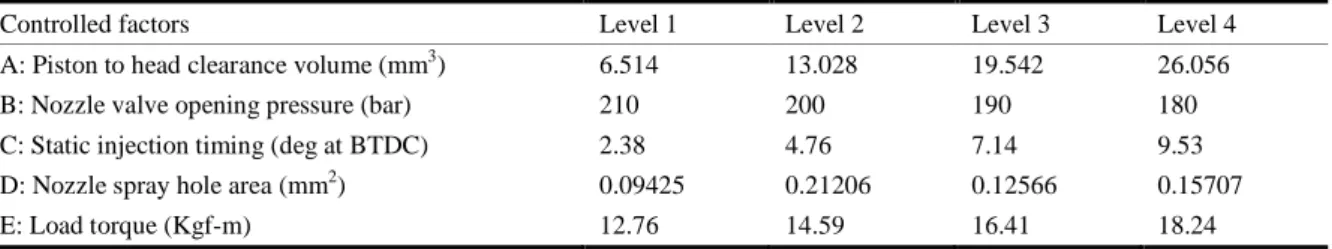
The following control parameters as given in Table 2 were selected for the investigation, since they have influence on the objectives of reduction of emissions and improving the fuel economy. More parameters are related to the fuel injection and these parameters were found to be suitable for the experiment and could be done with available engine configuration. Four levels were chosen for this investigation.
Selection of orthogonal array
J. of the Braz. Soc. of Mech. Sci. & Eng. Copyright 2012 by ABCM October-December 2012, Vol. XXXIV, No. 4 / 425 Table 2. Selected input parameters at four levels.
Controlled factors Level 1 Level 2 Level 3 Level 4
A: Piston to head clearance volume (mm3) 6.514 13.028 19.542 26.056
B: Nozzle valve opening pressure (bar) 210 200 190 180
C: Static injection timing (deg at BTDC) 2.38 4.76 7.14 9.53
D: Nozzle spray hole area (mm2) 0.09425 0.21206 0.12566 0.15707
E: Load torque (Kgf-m) 12.76 14.59 16.41 18.24
Table 3. L16 design array of the experiment.
Factors Piston to clearance volume (mm3)
Valve opening pressure (bar)
Timing (oBTDC)
Area of nozzle opening (mm2)
Load torque (Kgf-m)
Run Number (A) (B) (C) (D) (E)
1 6.514 210 2.38 0.094248 12.76
2 6.514 200 4.76 0.21206 14.59
3 6.514 190 7.14 0.12566 16.41
4 6.514 180 9.53 0.15707 18.24
5 13.028 210 4.76 0.12566 18.24
6 13.028 200 2.38 0.15707 16.41
7 13.028 190 9.53 0.094248 14.59
8 13.028 180 7.14 0.21206 12.76
9 19.542 210 7.14 0.15707 14.59
10 19.542 200 9.53 0.12566 12.76
11 19.542 190 2.38 0.21206 18.24
12 19.542 180 4.76 0.094248 16.41
13 26.056 210 9.53 0.21206 16.41
14 26.056 200 7.14 0.094248 18.24
15 26.056 190 4.76 0.15707 12.76
16 26.056 180 2.38 0.12566 14.59
Figure 1. Experimental set up.
Setting optimum conditions and prediction of response variables
The next step in Taguchi analysis is determining optimal conditions of the control parameters to give the optimum responses. In this work the response variables to be optimized were NOx emissions and b.s.f.c. and both are to be reduced as much as possible. Hence, the optimum parameter settings will be those that
give minimum values of the NOx emissions and b.s.f.c. The optimum settings of the parameters were achieved from the S/N tables of the control parameters and those parameters that give the highest S/N ratio values were selected.
The optimum value of response variable can be predicted using the additivity law.
1. Engine
2. Eddy Current Dynamometer 3. Pressure Sensor
4. Charge Amplifier 5. Load Cell 6. Encoder 7. Fuel Flow 8. Air Flow
9. Personal Computer 10. Loading Unit 11. Engine Interface 12. Gas Analyzer
13. Exhaust Gas Calorimeter 14. Cooling Water in 15. Cooling Water out
8
1 6
4
5
12 9
11
1 15
10 7
14 16
14
3
= + ( − )
Validation Test
Table 4 gives the optimal settings for the NOx emissions and b.s.f.c. It also gives the predicted optimum value of the response variables. The verification tests were also performed with the optimal settings for the NOx emissions and the same setting gives the results closer to the predicted value of b.s.f.c. and hence there is no need for a separate run for b.s.f.c. The deviation of actual S/N
value from the predicted is within ten percent and for the b.s.f.c the deviation is only 1.86 percent which is closer to the predicted value.
Analysis of variance
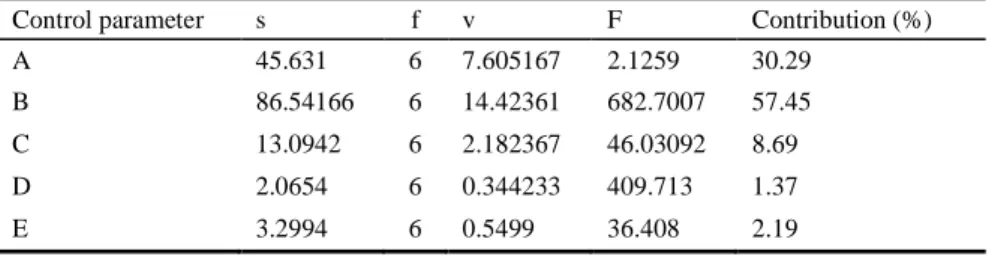
The Analysis of Variance (ANOVA) on the experimental results is performed to evaluate the source of variation. From the analysis it is easy to identify the factors that are most important in controlling the response variables. Tables 5 and 6 give that factors B, A and C are the most important factors due to their higher contributions to the variance in the NOx emission values and b.s.f.c. From this analysis one can decide which control parameter can be varied for getting the desired response variable.
Table 4. Optimum parameter settings for low NOx emissions and low brake specific fuel consumption.
Parameters NOx emissions Brake specific fuel consumption
A: Clearance volume (mm3) 26.056 6.514
B: Valve opening pressure ( bar) 190 190
C: Timing (deg at BTDC) 7.14 2.38
D: Area of nozzle hole (mm3) 0.21206 0.09425
E: Load (kgf-m) 12.76 16.41
Predicted optimum value -21.8241 (dB) 12.30845 (dB)
Confirmation run -20 (dB) 12.5418 (dB)
Percentage deviation 8.33% 1. 86%
A1 A2 A3 A4 B1 B2 B3 B4 C1 C2 C3 C4 D1 D2 D3 D4 E1 E2 E3 E4 Parameters
Figure 2. Parameters vs. S/N ratio of NOx emissions.
A1 A2 A3 A4 B1 B2 B3 B4 C1 C2 C3 C4 D1 D2 D3 D4 E1 E2 E3 E4 Parameters
J. of the Braz. Soc. of Mech. Sci. & Eng. Copyright 2012 by ABCM October-December 2012, Vol. XXXIV, No. 4 / 427 Table 5. Analysis of variance for NOx emissions.
Table 6. Analysis of variance for b.s.f.c.
Control parameter s f v F Contribution (%)
A 98.29 6 32.76 0.860 26.74
B 247.8 6 82.63 0.98 67.433
C 12.51 6 4.172 0.777 3.405
D 1.750 6 0.5836 1.0141 0.4762
E 7.150 6 2.3835 0.7280 1.9451
Results and Discussion
Discussion on optimum settings
The optimum settings for the response variables, NOx emissions and b.s.f.c. are summarized in Table 4. These optimal settings give the values of the response variables as predicted using Taguchi’s methods of Design of Experiments. The load torque and the cross sectional areas of the spray nozzle holes are having minor effects on NOx emissions. Similarly these two parameters are found to have minor effect in the b.s.f.c. also. The start of injection timing has a very moderate effect on both the response variables.
Figures 2 and 3 show the effects of the response variables at each level. The effects of changing the levels of the control parameters from one level to another are clearly shown by these graphs. The highest S/N ratio value corresponds to the control parameter setting for the lowest response variable. In the S/N ratio graph the effect is more pronounced for the levels that have greater difference. The optimum settings for the NOx emissions are A4, B3, C3, D2, and E1. Similarly the optimum settings for b.s.f.c. are A1, B3, C1, D1 and E3. The optimum values of the control parameters, the predicted values and the values of the confirmation tests are given in Table 4.
Conclusion
The influence of the control variables, piston to head clearance volume, valve opening pressure, static injection timing, area of the spray nozzle hole and the load torque on NOx emissions and b.s.f.c. of a direct injection single cylinder diesel engine was investigated. The significance of these control parameters on the response variables was identified using the Taguchi method of design of experiments. Analysis method is used to quantify their level of significance in the form of percentage contribution to the total variation of the response variables.
The following conclusions are made about the behavior of the selected engine.
1. The optimal settings of the control parameters are determined as follows:
NOx emissions:
A4 (26.056 mm3), B3 (190 bar),
C3 (7.14oBTDC), D2 (0.21206 mm2) and E1 (12.76 kgf-m)
b.s.f.c.:
A1 (6.514 mm3), B3 (190 bar),
C1 (2.38oBTDC), D1 (0.09425 mm2) and E3 (16.41 kgf-m).
2. Among the five control parameters the valve opening pressure has greater influence on the NOx emissions and b.s.f.c.
3. The piston to head clearance volume has the second greater effect on both the NOx emissions and b.s.f.c., but the effect is in opposite directions. Hence, for the combined optimization a tradeoff exists between the NOx emissions and the b.s.f.c.
4. The valve opening pressure can be set at 190 bar instead of 210 bar, since the same value gives optimal conditions for both the response variables.
5. The area of the spray nozzle holes and the load do not have much influence on the NOx emissions.
6. The results from the test runs are very close to the predicted range of optimum settings and the deviation is less than 10 percent.
Hence it can be concluded that Taguchi method is a simple, effective, and efficient way for developing a robust, efficient and high quality engine.
References
Baharam Keramati et al., 2003, “21st Century Locomotive Technology: Advanced fuel injection and turbo machinery”, Annual progress report, DEER, pp. 232-234.
Marc Zellat et al., 2005, “Advance modeling of DI diesel engines: Investigation, high EGR level and multiple-injection application to diesel combustion optimization”, Proceedings of Diesel Engine Emissions Reduction (DEER) conference presentation, Aug 21-25, Chicago, Illinois.
Nataraj, M. et al., 2005, “Optimizing diesel engine parameters for low emissions using Taguchi method: Variation risk analysis approach Part I”, Indian Journal of Engineering and Material Sciences, Vol. 12, June, pp. 169-181.
Otto Uyehara, 1991, “A method to estimate H2 in engine exhaust and factors that affect NOx and particulate in diesel engine exhaust”, SAE paper 910732.
Paul Miles, 2003, “Light duty Automotive Diesel Combustion”, Annual progress report, DEER, pp. 28-33.
Control parameter s f v F Contribution (%)
A 45.631 6 7.605167 2.1259 30.29
B 86.54166 6 14.42361 682.7007 57.45
C 13.0942 6 2.182367 46.03092 8.69
D 2.0654 6 0.344233 409.713 1.37
Resit Unal and Edwin B. Dean, 1991, “Taguchi approach of Parametric Analysis to design optimization for quality and cost an overview”, Proceedings of Annual Conference of International Society, pp. 28-32, May 21-24.
Robert M. Wagner, 2003, “Exploring low-NOx, low-PM combustion regimes”, Annual progress report, Diesel Engine Emissions Reduction (DEER), pp. 53-57
Salem, H., El-Bahnasy, S.H., Elbaz M., 1998, “Prediction of the effect of injection Parameters on NOx emission and burning quality in the direct injection diesel engine using a modified multizone model” DO 1797 Proceedings of the Institution of Mechanical Engineers, pp. 427-436.
Shuhel Yoneya, 2002, “Development of multivariate analysis scheme for simultaneous optimization of heavy duty diesel engines”, Mitsubishi Motors Technical Review, Vol. 14, pp. 24-30, Yanea.
Win, Z., et al., 2005, “Investigation of diesel engine operating and injection system parameters for low noise, emissions and fuel consumption using Taguchi methods”, Proceedings of the institute of mechanical engineers, Vol. 219, Part D: J. Automobile Engineering.