Spatial characterization of glacial and periglacial landforms in the
highlands of Sierra Nevada (Spain)
P. Palma
a,⁎
, M. Oliva
a, C. García-Hernández
b, A. Gómez Ortiz
c, J. Ruiz-Fernández
b,
F. Salvador-Franch
c, M. Catarineu
caCentre for Geographical Studies—IGOT, Universidade de Lisboa, Lisbon, Portugal b
Department of Geography, University of Oviedo, Oviedo, Spain
c
Department of Geography, University of Barcelona, Barcelona, Spain
H I G H L I G H T S
• We produced a new accurate geomor-phological map of Sierra Nevada Na-tional Park.
• Maximum glacier extent during the Last Glaciation reached 104.6 km2. • Equilibrium Line Altitude was at 2525 m
in northern slopes and 2650 m in south-ern.
• Mean annual temperatures at the highest lands ranged between−4 and −6 °C. • Permafrost conditions developed until
elevations of 2500 m. G R A P H I C A L A B S T R A C T
a b s t r a c t
a r t i c l e i n f o
Article history: Received 8 November 2016Received in revised form 27 January 2017 Accepted 27 January 2017
Available online 8 February 2017
Editor: Dr. D. Barcelo
Sierra Nevada constitutes the southernmost and highest massif in the Iberian Peninsula, with elevations exceed-ing 3000 m. Two large glacial advances were recorded durexceed-ing the Last Glaciation and several minor advances oc-curred until the Early Holocene. Since then, periglacial activity has prevailed above 2500 m. Here, we present a new and more accurate geomorphological map of the highlands of Sierra Nevada, integrating in a GIS environ-ment i) high resolution satellite imagery, ii) topographic data, and iii)field observations. This approach has allowed a better characterization of the spatial extent of cold-climate morphogenic processes and associated landforms formed during the Last Glaciation and subsequent deglaciation. Despite its extension and high altitude, the steep relief of Sierra Nevada and its southern location conditioned a significantly lower glaciated surface (104.6 km2) with respect to other Iberian massifs. We have also inferred the paleoclimatic conditions of the study area through the calculation of Equilibrium Line Altitudes (ELAs). The distribution of the lowest moraines suggests an ELA for the maximum glacial extent at 2525 m in the northern slope and 2650 m in the southern side, increasing towards the east. Local ELA differences are related to: (i) the influence of the warmer Mediterranean Sea in contrast to the cooler Atlantic Ocean, (ii) the climate with more continental characteristics on the northern slope, and (iii) the microscale control of the local topography. Mean annual air temperatures in the ice-free sum-mit plateaus were between−4/−6 °C during the maximum local glacial extent, determining permafrost condi-tions with intense periglacial dynamics. Rock glaciers and protalus lobes developed until 2500 m, the lowest boundary for permafrost regime. The distribution of other glacial and periglacial landforms within the limits of
Keywords: Last Glaciation Geomorphological map Glacial and periglacial landforms Glacier reconstruction Equilibrium Line Altitude Paleoclimate
Sierra Nevada
Science of the Total Environment 584–585 (2017) 1256–1267
⁎ Corresponding author at: Centre for Geographical Studies—IGOT, Universidade de Lisboa, Alameda da Universidade, 1600-214 Lisbon, Portugal. E-mail address:[email protected](P. Palma).
http://dx.doi.org/10.1016/j.scitotenv.2017.01.196
0048-9697/© 2017 Elsevier B.V. All rights reserved.
Contents lists available atScienceDirect
Science of the Total Environment
the maximum ice extent provides evidence to better understand the extent of subsequent glacial stages and post-glacial landscape evolution in Sierra Nevada.
© 2017 Elsevier B.V. All rights reserved.
1. Introduction
Geomorphological mapping is an essential tool to study Earth's surface landscape that has been increasingly used to infer paleoenvironments, ex-amine natural hazards and improve land-use planning (Verstappen et al., 1991; Chueca and Julián, 2008; Ruiz-Fernández, 2011). Several method-ologies have been developed by different schools focusing on geomor-phological mapping, such as the RCP 77 of the Centre National de la Recherche Scientifique (CNRS) of France (Joly, 1997), the ITC methodol-ogy of Holland (Verstappen et al., 1991) or the specific methodology for alpine environments of the Institute of Geography of Lausanne Univer-sity (IGUL) (Schoeneich, 1993; IGUL, 1996). In Spain, geomorphological mapping has been traditionally influenced by the French CNRS method (i.e.Herrero, 1988). However, there have been several recent national
contributions proposed by the University of Zaragoza (i.e.
Peña-Monné et al., 1997) and the Instituto Geológico y Minero de España (IGME; i.e.Martín-Serrano, 2005). As a result, geomorphological map-ping has experienced a significant growth in Spain over the last decade with the generation of many maps at different spatial scales. The major-ity of them have focused on mountain environments, such as in the Pyr-enees (Serrat et al., 1994; García-Ruiz and Martí, 2001; Chueca and Julián, 2008), Cantabrian Mountains (Frochoso, 1990; García de Celis, 1997; González-Trueba, 2007), Central System (Palacios and Marcos, 1996) and Sierra Nevada (Gómez-Ortiz, 2002).
Over the last two decades Geographical Information Systems (GIS) have added additional possibilities to geomorphological mapping allowing a better characterization of the spatial distribution of processes and landforms (Pellitero, 2009; Bishop et al., 2012). Recently, another step forward has been achieved through the spatial analysis of geomor-phological phenomena (i.e.Chang et al., 2014). In the case of mountain areas glaciated during the Last Glaciation, new spatial modeling tools allow the reconstruction of paleoglaciers, together with the calculation of several morphometric and topographic parameters of those glaciers (Pellitero et al., 2016). These data can provide reliable paleoclimatic in-formation about past conditions through inferring the Equilibrium Line Altitude (ELA) (Pellitero et al., 2015). Though the reconstruction of paleo-ELAs has been inferred for most Iberian mountain ranges over the last decades (Serrano et al., 2012, 2013; Santos-González et al., 2013), studies focusing on the spatial modeling of paleoglaciers are very scarce (i.e.Vieira, 2008).
The semiarid environment of Sierra Nevada is unique in the context of European mountains thanks to its high altitude and low latitude in the western Mediterranean basin. Thefirst studies on the glacial land-scapes of Sierra Nevada date back from the late 19th and early 20th cen-turies (Schimper, 1849; Macpherson, 1875; Quelle, 1908; Obermaier, 1916). This research was complemented during the last decades with a multi-proxy scientific approach examining both the glacial and periglacial geomorphology, together with palynological, geochronolog-ical and sedimentologgeochronolog-ical evidence (Gómez-Ortiz and Salvador-Franch, 1992; Gómez-Ortiz et al., 1998, 2012, 2014; Oliva et al., 2009, 2010, 2011, 2014a, 2014b, 2016a; Anderson et al., 2011; Jiménez-Moreno and Anderson, 2012; Oliva and Gómez Ortiz, 2012). Consequently, the wide comprehension of the spatial extent and chronology of cold-cli-mate geomorphological processes in Sierra Nevada makes this massif one of the most studied mountain environments of the Iberian Peninsu-la (Oliva et al., 2014a). However, the most detailed geomorphological map of Sierra Nevada dates from the early 21st century and it is based on the United States Air Force (USAF) and on the Aerial Photography of Spain from 1956 to 1957, although it only provides a very general car-tography of the massif (Gómez-Ortiz, 2002).
In this paper, based on high resolution satellite imagery, updated to-pographic data andfield observations, we analyse the distribution of glacial and periglacial landforms existing in this massif of the southern Iberian Peninsula in a GIS environment. This is complemented with the spatial analysis of glacial landforms for a better understanding of the extent and evolution of glacial processes, and subsequent periglacial dynamics in this massif. The aim of the paper will be achieved solving specific issues such as:
1) Improve the mapping of glacial, periglacial and slope-related land-forms and deposits existing in the highlands of Sierra Nevada using high resolution imagery in a GIS environment.
2) Quantifying the maximum ice extent of glaciers during the Last Gla-ciation as well as the number of glacier tongues and its length, thick-ness, volume and associated ELA.
3) Examine the morphometric and topographic properties of glacial and periglacial landforms in order to infer paleoclimatic and paleoenvironmental implications.
4) Compare the geomorphological evolution in this massif with that oc-curred in other Iberian high mountain environments since the Last Glaciation.
2. Study area
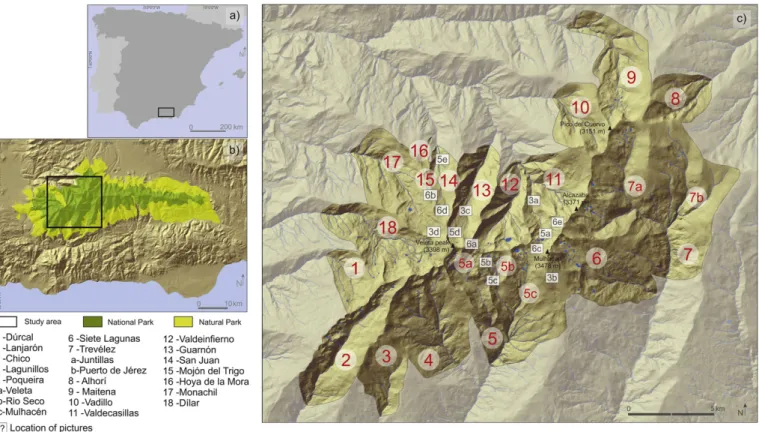
Sierra Nevada is located in the southern Iberian Peninsula, at latitude 36°55′–37°09′N and longitude 2°42′–3°31′W (Fig. 1). This massif con-stitutes the highest in the Betique Range as well as in the entire Iberian Peninsula, with elevations exceeding 3000 m asl in its westernmost fringe: Mulhacén (3478 m) and Veleta (3398 m).
Over the last 8 million years the western part of Sierra Nevada has been subject to an intense uplift process of over 3500 m that determines the existence of steep slopes and a deeply incised drainage network (Sanz de Galdeano and López-Garrido, 1999). The structural setting of the rocks plays a determinant role in driving the morphological evolu-tion of the slopes. The metamorphic bedrock shows many planes of fo-liation and joints, whose strike and dip clearly control the effectiveness of the erosion by glacial and periglacial processes in the highlands dur-ing the Quaternary (Oliva et al., 2014a). Two large glacial advances within the Last Glaciation took place at 30 and 19–20 ka (Gómez-Ortiz et al., 2012; Palacios et al., 2016). Thefirst of them was slightly larger than the glacial expansion occurred synchronously to the global Last Glacial Maximum. The global increase of temperatures after 19–20 ka (Clark et al., 2009) promoted glacial retreat in Sierra Nevada, with some significant glacial readvances until the Holocene (Palacios et al., 2016). Since then, periglacial activity has prevailed in the highest lands with ephemeral episodes of glacial appearance in the highest northern cirques, the last of which was the Little Ice Age (LIA) (Oliva and Gómez Ortiz, 2012). These geomorphic processes have promoted an intense weathering of the micaschist bedrock.
Current climate conditions in Sierra Nevada are characteristic of the high semiarid Mediterranean massifs. At 2500 m, mean annual air tem-perature (MAAT) is 4.4 °C and annual precipitation reach 710 mm con-centrated between October and April. At the Veleta peak, the MAAT between 2002 and 2013 increased from slightly negative to slightly pos-itive values, with an average MAAT for that period of 0.08 °C (Oliva et al., 2016a). The landscape of the highest areas is characterized by a very scarce vegetation cover, poorly developed soils and sparse peatland en-vironments inside the highest valley bottoms and glacial cirques.
The highest valleys of the western part of the massif—where this
re-search focuses—apart from including a wide range of glacial and
periglacial landforms and deposits above 2500 m, encompass a rich
1257 P. Palma et al. / Science of the Total Environment 584–585 (2017) 1256–1267
historical heritage of human activities (Gómez-Ortiz et al., 2013). Both natural and historical values make Sierra Nevada unique within south-ern Iberia and have been the scientific basis to designate it Biosphere Reserve (1986), Natural Park (1989) and National Park (1999). 3. Methodology
Thefirst maps including the distribution of geomorphic features in the highest lands of Sierra Nevada were carried out byMesserli (1965)
andGómez-Ortiz (2002). In this paper we provide a new and more ac-curate map of the glacial, periglacial, nival and alluvial landforms and
deposits. The map was based on theGómez-Ortiz (2002)proposal,
with several improvements and updates through photointerpretation of high resolution satellite imagery (ESRI world imagery: CNES/Airbus Ds—Pléiades Satellite, resolution of 0.5 m, Google Earth imagery) and to-pographic maps (at scale 1:25,000) in GIS environment. The map was subsequently validated in thefield. This approach allows a better char-acterization of the spatial extent of morphogenic processes as well as a more accurate understanding of environmental dynamics since the last Pleistocene glacial cycle.
The geomorphological map was generated following the RCP 77 mapping system of the Centre National de la Recherche Scientifique (Joly, 1997). According to this system, the map legend included 24 ele-ments grouped in 7 sections. The eleele-ments were mapped through GIS software (ArcGIS 10.3.1), based on aerial photography (Google Earth 7.02, 2015) and supported byfieldwork, and were subsequently edited in graphic design software (Corel Draw ×5). The morphometry and to-pography of some features of glacial (i.e. moraines) and periglacial ori-gin (i.e. rock glaciers, protalus lobes) was examined to infer patterns of distribution of cold-climate geomorphological processes
The modeling of the maximum spatial extent of paleoglaciers during the Last Glaciation was performed in GIS environment using the GlaRe toolbox (Pellitero et al., 2016), which is coded in Python and operates in ArcGIS software. The modeling process consists in four methodolog-ical steps: (1)flowline creation following the talwegs of the valleys; (2)
shear stress assignment, according to the standard referenced used value for the valley glaciers (100 kPa) (Pellitero et al., 2016); (3) flowline ice thickness calculation based on an digital elevation
model—MDT5—5 m resolution, provided by the Instituto Geográfico
Nacional of Spain—and on the two previous steps; (4) glacier surface in-terpolation that performs an inin-terpolation following the topo to raster method using the outcome of step 3, the digital elevation model, a tool to create extra ice thickness points and a glacier constraint, which is defined according to other existing glacial landforms (e.g. lateral mo-raines). This tool allows reconstructing paleoglacier's surface and also calculating length, ice thickness and volume for each glaciated valley. We should notice that this modeling process has some associated un-certainty that was already explored inPellitero et al. (2016).
These results were later used together with the Equilibrium Line Al-titude (ELA) calculation tool (Pellitero et al., 2015) to determine the ELAs for the maximum glacial extent. The tool is coded in python, runs in ArcGIS software and makes the calculations based on different methods. In this paper we estimated the ELAs implementing two of the most used methods in the scientific literature: the Accumulation Area Ratio (AAR) and the Area-Altitude Balance Ratio (AABR). We in-ferred them using a contour interval of 5 m and ratio values of 0.67 for AAR method, and 1.75 to AABR method. These ratio values are the de-fault values of the tool, which are in line with the main literature (Pellitero et al., 2015). The average of these two ELA values was calculat-ed to rcalculat-educe the uncertainty of both methods.
4. Results
The landscape of the protected area included in the National Park of Sierra Nevada encompasses a wide range of landforms and deposits generated during the Last Glaciation and subsequent deglaciation (Fig. 2). Geomorphic processes shaped and modified the preexisting relief to a greater or lesser extent, depending on the morphostructure, topog-raphy and intensity and type of morphogenic processes.
Fig. 1. (a) Location of Sierra Nevada within the Iberian Peninsula, (b) location of the study area within the protected environments in this massif, and (c) distribution of the studied valleys within the National Park of Sierra Nevada.
4.1. Glacial geomorphology
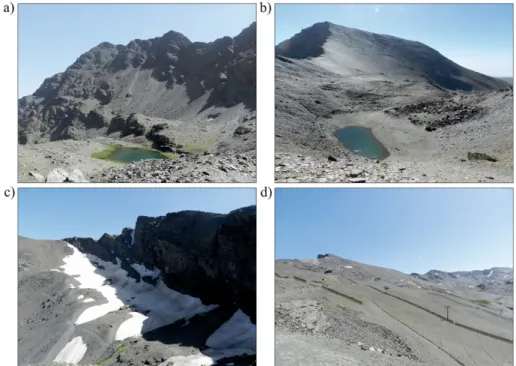
The footprint of past glacial activity in the highest lands of the massif is observable in a wide range of phenomena. The steepest northern slope of Sierra Nevada favoured more intense glacial erosion than in the gentler southern slope. Both glacial erosion and post-glacial periglacial processes promoted the development of vertical walls in the northern slopes, whereas the S and W slopes of the highest peaks show gentle slopes and less incised cirques (Fig. 3).
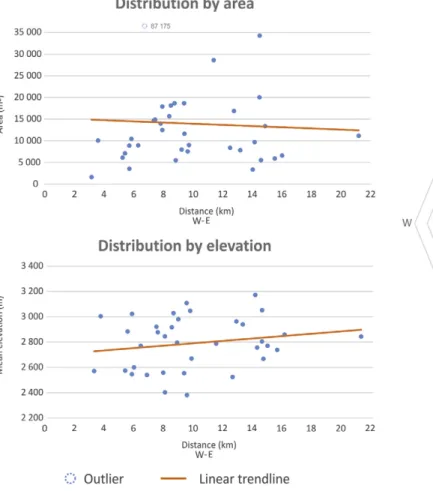
A total of 65 glacial cirques have been identified in the study area. The W-E alignment of Sierra Nevada determined the prevailing aspects of the cirques, which are mostly distributed in SE (14 units), E, N and NE aspects (10 units each) (Fig. 4). The mean cirque altitude ranges be-tween 2451 and 3227 m. In the southern slope, the cirques are distrib-uted at an average altitude of 2969 m, whereas the northern ones are placed at 2847 m. There is a clear control of the aspect on the surface covered by the glacial cirques, being larger those in northern aspects (0.68 km2) than in southern slopes (0.55 km2). Western exposed
cirques show a substantially larger size of 1.5 km2.
Other remarkable glacial erosion features are also distributed within the cirques and formerly glaciated valleys. Some of these polished sur-faces exhibit glacial striae, as has been also seen in some erratic boulders spread across the valleys.
Depositional glacial landforms are also widespread in Sierra Nevada. While glacial cirques are exclusively located within the National Park area, moraines are also placed within the domain of the Natural Park of Sierra Nevada. Several types of moraines are present in the massif de-pending on the glacier type (Fig. 5), which in turn was determined by the different glacial stages. Lateral and latero-frontal moraines are usu-ally located in the narrow and steep ravines descending from the upper parts of the massif. They are located at a mean altitude of 1935 m, with an average of 2001 m in the northern slope and 1868 m in the southern. The lowest deposits reach elevations of 1684 m in Valdeinfierno valley
and 1689 m in the Poqueira valley, in the northern and southern slopes, respectively. Several moraine systems are distributed between the low-est and highlow-est moraines, sugglow-esting different phases of glacial ad-vances and retreats.
4.2. Periglacial landforms
The highest peaks and summit plateaus were not glaciated during the Last Glaciation, but were affected by intense periglacial conditions. In the highestflat surfaces above 3000 m there are macrometric sorted-circles, such as in Mulhacén and Machos plateaus (Fig. 6). The non-glaciated en-vironments until elevations down to 1100–1200 m were also affected by periglacial activity, forming widespread talus slopes.
The deglaciation favoured the development of permafrost-related features mainly located within the glacial cirques. Rock glaciers and protalus lobes constitute bodies of frozen debris, with interstitial ice and ice lenses, which move down-slope or down-valley by deformation of the ice contained within it (French, 2007). Several definitions have been proposed for each of them considering their genesis, morphologi-cal and topographimorphologi-cal characteristics (Hamilton and Whalley, 1995; Harrison et al., 2008). In this paper, protalus lobes refer to features locat-ed below rock cliffs, at the foot of slopes and with greater width than length; the rest of permafrost-related landforms will be considered as rock glaciers.
Up to 50 rock glaciers and 36 protalus lobes have been identified in this massif. Rock glaciers range from 77 to 1366 m in length and 35 and 700 m in width, whereas protalus lobes show lengths between 90 and 440 m and widths between 26 and 292 m. Consequently, the average surface occupied by rock glaciers (5.7 ha) is substantially larger than that occupied by protalus lobes (1.3 ha). They are distributed in valley and cirque slopes, at a wide range of elevations between 2500 and 3200 m, suggesting different stages of formation. In general, rock gla-ciers are more abundant than protalus lobes in the western fringe of
Fig. 2. Geomorphological map of the highlands of Sierra Nevada.
1259 P. Palma et al. / Science of the Total Environment 584–585 (2017) 1256–1267
the study area, where elevations are higher. Therefore, the relief condi-tions the distribution of rock glaciers, with lower elevacondi-tions towards the east. Conversely, protalus lobes show a gradual increase of elevation to the east, mostly enclosed in northern cirques (Figs. 7 and 8).
A wide range of solifluction landforms developed in the highest val-leys during the last millennia at elevations between 2500 and 3000 m. Debrisflows are abundant features across the highest slopes of the mas-sif, particularly next to late-lying snow patches. Cryoturbation also pro-motes the development of centimeter-sized sorted-circles in summit plateaus above 2700 m.
4.3. Other landforms and deposits
The landscape of the highlands also includes other landforms and deposits formed by other geomorphic processes. The highly weathered
micaschists due to freeze-thaw cycles favoured the existence of abun-dant debris of various sizes and fractured rocks subsequently mobilized by nival, mass movement and alluvial processes. These processes are re-inforced by the poor soil development in the steep slopes of Sierra Nevada.
Present-day nival processes are mostly related to avalanche activity, which is the main geomorphic process during the winter season when snow covers the landscape. When snow melts, increased runoff pro-mote enhanced erosion and sediment mobilization, as well as ground-water recharge. Late-lying snow patches also trigger the formation of protalus ramparts at the foot of steep slopes and cirque walls (Fig. 2).
Apart from periglacial slope processes, mass wasting also occurs through rockfall activity and slides. Alluvial processes are particularly effective during the snow melting season. Streams redistribute the un-consolidated material deposited in the hillsides and transported it
Fig. 4. Main topographical and morphometrical characteristics of the glacial cirques.
Fig. 3. Panoramic views showing the dissymmetry between N and S-W slopes: (a) N wall of Mulhacén peak; (b) S-SW slope of Mulhacén peak; (c) N wall of Veleta peak; and (d) W slope of Veleta peak.
down-slope. The steep slopes of the ravines of Sierra Nevada favour an incised drainage network, with erosion processes prevailing over depo-sitional activity.
In relativelyflat areas inside the cirques and the highest valley bot-toms there are several wetlands. In these poorly drained environments, highly organic-rich soils develop. These areas locally known as borreguiles play a very important role within the regional context for grazing purposes.
4.4. Paleoglaciers reconstruction
The distribution of the lowest moraine deposits allows inferring the maximum extent of glaciers during the Last Glaciation in Sierra Nevada.
The pre-existing highly incised relief in Sierra Nevada conditioned decisively the extent and geography of paleoglaciers, and thus no icefield formed in the highest lands of Sierra Nevada. The total ice vol-ume accounted for 3.9 km3, extending over a surface of 104.6 km2.
The southern slope encompasses a larger glacierized surface, with 57.6 km2with respect to the 47 km2of glacial ice surface in the northern
valleys. This resulted in 58% of the glacial ice stored in the southern slope and 42% in the northern side.
The maximum ice thickness was located inside the cirques or in the confluence of different glacial systems (Fig. 9), reaching a maximum value of ca. 135 m in several valleys. The glacial cirques were not fully covered by ice due to the steep topography of the valleys that favoured the iceflowing down-valleys. The glacial systems composed of several
Fig. 5. Examples of glacial landforms in Sierra Nevada: (a) glacial threshold; (b) polished bedrock with glacial striae; (c) erratic boulder; (d) frontal moraine; and (3) lateral moraines.
Fig. 6. Examples of periglacial features in Sierra Nevada formed during different stages: (a) sorted-circles developed during the Last Glaciation; (b) rock glaciers formed during the deglaciation; (c) active protalus lobes at present; (d) solifluction lobes developed during the Holocene; and (e) active talus cones under present-day climate conditions.
1261 P. Palma et al. / Science of the Total Environment 584–585 (2017) 1256–1267
tributaries were those encompassing a larger glaciated surfaces and ice volume, such as it occurred in Trevélez (16.8 km2, 0.8 km3) and Valdesaillas-Valdeinfierno (10.8 km2, 0.3 km3) (Table 1).
Alpine glaciers were mostly confined within their valleys, with only small-scale ice transfluence with adjacent valleys, such as it occurred in San Juan and la Mora valleys (Fig. 9). The longest alpine glaciers corre-spond to those located in the southern slope of the Sierra Nevada, name-ly Trevélez and Lanjarón, with 9.8 and 9.2 km, respectivename-ly. In the lowest parts, the glaciers were deeply channelized through incised valleys with several km and a narrowness between tens of meters wide and 450 m. The moraines left by the glaciers during the maximum local extent of the Last Glaciation suggest that the Equilibrium Line Altitude (ELA) was placed at 2371–2659 m (average of 2515 m) in the northern slope and 2546–2751 m (average of 2651 m) in the southern, respectively (Table 1). The ELAs show a clear increasing trend towards the E in the southern slope, where the lowest glacial landforms in the western fringe of the massif suggested an ELA situated around 2550–2600 m and in the east-ern side moderately higher at 2700–2750 m. This pattern is not detected in the northern slope, where the much steeper relief imposes significant local ELA differences between adjacent valleys.
5. Discussion
This research provides an update of the study published in 2002 using the aerial images of the USAF Aerial Photography of Spain from 1956 to 1957 (Gómez-Ortiz, 2002). The availability of high resolution satellite imagery and new computational resources, namely GIS tech-niques, allowed a better mapping of the geomorphological features that resulted in a better characterization of the glacial and post-glacial evolution of the landscape in Sierra Nevada.
5.1. Topographical and morphometrical characterization of glacial and periglacial phenomena
Regional climate conditions in Sierra Nevada are defined by higher temperatures and lower precipitations with respect to those prevailing in other high Iberian massifs. The current 0 °C isotherm in Sierra Nevada is located at 3400 m (Oliva et al., 2016a), whereas it lies around 2400– 2500 m in the Cantabrian Mountains (Muñoz, 1982) and 2725 m in the Pyrenees (Barrio et al., 1990). The present-day climate values are helpful to better frame the present distribution of periglacial features in Sierra Nevada in comparison to other Iberian mountain ranges and allow inferring approximate paleoclimate conditions during the local maximum glacial extent of the Last Glaciation.
The highest peaks and ridges constituted nunataks that stood out above the glaciated environments during the Last Glaciation. These ridges defined the limits of the glacial cirques, which have been defined as a hollow, open downstream but bounded upstream by the crest of a steep slope (‘headwall’) which is arcuate in plan around a more gently-slopingfloor (Evans and Cox, 1974; Glasser and Bennett, 2004; Barr and Spagnolo, 2015). The glacial cirques in Sierra Nevada oscillate between average altitudes of 2451 and 3227 m, with higher elevations in the southern slopes and increasing towards the east (Fig. 4). The more abundance of glacial cirques in northern slopes, as well as the existence of glacial cirques at higher elevations in southern slopes, is a widespread pattern observed in most of the Northern Hemisphere mountain ranges (Trenhaile, 1975; Evans, 1977; Evans and Cox, 1995). Glacial cirques in Sierra Nevada are situated, in general, at elevations between 300 and 1000 m higher with respect to northern Iberian massifs. These eleva-tions are similar to the ELA difference inferred for the maximum extent of the Last Glaciation between Sierra Nevada and northern Iberian mountains (Pérez-Alberti and Valcárcel, 1998; Pérez-Alberti et al., Fig. 7. Distribution and main topographical characteristics of rock glaciers.
Fig. 8. Distribution and main topographical characteristics of protalus lobes.
Fig. 9. Reconstruction of paleoglaciers based on the location of the lowermost moraine deposits formed during the maximum glacial extent of the Last Glaciation. 1263 P. Palma et al. / Science of the Total Environment 584–585 (2017) 1256–1267
2004). In the Central Pyrenees, glacial cirques range between 2500 and 2700 m, being almost inexistent below 2100 m (García-Ruiz et al., 2000). These elevations are significantly lower in the humid Cantabrian Mountains, where the average of the cirques oscillates between 1745 and 2080 m (Ruiz-Fernández et al., 2009). With regards to the surface covered by the cirques, these are significantly larger in Sierra Nevada (67.2 ha) than in the Central Pyrenees where they extend over an aver-age area of 34 ha (García-Ruiz et al., 2000) and Cantabrian Mountains where they range between 11 and 37 ha (Ruiz-Fernández et al., 2009; Gómez-Villar et al., 2015). The large cirques in Sierra Nevada have been interpreted to be a result of the morphostructure and the highly weathered bedrock that favoured the development of large armchair-shaped erosional hollows in the headwaters of the highest valleys (Gómez-Ortiz, 2002). Someflat areas inside the cirques are home of a rich biodiversity (Molero-Mesa and Pérez Raya, 1987) and have been, historically, extended by shepherds through the derivation of snow melt waters (Oliva, 2009) and have been used for paleoenvironmental purposes (Oliva et al., 2011; Jiménez-Moreno and Anderson, 2012).
A general pattern is detected in the distribution of the lowest mo-raine deposits in the Sierra Nevada, with higher elevations in southern valleys and towards the east, as also referred inOliva et al. (2014a, 2014b). The distribution of the lowest moraines allows calculating the total glaciated surface in Sierra Nevada during the maximum glacial ad-vance of the Last Glaciation. Despite concentrating the highest peaks in the Iberian Peninsula, the steep relief of this massif conditioned a rela-tively small glacierized area (104.6 km2) in comparison to other lower and smaller Iberian massifs. This value is almost twice the extent (54 km2) inferred in former studies (Allen et al., 2008). For the upper
Garona basin,Fernandes et al. (2017-in this issue)reconstructed a gla-cial extent of ca. 852 km2;Serrano et al. (2012)estimated ca. 91 km2
of ice surface for the Central and Eastern massifs of the Picos de Europa andRuiz-Fernández et al. (2016)inferred an extent of ca. 73 km2for the
maximum ice extent in the Western Massif;Vieira (2008)proposed a glacierized surface of ca. 66 km2for the icefield formed in Serra da
Estrela during the local glacial maximum, andCarrasco et al. (2013)a glacierized surface of ca. 57 km2for the plateau glacier of Sierra de Béjar, both in the Central Iberian Range. The chronology of the local gla-cial maximum extent in Sierra Nevada has been established through cosmogenic dating at 30–32 ka, with a second glacial advance very close to the maximum at 19–20 ka (Gómez-Ortiz et al., 2012; Palacios et al., 2016). Therefore, Sierra Nevada constitutes a transitional area
with regards to the chronology of the maximum extent between the NW mountains where a maximum expansion has been proposed at 35–45 ka cal BP (Jiménez and Farias, 2002; Moreno et al., 2010; Pérez-Alberti et al., 2011; Serrano et al., 2012, 2013, 2015; Nieuwendam et al., 2015; Ruiz-Fernández et al., 2016) and the Pyrenees and Central Iberian Range where the local maximum was during the Marine Isotope Stage-4 with a readvance almost synchronous with the global Last Glacial Maximum (Pallàs et al., 2006; Delmas et al., 2008, 2011; Palacios et al., 2011, 2012a, 2012b, 2015; Carrasco et al., 2013; García-Ruiz et al., 2014). The different moraine systems identified with-in the glaciated environment durwith-ing the local maximum extent (Fig. 2) correspond to different glacial stages that have been already dated in former studies, namely the Oldest and Younger Dryas (Gómez-Ortiz et al., 2012; Palacios et al., 2016) as well as Holocene cold phases including the LIA (Gómez-Ortiz et al., 2009; Oliva and Gómez Ortiz, 2012).
With regards to other erosional and depositional glacial landforms and deposits (glacial thresholds, polished bedrock, erratic boulders, till, etc.), no clear regional pattern can be inferred. They are distributed in a wide range of elevations, being generally better preserved at higher elevations. The features may be indicative of different glacial stages, and in some cases, their relative morphostratigraphic position can be used to infer an approximate timing for their formation.
Periglacial phenomena show a larger elevation belt, from about
1100–1200 m to the top of the mountains (Gómez-Ortiz and
Salvador-Franch, 1992). Their distribution suggests the sequence of colder-warmer conditions that have prevailed in Sierra Nevada during the Late Pleistocene. The lowest deposits developed during the coldest period of the Last Glaciation, whereas above 2500 m periglacial process-es are still active.
Outside the area previously occupied by the glaciers, were recorded several rock glaciers and protalus lobes most of them formed during the deglaciation process as shown byOliva et al. (2016b). Rock glaciers de-veloped in areas below the local ELA and also in environments above the ELA where the topography did not favour snow accumulation and sub-sequent transformation into glacial ice. The lowest rock glacier is locat-ed at 2505 m in San Juan valley. Up to 3 from the 50 rock glaciers mapped in Sierra Nevada developed during the Last Glaciation outside the glaciated environment, whereas the rest formed during the deglaci-ation process. Among the latter, most of them formed during the Bølling-Allerød period following glacier disappearance, and thus devel-oped under paraglacial conditions (Palacios et al., 2016). Today, there is
Table 1
Main spatial characteristics of paleoglaciers in Sierra Nevada.
Valley Slope Glaciated surface (km2) Ice volume (km3) ELA1 (AABR) (m) ELA2 (AAR) (m) ELA average
1 - Dúrcal S 3.41 0.12 2639 2599 2619 2 - Lanjarón S 7.68 0.32 2642 2652 2647 3 - Chico S 4.28 0.12 2579 2514 2547 4 - Lagunillos S 9.35 0.25 2587 2562 2575 5 - Poqueira 5a - Veleta S 9.03 0.37 2713 2743 2728 5b - Rio Seco S 5c - Mulhacén S 6 - Siete Lagunas S 7.06 0.27 2708 2678 2693 7 - Trevélez 7a - Juntillas S 16.77 0.82 2727 2777 2752 7b - Puerto de Jérez S 8 - Alhorí N 3.31 0.08 2514 2459 2487 9 - Maitena N 6.60 0.24 2429 2323 2376 10 - Vadillo N 3.51 0.08 2521 2456 2489 11 - Valdecasillas N 10.77 0.33 2540 2510 2525 12 - Valdeinfierno N 13 - Guarnón N 4.06 0.11 2490 2440 2465 14 - San Juan N 2.08 0.09 2658 2603 2630
15 - Mojón del Trigo N 0.06 0.00 2636 2641 2639
16 - Hoya dela Mora N 0.50 0.02 2367 2374 2371
17 - Monachil N 6.95 0.26 2444 2394 2419
18 - Dílar N 9.19 0.42 2677 2642 2659
S slope S 57.57 2.27 2656 2646 2651
N slope N 47.03 1.62 2527 2484 2515
Total – 104.6 3.89 2592 2565 2578
still one active rock glacier in the Veleta cirque derived from a LIA glacier which is undergoing a degradation process as a response of the warmer conditions of the last decades in southern Iberia (Gómez-Ortiz et al., 2014).
Consequently, the wide range of elevations at which rock glaciers are distributed is not, by itself, indicative of certain paleoclimate condi-tions, but a consequence of the sequence of deglaciation stages through which the massif has undergone since the Late Pleistocene. Rock gla-ciers show very different dimensions, with an average of 5.7 ha. They are almost twice larger than those reported in other Iberian massifs; in the Pyrenees active rock glaciers cover an average surface of 3 ha (Serrano et al., 1999), as occurs in the Cantabrian Mountains, where the mean area has been also estimated at 3 ha in the Gistredo Range (Redondo-Vega et al., 2005) and in Fuentes Carrionas Massif (Pellitero, 2012).
A similar pattern is observed with regards to protalus lobes, which cover an average surface of 1.3 ha. Although there are no absolute ages about their formation, their morphostratigraphical position with respect to moraine complexes suggests that some of them developed during the Last Glaciation outside the glaciated environment at eleva-tions down to 2500 m; however, they mostly developed during the de-glaciation process until today, when there are some still active next to the highest cirque walls, such as the northern Mulhacén wall (Fig. 6c). In other areas such as in the Central Pyrenees, protalus lobes have been recorded to be only active at elevations of 2850 m ( González-García et al., 2016). Active protalus lobes today in the Central Pyrenees show a slightly smaller size than those currently active in Sierra Nevada, with an average surface of 0.9 in the Maladeta Massif (Central Pyrenees;
González-García et al., 2016). 5.2. ELAs and paleoclimate conditions
The steep relief of Sierra Nevada determined an ELA for the maxi-mum local extent situated at 2515 m in the northern slope and 2649 m in the southern side, whereas in the rest of Iberian massifs it was well below 2000 m—except in the Eastern Pyrenees where it was placed at ca. 2100 m—reaching elevations below 1000 m in the NW cor-ner (Pérez-Alberti et al., 2004). This must be framed with the general trend in Iberia where the ELA increased from N to S (latitude influence) and W to E (influence of the colder Atlantic ocean with respect to the warmer Mediterranean Sea) (Oliva et al., 2014a, 2014b). The distribu-tion of the lowest moraine deposits in Sierra Nevada also reflects this pattern with increasing elevations in southern and eastern slopes that are translated in higher ELAs in these areas. This was a consequence of the warmer temperatures in the southern and eastern slopes influenced by the warm Mediterranean Sea, whereas in the northern and western sides the effects of the continentality and the cooler Atlantic influence, respectively, determined lower temperatures, and thus, lower ELAs (Oliva et al., 2014a, 2014b). Therefore, the presence of the warmer mar-itime influence in the southern slope of Sierra Nevada promoted that the effects of the continental climate in the northern side were the op-posite of what occurs in other mountain areas such as in northern Scan-dinavia where it is reflected in higher ELAs (Holmlund and Schneider, 1997).
However, significant differences on ELAs elevations are found be-tween adjacent valleys in Sierra Nevada. This may be due to the fact that topographic conditions highly constrained the regional climatic setting inducing a decisive microclimatic control on glacial develop-ment, as shown byPalacios et al. (2016)for the later stages of the degla-ciation process. An example of this is found in Hoya de la Mora where the ELA is placed at 2371 m whereas in the nearby and larger San Juan valley the ELA is situated at 2630 m; in both cases the moraine systems generated during the maximum local extent were dated at 20–21 ka (Palacios et al., 2016). Apart from the local topography (Hoya de la Mora; wide gentle cirque; San Juan; steep alpine valley), this difference
of 260 m—which could be translated into 1.6 °C difference—was
counterbalanced by the higher snow accumulation in the eastern ex-posed cirques where extra snow accumulates due to wind redistribu-tion brought by the prevailing western winds. Also, the deepest valleys show lower ELAs than wider valleys. Solar radiation may impact in a stronger way in these broader valleys, therefore increasing ablation and reducing the length of the glacial systems, which is translated in higher ELAs. Conversely, the steeply incised valleys are better protected from solar radiation than open valley bottoms, which determined nar-row glaciers and lower ELAs. This is the case of San Juan and Guarnón valleys, where despite being located next to each other, the ELAs were placed at 2630 and 2465 m, respectively.
The ELAs may provide a relative approach to regional paleoclimate conditions (Lie et al., 2003). In the case of Sierra Nevada, the complexity of its regional climate system and its rough terrain generates a wide spectrum of microclimates in terms of winds, temperatures, snow accu-mulation, etc. (Pereira et al., 2016). Taking into account the large topo-graphical control on ELAs in Sierra Nevada, we may infer approximate paleoclimate conditions for the stage with the maximum glacial extent during the Last Glaciation. Using the present-day thermal vertical lapse rate inferred for the southern and northern Sierra Nevada of 0.50 and 0.65 °C 100 m−1, respectively (Oliva, 2009), and considering that the ELA was situated at 2515–2649 m, the MAATs at the highest peaks
must have been between−4 and −6 °C. This is consequent with the
fact that the model also shows the existence of large ice-fee environ-ments during the Last Glaciation in the highlands of Sierra Nevada where macrometric sorted-circles developed. At present, these kind of periglacial features form only in surface plateaus where very intense cryogenic conditions prevail and permafrost is present (Washburn, 1979; French, 2007). Therefore, the non-glaciated highlands of Sierra Nevada during the Last Glaciation were subjected to permafrost condi-tions. These conditions probably developed until elevations of ca. 2500 m according to the presence of a rock glaciers from that stage in San Juan valley and at the foot of the Mojón del Trigo Observatory (Fig. 6b).
6. Conclusions
Scientific knowledge about the Last Glaciation has substantially in-creased over the last decades with the new advances in absolute dating techniques and recently through the new methodological tools—such as GIS techniques—than can provide a better characterization of the im-pact of cold-climate geomorphological processes on the present-day landscape in mountain environments. In the case of Sierra Nevada, the highest massif in southern Europe, significant advances have been achieved over the last years improving the chronology of the local max-imum glacial extent; however, this progress has not been parallel to an improvement of the spatial characterization of glacial and periglacial phenomena.
Through the combination offield observations, topographic data and high resolution satellite imagery in a GIS environment, we have pro-duced a new detailed geomorphological map of the highlands of Sierra Nevada. Also, we have modeled the distribution of glaciers during the last Pleistocene glaciation. This has allowed to give response to unsolved scientific questions formerly raised in the scientific literature, such as: the total glaciated extent in the massif, determination of ELAs and asso-ciated paleoclimate conditions, identification of the lower limit of per-mafrost distribution during the Last Glaciation, as well as providing an accurate morphometrical and topographical characterization of glacial and periglacial landforms in Sierra Nevada.
The methodology used in this research to model the extent of paleoglaciers has been shown to be adequate and results represent a substantial improvement with respect to former studies, including new data on spatial characteristics of glaciation and paleoclimatic con-ditions during the Last Glaciation. Paleoglaciers are better represented in the areas where moraine remnants are better preserved, as well as in valleys with steep terrain. In some other cases, the absence of glacial
1265 P. Palma et al. / Science of the Total Environment 584–585 (2017) 1256–1267
landforms in the lowest glaciated environments impedes a better modeling of the ice extent.
The boundary location of Sierra Nevada between the cooler Atlantic Ocean and the warmer Mediterranean Sea conditioned the distribution of glacial (i.e. cirques) and periglacial (i.e. rock glaciers, protalus lobes) landforms at lower elevations in the western fringe of the massif with respect to the eastern side. Glacial development during the maximum ice extent of the Last Glaciation was, logically, strongly influenced by cli-mate conditions prevailing over south Iberia, but also highly constrained by the local steep topography of the massif. Both factors de-termined the lowest altitudes reached by glaciers as well as the glaciarized surface in each valley, highly variable from one to another. Modeling paleoglaciers also confirms the inexistence of glacial ice on the relativelyflat surfaces of the highest summits, which recorded MAATs between−4 to −6 °C, and therefore were subjected to intense periglacial dynamics under permafrost regime. Permanently frozen conditions in the ground may have occurred until elevations of ca. 2500 m.
Acknowledgements
Pedro Palma acknowledges the Portuguese Science Foundation for funding a PhD fellowship during which this paper was written. Cristina García-Hernández thanks the support of the Spanish Ministry of Educa-tion, Culture and Sport through the FPU Training Programme for Aca-demic Staff. This research was conducted thanks to different projects of the Spanish Ministry of Economy and Competitiveness. We are also grateful to Sierra Nevada National Park for their support in thefield. References
Allen, R.J., Siegert, M.J., Payne, T., 2008. Reconstructing glacier-based climates of LGM Eu-rope and Russia—part 2: a dataset of LGM precipitation/temperature relations de-rived from degree-day modelling of palaeo glaciers. Clim. Past 4:249–263.http:// dx.doi.org/10.5194/cp-4-249-2008.
Anderson, R.S., Jiménez-Moreno, G., Carrión, J.S., Pérez-Martínez, C., 2011.Post-glacial his-tory of alpine vegetation,fire and climate from Laguna de Rio Seco, Sierra Nevada, southern Spain. Quat. Sci. Rev. 30 (13–14), 1615–1629.
Barr, D., Spagnolo, M., 2015.Glacial cirques as palaeoenvironmental indicators: their po-tential and limitations. Earth-Sci. Rev. 151, 48–78.
Barrio, G., Creus, J., Puigdefábregas, J., 1990.Thermal seasonality on the high mountain belts of the Pyrenees. Mt. Res. Dev. 130, 29–31.
Bishop, M.P., James, L.A., Shroder, J.F., Walsh, S.J., 2012.Geospatial technologies and digital geomorphological mapping: concepts, issues and research. Geomorphology 137, 5–26.
Carrasco, R.M., Pedraza, J., Domínguez-Villar, D., Villa, J., Willenbring, J.K., 2013.The pla-teau glacier in the Sierra de Bejar (Iberian Central System) during its maximum ex-tent. Reconstruction and chronology. Geomorphology 196, 83–93.
Chang, K.T., Chiang, S.H., Chen, Y.C., Mondini, A., 2014.Modeling the spatial occurrence of shallow landslides triggered by typhoons. Geomorphology 208, 137–148.
Chueca, J., Julián, A., 2008.Geomorphological map of the Alta Ribagorza (Central Pyrenees, Spain). J. Maps 4 (1), 235–247.
Clark, P.U., Dyke, A.S., Shakun, J.D., Carlson, A.E., Clark, J., Wohlfarth, B., Mitrovica, J.X., Hostetler, S.W., McCabe, A.M., 2009.The last glacial maximum. Science 325, 710–714.
Delmas, M., Gunnell, Y., Braucher, R., Calvet, M., Bourlès, D., 2008.Exposure age chronol-ogy of the last glaciation in the Eastern Pyrenees. Quat. Res. 69, 231–241.
Delmas, M., Calvet, M., Gunnell, Y., Braucher, R., Bourlès, D., 2011.Palaeogeography and 10Be exposure age chronology of Middle and Late Pleistocene glacier systems in the northern Pyrenees: implications for reconstructing regional palaeoclimates. Palaeogeogr. Palaeoclimatol. Palaeoecol. 305, 109–122.
Evans, I.S., 1977.World-wide variations in the direction and concentration of cirque and glacier aspects. Geogr. Ann. 59A (3–4), 151–175.
Evans, I.S., Cox, N.J., 1974.Geomorphometry and the operational definition of cirques. Area 6, 150–153.
Evans, I.S., Cox, N.J., 1995.The form of glacial cirques in the English Lake District, Cumbria. Z. Geomorphol. N. F. 39, 175–202.
Fernandes, M., Oliva, M., Palma, P., Ruiz-Fernández, J., Lopes, L.,Glacial stages and post-glacial environmental evolution in the Upper Garonne valley, Central Pyrenees. Sci. Total Environ. 584-585, 1282–1299 (in this issue).
French, H.M., 2007.The periglacial environment. third ed. John Wiley, New York.
Frochoso, M., 1990.Geomorfología del Valle del Nansa, Servicio de Publicaciones de la Universidad de Cantabria, Santander (290 pp.).
García de Celis, A., 1997.El relieve de la Montaña Occidental de León. Secretariado de Publicaciones de la Universidad de Valladolid, Valladolid (290 pp.).
García-Ruiz, J.M., Martí, C., 2001.Mapa Geomorfológico del Parque Nacional de Ordesa y Monte Perdido. OAPN, Ministerio de Medio Ambiente, Madrid (106 pp.).
García-Ruiz, J.M., Gómez-Villar, A., Ortigosa, L., Martí-Bono, C., 2000.Morphometry of gla-cial cirques in the Central Spanish Pyrenees. Geogr. Ann. Ser. A 82 (4), 433–442.
García-Ruiz, J.M., Palacios, D., de Andrés, N., Valero-Garcés, B.L., López-Moreno, J.I., Sanjuán, Y., 2014.Holocene and‘Little Ice Age’ glacial activity in the Marboré Cirque, Monte Perdido Massif, Central Spanish Pyrenees. The Holocene 24 (11), 1439–1452.
Glasser, N.F., Bennett, M.R., 2004.Glacial erosional landforms: origins and significance for palaeoglaciology. Prog. Phys. Geogr. 28, 43–75.
Gómez-Ortiz, A., 2002.Mapa geomorfológico de Sierra Nevada. Granada, Consejería de Medio Ambiente de la Junta de Andalucía.
Gómez-Ortiz, A., Salvador-Franch, F., 1992.Aportaciones significativas al conocimiento del glaciarismo y periglaciarismo de Sierra Nevada. Notes Geogr. Fis. 20-21, 89–101.
Gómez-Ortiz, A., Salvador-Franch, F., Sánchez-Gómez, S., Simón, M., Capel, J.J., Schulte, L., García-Navarro, A., 1998.Morfología de cumbres de Sierra nevada. Una aproximación a la dinámica glaciar y periglaciar. In: Gómez Ortiz, A., Salvador-Franch, F., Schulte, L., García-Navarro, A. (Eds.), Itinerarios geomorfológicos por Andalucía Oriental. Servei de Gestió i Evolució del Paisatge. Universitat de Barcelona, pp. 37–63.
Gómez-Ortiz, A., Palacios, D., Schulte, L., Salvador-Franch, F., Plana, J.A., 2009.Evidences from historical documents of landscape evolution after Little Ice Age of a Mediterra-nean high mountain area, Sierra Nevada, Spain (eighteenth to twentieth centuries). Geogr. Ann. Ser. A 91, 279–289.
Gómez-Ortiz, A., Palacios, D., Palade, B., Vázquez-Selem, L., Salvador-Franch, F., 2012.The deglaciation of the Sierra Nevada (Southern Spain). Geomorphology 159-160, 93–105.
Gómez-Ortiz, A., Oliva, M., Salvà-Catarineu, M., Salvador-Franch, F., 2013.The environ-mental protection of landscapes in the high semiarid Mediterranean mountain of Si-erra Nevada National Park (Spain): historical evolution and future perspectives. Appl. Geogr. 42, 227–239.
Gómez-Ortiz, A., Oliva, M., Salvador-Franch, F., Salvà-Catarineu, M., Palacios, D., Sanjosé-Blasco, J.J., de Tanarro-García, L.M., Galindo-Zaldivar, J., Sanz de Galdeano, C., 2014.
Degradation of buried ice and permafrost in the Veleta cirque (Sierra Nevada, Spain) from 2006 to 2013 as a response to recent climate trends. Solid Earth 5, 979–993.
Gómez-Villar, A., Santos-González, J., González-Gutiérrez, R.B., Redondo-Vega, J.M., 2015.
Glacial cirques in the southern side of the Cantabrian Mountain of southwestern Eu-rope. Geogr. Ann. Ser. A 97 (4), 633–651.
González-García, M., Serrano, E., Sanjosé, J.J., González-Trueba, J.J., 2016. Surface dynamic of a protalus lobe in the temperate high mountain. Western Maladeta, Pyrenees. Ca-tena.http://dx.doi.org/10.1016/j.catena.2016.08.011.
González-Trueba, J.J., 2007.Geomorfología del Macizo Central del Parque Nacional de Picos de Europa. OAPN, Ministerio de Medio Ambiente, Madrid (231 pp.).
Google Earth 7.02, 2015.Sierra Nevada, 37° 3′21.61″N, 3°21′56.63″W, Elevation 3360 m (viewed 10 September 2016).
Hamilton, S.J., Whalley, W.B., 1995.Rock glacier nomenclature: a reassessment. Geomor-phology 14, 73–80.
Harrison, S., Whalley, B., Anderson, E., 2008.Relict rock glaciers and protalus lobes in the British Isles: implications for Late Pleistocene mountain geomorphology and palaeoclimate. J. Quat. Sci. 23, 287–304.
Herrero, M., 1988.Mapa geomorfológico de Toledo-Sonseca, at 1:50,000 scale. Instituto Geográfico Nacional of Spain, Madrid.
Holmlund, P., Schneider, T., 1997.The effect of continentality on glacier response and mass balance. Ann. Glaciol. 24, 272–276.
IGUL, 1996.Légende pour le levé de cartes géomorphologiques au 1:10.000. 3éme édition. Institut de Géographie. Université de Lausanne (13 pp.).
Jiménez, M., Farias, P., 2002.New radiometric and geomorphologic evidences of a last gla-cial maximum older than 18 ka in SW European mountains: the example of Redes Natural Park (Cantabrian Mountains, NW Spain). Geodin. Acta 15, 93–101.
Jiménez-Moreno, G., Anderson, R.S., 2012.Holocene vegetation and climate change re-corded in alpine bog sediments from the Borreguiles de la Virgen, Sierra Nevada, southern Spain. Quat. Res. 77 (1), 44–53.
Joly, F., 1997.Glossaire de géomorphologie. Base de données sémiologiques pour la cartographie. Armand Colin, París (325 pp.).
Lie, Ø., Dahl, S.O., Nesje, A., 2003.A theoretical approach to glacier equilibrium-line alti-tudes using meteorological data and glacier mass-balance records from southern Norway. The Holocene 13 (3), 365–372.
Macpherson, J., 1875.De la existencia de fenómenos glaciares en el sur de Andalucía durante la época cuaternaria. Acta de la Sociedad Española de Historia Natural IV, pp. 56–61.
Martín-Serrano, A., 2005.Mapa Geomorfológico de España y del margen continental (1: 1,000,000 scale). IGME, Madrid (232 pp.).
Messerli, B., 1965.Beitrage zur Geomorphologie der Sierra Nevada (Andalusien). Juris Verlag, Zürich.
Molero-Mesa, J., Pérez Raya, F., 1987.Laflora de Sierra Nevada. University of Granada, Granada.
Moreno, A., Valero-Garcés, B.L., Jiménez-Sánchez, M., Domínguez-Cuesta, M.J., Mata, M.P., Navas, A., González-Sampériz, P., Stoll, H., Farias, P., Morellón, M., Corella, J.P., Rico, M., 2010.The last deglaciation in the Picos de Europa National Park (Cantabrian Moun-tains, Northern Spain). J. Quat. Sci. 25 (7), 1076–1091.
Muñoz, J., 1982.Geografía Física. El relieve, el clima y las aguas. In: Quirós, F. (Ed.), Geografía de Asturias, Ayalga Ediciones. 1 (271 pp.).
Nieuwendam, A., Ruiz-Fernández, J., Oliva, M., Freitas, C., Paio, V., Cruces, A., 2015. Postgla-cial landscape changes and cryogenic processes in the Picos de Europa (Northern Spain) reconstructed from geomorphological mapping and microstructures on quartz grains. Permafr. Periglac. Process. 27, 96–108.
Obermaier, H., 1916.Los glaciares cuaternarios de Sierra Nevada. Trabajos del Museo Nacional de Ciencias Naturales. Geología 17, pp. 1–68.
Oliva, M., 2009.Reconstrucció paleoambiental holocena de Sierra Nevada a partir de registres sedimentaris. PhD Thesis. University of Barcelona.
Oliva, M., Gómez Ortiz, A., 2012.Late Holocene environmental dynamics and climate var-iability in a Mediterranean high mountain environment (Sierra Nevada, Spain) in-ferred from lake sediments and historical sources. The Holocene 22 (8), 915–927.
Oliva, M., Schulte, L., Gómez Ortiz, A., 2009.Morphometry and Late Holocene activity of solifluction landforms in the Sierra Nevada (Southern Spain). Permafr. Periglac. Pro-cess. 20 (4), 369–382.
Oliva, M., Gómez Ortiz, A., Schulte, L., 2010.Tendencia a la aridez en Sierra Nevada desde el Holoceno Medio inferida a partir de sedimentos lacustres. Boletín de la Asociación de Geógrafos Españoles 52, 27–42.
Oliva, M., Schulte, L., Gómez Ortiz, A., 2011.The role of aridification in constraining the el-evation range of Holocene solifluction processes and associated landforms in the periglacial belt of the Sierra Nevada (Southern Spain). Earth Surf. Process. Landf. 36, 1279–1291.
Oliva, M., Gómez Ortiz, A., Palacios, D., Salvador-Franch, F., Salvà-Catarineu, M., 2014a. En-vironmental evolution in Sierra Nevada (South Spain) since the Last Glaciation based on multi-proxy records. Quat. Int. 353, 195–209.
Oliva, M., Gómez Ortiz, A., Salvador-Franch, F., Salvà-Catarineu, M., 2014b.Present-day so-lifluction processes in the semiarid range of Sierra Nevada (Spain). Arct. Antarct. Alp. Res. 46 (2), 73–78.
Oliva, M., Gómez Ortiz, A., Salvador-Franch, F., Salvà-Catarineu, M., Ramos, M., Palacios, D., Tanarro, L., Pereira, P., Ruiz-Fernández, J., 2016a.Inexistence of permafrost at the top of Veleta peak (Sierra Nevada, Spain). Sci. Total Environ. 550, 484–494.
Oliva, M., Serrano, E., Gómez Ortiz, A., González-Amuchastegui, M.J., Nieuwendam, A., Palacios, D., Pellitero-Ondicol, R., Pérez-Alberti, A., Ruiz-Fernández, J., Valcárcel, M., Vieira, G., Antoniades, D., 2016b.Spatial and temporal variability of periglaciation of the Iberian Peninsula. Quat. Sci. Rev. 137, 176–199.
Palacios, D., Marcos, J., 1996.La elaboración de la cartografía de riesgos geomorfológicos y su aplicación en áreas de alta montaña. Serie Geográfica 6, pp. 59–97.
Palacios, D., Marcos, J., Vázquez-Selem, L., 2011.Last Glacial Maximum and deglaciation of Sierra de Gredos, central Iberian Peninsula. Quat. Int. 233, 16–26.
Palacios, D., Andrés, N., Marcos, J., Vázquez-Selem, L., 2012a.Glacial landforms and their paleoclimatic significance in Sierra de Guadarrama, Central Iberian Península. Geo-morphology 139-140, 67–78.
Palacios, D., Andrés, N., Marcos, J., Vázquez-Selem, L., 2012b.Maximum glacial advance and deglaciation of the Pinar Valley (Sierra de Gredos, Central Spain) and its signifi-cance in the Mediterranean context. Geomorphology 177-178, 51–61.
Palacios, D., Gómez-Ortiz, A., de Andrés, N., Vázquez-Selem, L., Salvador-Franch, F., Oliva, M., 2015.Maximum extent of Late Pleistocene glaciers and Last Deglaciation of La Cerdanya mountains, Southeastern Pyrenees. Geomorphology 231, 116–129.
Palacios, D., Gómez-Ortiz, A., Andrés, N., Salvador, F., Oliva, M., 2016.Timing and new geo-morphologic evidence of the Last Deglaciation stages in Sierra Nevada (southern Spain). Quat. Sci. Rev. 150, 110–129.
Pallàs, R., Rodes, A., Braucher, R., Carcaillet, J., Ortuno, M., Bordonau, J., Bourles, D., Vilaplana, J.M., Masana, E., Santanach, P., 2006.Late Pleistocene and Holocene glacia-tion in the Pyrenees: a critical review and new evidence from 10Be exposure ages, south-central Pyrenees. Quat. Sci. Rev. 25, 2937–2963.
Pellitero, R., 2009.Application of an alpine geomorphological mapping system to an atlan-tic mountain environment: the Curavacas Massif (Cantabrian Range, Northwest Spain). J. Maps 5, 194–205.
Pellitero, R., 2012.Geomorfología, paleoambiente cuaternario y geodiversidad en el macizo de Fuentes Carrionas-Montaña Palentina. Unpublished PhD Thesis. University of Valladolid.
Pellitero, R., Rea, B., Spagnolo, M., Bakke, J., Hughes, P., Ivy-Ochs, S., Lukas, S., Ribolini, A., 2015.A GIS tool for automatic calculation of glacier equilibrium-line altitudes. Comput. Geosci. 82, 55–62.
Pellitero, R., Rea, B., Spagnolo, M., Bakke, J., Ivy-Ochs, S., Frew, C.R., Hughes, P., Ribolini, A., Lukas, S., Renssen, H., 2016.GlaRe, a GIS tool for reconstruct the 3D surface of palaeoglaciers. Comput. Geosci. 94, 77–85.
Peña-Monné, J.L., Pellicer, F., Chueca, J., Julián, A., 1997.Leyendas para mapas geomorfológicos a escalas 1:100.000/1:200.000 y 1:25.000/1:50.000. In: Peña-Monné, J.L. (Ed.), Cartografía geomorfológica básica y aplicada. Geoforma Ediciones, Logroño, pp. 127–143.
Pereira, P., Oliva, M., Misiune, I., 2016.Spatial distribution of some precipitation indexes in Sierra Nevada, Spain. Theor. Appl. Climatol. 126 (3), 683–698.
Pérez-Alberti, A., Valcárcel, M., 1998.Caracterización y distribución especial del glaciarismo en el Noroeste de la Península Ibérica. In: Gómez Ortiz, A., Pérez
Alberti, A. (Eds.), Las huellas glaciares en las montañas españolas. Universidad de Santiago de Compostela, Santiago de Compostela, Spain.
Pérez-Alberti, A., Valcárcel, M., Blanco Chao, R., 2004.Pleistocene glaciation in Spain. De-velopments in Quaternary Sciences. Quaternary Glaciations Extent and Chronology—Part I: Europe. 2 (1), pp. 389–394.
Pérez-Alberti, A., Valcárcel-Díaz, M., Martini, I.P., Pascucci, V., Andrucci, S., 2011.Upper Pleistocene glacial valley-junction sediments at Pias, Trevinca Mountains, NW Spain. In: Martini, I.P., French, H.M., Pérez-Alberti, A. (Eds.), Ice-marginal and Periglacial Processes and Sediments 354. Geological Society (London) Special Publica-tion, pp. 93–110.
Quelle, O., 1908.Beiträge zur Kenntnis der spanischen Sierra Nevada. Ph.D. Thesis. Univer-sity of Friedrich-Wilhelm, Berlin, Germany.
Redondo-Vega, J.M., Gómez-Villar, A., González-Gutiérrez, R.B., 2005. Rasgos morfométricos y morfodinámicos de los glaciares rocosos relictos de la Sierra de Gistredo (Montaña Cantábrica, León). Homenaje a Joaquín González Vecín. Depart-ment of Geography and Geology, University of León, pp. 373–382.
Ruiz-Fernández, J., 2011.Geomorphological map of an Atlantic mid-height mountain area: the Juan Robre and Jana Ridge (Cantabrian Range, Northwest Spain). J. Maps 7 (1), 260–272.
Ruiz-Fernández, J., Poblete-Piedrabuena, M.A., Serrano-Muela, M.P., Martí-Bono, C., García-Ruiz, J.M., 2009.Morphometry of glacial cirques in the Cantabrian Range (northwest Spain). Z. Geomorphol. 53, 47–68.
Ruiz-Fernández, J., Oliva, M., Cruces, A., Lopes, V., Freitas, C., García-Hernández, C., Geraldes, M., López-Sáez, J.A., 2016.Environmental evolution in the Picos de Europa (Cantabrian Mountains, SW Europe) since the Last Glaciation. Quat. Sci. Rev. 138, 87–104.
Santos-González, J., Redondo-Vega, J.M., González-Gutiérrez, R.B., Gómez-Villar, A., 2013. Applying the AABR method to reconstruct equilibrium-line altitudes from the last glacial maximum in the Cantabrian Mountains (SW Europe). Palaeogeogr. Palaeoclimatol. Palaeoecol. 387:185–199.http://dx.doi.org/10.1016/j.palaeo.2013.07. 025.
Sanz de Galdeano, C., López-Garrido, A.C., 1999.Nature and impact of the Neotectonic de-formation in the western Sierra Nevada, Spain. Geomorphology 30, 259–272.
Schimper, W.P., 1849.Sur la géologie, la botanique et la zoologie du midi de l'Espagne. L'Institut. Journal Universel des Sciences 806, pp. 189–192.
Schoeneich, P., 1993.Cartographie géomorphologique, cartographie des risques, chap. Comparaison des systémes de légendes français, allemand et suisse principe de la légende IGUL. Travaux et Recherches 9. Institut de Géographie, Université de Lau-sanne, pp. 15–24.
Serrano, E., Agudo, C., Martínez de Pisón, E., 1999.Rock glaciers in the Pyrenees. Permafr. Periglac. Process. 10 (1), 101–106.
Serrano, E., González-Trueba, J.J., González-García, M., 2012.Mountain glaciation and paleoclimate reconstruction in the Picos de Europa (Iberian Peninsula, SW Europe). Quat. Res. 78, 303–314.
Serrano, E., González-Trueba, J.J., Pellitero, R., González-García, M., Gómez, M., 2013. Qua-ternary glacial evolution in the Cantabrian Mountains (Northern Spain). Geomor-phology 196, 65–82.
Serrano, E., Gómez-Lende, M., González-Amuchastegui, M.J., González-García, M., González-Trueba, J.J., Pellitero, R., Rico, I., 2015.Glacial chronology, environmental changes and implications for human occupation during the upper Pleistocene in the eastern Cantabrian Mountains. Quat. Int. 364, 22–34.
Serrat, D., Gómez-Ortiz, A., Vilaplana, J.M., 1994.Geomorfología glacial del Pirineu Orien-tal. In: Martí-Bono, C., García-Ruiz, J.M. (Eds.), El glaciarismo surpirenaico: nuevas aportaciones. Geoforma Ediciones, Logroño (geomorphological map in annex).
Trenhaile, A.S., 1975.Cirque elevation in the Canadian Cordillera. Ann. Assoc. Am. Geogr. 65-4, 517–529.
Verstappen, H.Th., Van Zuidam, R.A., Meijerink, A.M., 1991.The ITC system of geomor-phologic survey: a basis for the evaluation of natural resources and hazards. Interna-tional Institute for Aerial Survey and Earth Sciences (ITC), Enschede (Holland) (89 pp.).
Vieira, G., 2008.Combined numerical and geomorphological reconstruction of the Serra da Estrela plateau icefield, Portugal. Geomorphology 97 (1–2), 190–207.
Washburn, A.L., 1979.Geocryology. A Survey of Periglacial Processes and Environments. Edward Arnold, London.
1267 P. Palma et al. / Science of the Total Environment 584–585 (2017) 1256–1267