The Pricing of Loans to LBOs in
the U.S. versus Europe
Trabalho Final na modalidade de Dissertação apresentado à Universidade Católica Portuguesa
para obtenção do grau de mestre em Finanças.
por
Daniela Fernandes Machado
sob orientação de
Prof. Doutor João Filipe Monteiro Pinto Prof. Doutor Paulo Alexandre Pimenta Alves
Católica Porto Business School, Universidade Católica Portuguesa Julho 2017
Acknowledgments
Firstly, I would like to express my sincere gratitude to my advisors Prof. Dr. João Pinto and Prof. Dr. Paulo Alves for the support on the conclusion of the present thesis.
I would also like to thank my colleagues Cátia and Vitor for all the support throughout the master course.
To my dearest friends, Ana Luisa and Sofia thanks for all the patience and kindness, without your support, achieving this goal would have been much more difficult.
My biggest and sincere thanks for my parents for this incredible opportunity to accomplish a master degree, your support is indescribable. Special thanks to my sister for all the inspiration provided to accomplish this goal, as the great example that you are. To my boyfriend, thanks for keeping me laugh and optimistic during this stressful course.
My sense of gratitude to one and all who, directly and indirectly, have provided their support on this achievement, the conclusion of this thesis.
Abstract
This thesis investigates the determinant factors concerning pricing of loans in LBOs, using a sample of 13,315 syndicated loans closed from 2000 to 2013. The results seem to indicate that spreads and pricing processes differ significantly in market-based versus bank-based financial systems as well as in the U.S. versus W.E. In the pre-crisis period, LBO loans extended to market-based borrowers face higher spreads compared to bank-based countries. During the crisis-period, borrowers from common law legal systems face higher spreads for loans in LBOs. The regression results presented for LBO loans extended to U.S. versus W.E. borrowers demonstrate that those in the U.S. face higher spreads. These results are in line with Carey and Nini (2007). A robust convex relationship between spread and maturity is found for loans in LBOs. Lastly, acquired firms with higher cash flow potential (market-to-book ratio) and asset tangibility (fixed asset to total assets) experience a lower spread. Furthermore, firms’ characteristics, namely book leverage, do not affect the pricing of loans in LBOs, opposed to marketability and default factors.
Table of contents
Acknowledgments ... ii
Abstract ... iii
Table of contents ... iv
List of figures ... vi
List of tables ... vii
1. Introduction ... 1
2. Literature Review ... 5
2.1 What is a LBO? ... 5
2.2 The Financial System and Investor’s Protection ... 9
2.3 Differences in spreads between the U.S. and W.E ... 12
2.4 The Latest Financial Crisis ... 13
2.5 Different terms for divergent loans ... 14
2.6 Pricing Determinants ... 16
3. Hypothesis development ... 19
4. Data and Sample Selection ... 21
4.1 Data Description ... 21
4.2 Variables of the Model ... 24
4.2.1 Dependent Variable ... 24
4.2.2 Independent Variables ... 25
4.2.3 Microeconomic Independent Variables ... 25
4.2.4 Macroeconomic Independent Variables ... 27
4.3 Descriptive Statistics ... 29
4.4 Preliminary Analysis ... 36
5. Methodology ... 38
6. Results ... 40
6.1 Results of the regression analysis ... 40
6.1.1 Are loans in LBOs priced in integrated debt markets? ... 40
6.1.2 Determinants of spreads for the high-information sample. ... 44
6.1.3 The impact of the financial crisis on credit spreads. ... 47
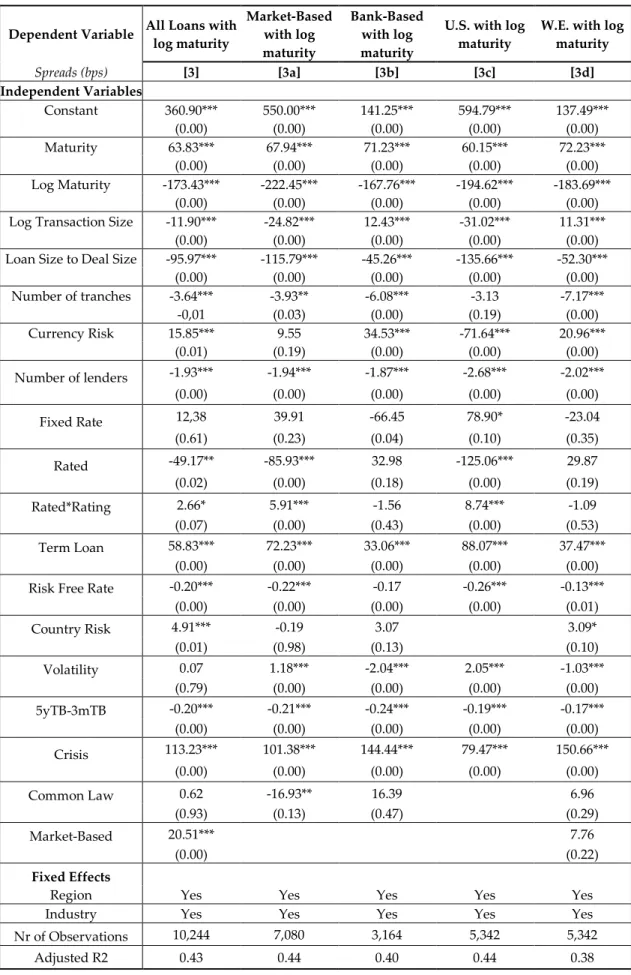
6.1.4 The term structure of spreads ... 51
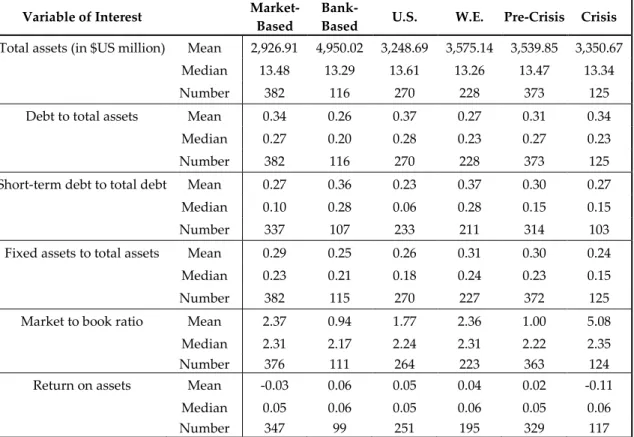
7. The impact of acquired firm’s characteristics on spreads and pricing processes ... 55
7.2 Multivariate Analysis ... 58
7.2.1 Term structure of spreads with firm’s characteristics ... 62
8. Summary and Conclusions ... 65
9. Bibliography ... 67
List of figures
Figure 1 – LBO Scheme ... 6
Figure 2 – Term structure loans extended to market-based borrowers... 52
Figure 3 – Term structure loans extended to W.E. borrowers ... 52
List of tables
Table 1: Distribution of the full sample of loans in LBOs by year, borrower's
nationality and industry ... 23
Table 2: Contractual characteristics of syndicated loans in LBOs ... 31
Table 3: Tests for similar distributions in contract characteristics across sub-samples ... 35
Table 4: Expected sign and findings ... 37
Table 5: Regression analysis of the determinant of credit spreads ... 42
Table 6: Regression analysis of the impact of the financial crisis ... 49
Table 6: Regression Analysis of the term structure of spreads ... 53
Table 8: Tests for similar distributions in contract characteristics across sub-sample ... 57
Table 9: Regression Analysis of the determinants of credit spreads: the impact of acquired firm’s characteristics ... 60
Table 10: Regression Analysis of the term structure of spreads with firms' characteristics ... 63
1. Introduction
A leveraged buyout (LBO) is an acquisition of a company by a specialized investment firm using a significant amount of borrowed funds (debt financing) and a small portion of equity1. The large investment in debt has advantages and
disadvantages that can affect the pricing of LBO loans.
This thesis investigates the determinant factors concerning pricing of loans in LBOs, using a sample of 2,671 deals which correspond to 13,315 syndicated loans closed during the 2000-2013 period. The study aims to discover the differences in loan pricing, namely between financial systems (market-based versus bank-based), the location of the borrower (U.S. versus W.E.), the legal systems implemented on the borrower country (common law versus civil law), the effect of the pre-crisis and crisis period and the term structure of loan spreads.
Several studies have investigated loan pricing, specifically for corporate loans and bonds. However, only two empirical papers have tried to investigate the determinants of syndicated loan spreads in LBOs. Ivashina and Kovner (2011) use a sample of 1,590 loans closed between 1993 and 2005 in the U.S. to study the impact of private equity firms’ bank relationships on the terms of their syndicated loans. Colla et al. (2012) study the determinants of both capital structure and debt pricing, using a sample of 1,006 tranches closed between 1997 and 2008. Since the empirical literature of the determinants that affect the pricing processes of an LBO loans is scant, this thesis aims to extend current knowledge by investigating if pricing models use similar determinants for project finance loans and syndicated loans. To extend the literature on debt pricing, this thesis
aims to answer the following question: Are loans in LBOs influenced by common
pricing determinants and to what extent are they similar to other syndicated loans?
The main goal of a financial system is to raise funds from investors and exchange them between investors and borrowers through regulated markets and intermediaries.2 The types of financial system, bank-based versus market-based,
play an important role because of the benefits and disadvantages of the financing decision and consequently, influence LBO loan spreads. Beck and Levine (2002) show that banks are more effective than the market in financing new projects. However, Chakraborty and Ray (2006) argue that the ability of a firm to raise external funds and grow is affected by the organization of financial activities. Allen and Gale (1999) show that the legal system plays an important role, controlling the restrictions used on securities and the type of contracts. La Porta
et al. (1998) find that legal protections of investors differ across countries
(common law versus civil-law). According to Gatti et al. (2013), loans for projects in countries with stronger creditor rights, lower political and economic risks have lower spreads. Ergungor (2008) shows that legal system is also correlated with economic growth. The evidence on the type of financial systems raises a second question: Are LBO loan spreads and pricing processes significantly different between
market-based and bank-based financial systems?
The LBO loan market is not globally integrated and the spreads on syndicated loans to LBOs are different across the United States (U.S.) and Western Europe (W.E.). Although the crisis had an impact on credit spreads across the U.S. and W.E., the biggest difference is due to the type of financial systems used to finance LBO transactions and the law legal system. Carey and Nini (2007) show evidence that syndicated loan credit spreads are significantly smaller in Europe than in the U.S. Additionally, according to Colla et al. (2012) between 1997 and 2009, a major part of buyout deals have occurred in the U.S. and the rest of them have been
placed in the U.K. This difference on spreads related to borrowers’ location raises another question: Are LBO loan spreads arranged to U.S. borrowers significantly
higher than those of LBO loan spreads arranged to W.E. borrowers?
The 2007/2008 financial crisis and the subsequent European sovereign debt crisis deteriorated the credit market conditions and investors lost confidence in structured finance credit ratings. Therefore, collaterized loan obligations (CLO) and leveraged buyout loans have dissipated, and interest rates on debt related to buyouts increased significantly3. According to Marques et al. (2015), credit
spreads for other types of syndicated loans - project finance loans - have significantly increased as a consequence of the financial crisis. This increase on spreads raises an additional question: After controlling for macroeconomic conditions
and loan characteristics, did the 2007/2008 financial crisis have a significant impact on LBO loan spreads?
Finally, the term structure of spreads for syndicated loans is yet to be fully understood since the results presented in previous studies do not reach the same conclusions. From syndicated loans to LBOs, Ivashina and Kovner (2011) and Colla et al. (2012) identify a positive relationship between spread and maturity. Concerning corporate loans, Kleimeier and Megginson (2000) and Caselli and Gatti (2005) conclude that project finance loan pricing is not a positive function of maturity. However, they discover a significantly negative relationship between spread and maturity. This negative relationship is explained by the fact that structured financing loans are characterized by longer maturities and make use of a special purpose vehicle (SPV). Nevertheless, Sorge and Gadanecz (2008) and Marques et al. (2015) show a robust-convex relationship on the term structure of spreads. These divergent results lead us to the final question: After
controlling for microeconomic and macroeconomic pricing factors, is the term structure of spreads in LBO loans different from that of corporate financing loans?
The results presented by this thesis show that loans in LBOs closed in market-based and bank-market-based financial systems are influenced differently by common pricing factors. Moreover, even loans extended to U.S. and W.E. borrowers have different pricing processes. During the pre-crisis period, loans in LBOs extended to borrowers in market-based financial systems face higher spreads (13.27 bps) than those in bank-based financial systems. During the crisis period, only loans extended to borrowers in common law legal systems face higher spreads (41.12 bps). Loans extended to U.S. borrowers are associated with 45.79 bps higher spreads than loans arranged to W.E. borrowers.
This thesis contributes to the literature on pricing processes of LBO loans. The investigation focuses on pricing processes of loans to LBO and if they differ on the borrower location, market-based financial system versus bank-based financial system. The study also contributes to corporate finance and financial intermediation literature, since spreads on LBOs are different across the U.S. and W.E. Furthermore, the study contributes to the analysis of the impact by the 2007/2008 crisis and the subsequent European sovereign debt crisis on the spread and pricing processes. Since the term structure of spreads remains a puzzle, we contribute with a model of the term structure of spreads for LBOs loans, controlling for different financial systems and time periods. Lastly, the influence by target firm characteristics on LBO loan spreads is also analyzed.
The thesis is organized as follows. Section 2 includes a review on the literature of LBO loans. Section 3 presents the research questions. Section 4 describes the data and sample selection, along with the descriptive and preliminary analysis to the financial characteristics on syndicated loans in LBOs. Section 5 describes the methodology and the model used to answer the research questions. In section 6 the results are presented and analyzed. Section 7 provides an analysis to the impact of acquired firms’ characteristics on spreads and pricing processes. Section 8 presents the principal conclusions of this study.
2. Literature Review
2.1 What is a LBO?
Structured finance plays an important role in the financial business, offering complex financing needs for companies [Fabozzi et al. (2006)]. These complex financing structures allow the financing of assets and business when conventional financing products are unavailable. According to Caselli and Gatti (2005), asset securitization, project finance, structured lease and acquisition finance activities, supported by a strong debt component, are the formats of structured finance. Concerning the leveraged acquisition, the most important financial instrument used is the leveraged buyout (LBO).
According to previous studies [Kaplan et al. (2009)], a LBO is an acquisition of a company by a specialized investment firm using a significant amount of borrowed funds (outside debt financing) and a small portion of equity.
In a traditional LBO, contrary to what happens in a traditional firm, debt comprises 60% to 70% of the financing structure; i.e., they use highly levered capital structures [Rosenbaum et al. (2009)]. During the debt structuring of a LBO transaction, there are two main financing characteristics. First, the high level of debt of the special purpose vehicle firm which is settled only for the transaction. Second, debt financing is obtained in multiple debt tranches that differ in terms of lender type: banks, institutional investors and arm’s length financing [Colla et
al. (2012)]. These financing sources are called the financial intermediaries and can
create value for the LBO firm. For example, repeated relationships between the leveraged firm and the bank leads to the achievement of a large amount of leverage with better terms.
In a typical leveraged buyout structure, the acquirer firm (LBO firm) remains with a higher debt ratio compared with the level of equity/debt before the acquisition. The choice of the target firm is related with the increase of the potential value for the acquirer firm, in restructuring or breaking up the target. Figure 1 demonstrates a LBO financial restructuring and the respective stages:
Figure 1 – LBO Scheme
Source: Caselli, S., and S. Gatti, 2005. Structured Finance: Techniques, Products and Market, Springer Berlin
(1) The new company or special purpose vehicle is used for the transfer of ownership since it is the new company which will make the acquisition of the target firm. (2) The new company receives a large amount of capital (debt infusion) raised through lenders (pool of banks and financial intermediaries).
This debt infusion is relocated to the acquirer firm and is transformed into a cash flow source to repay the assumed liabilities. (3) The new company acquires the target’s shares and the shareholders of the target firm are payed. (4) The acquirer firm makes an equity investment in the new company jointly with the financial investors [Caselli and Gatti (2005)]. According to Nikoskelainen et al. (2007), LBO corporate governance mechanisms, such as debt, ownership of equity and the active presence of investor, increase the firm value, reduce the agency costs and improve the efficiency of the operating performance of the firm.
With the substitution of equity by debt in the LBOs, studies show large gains in operating performance, such as the creation of value with the improvement in cash flows and interest tax shield benefits. Additionally, reduced agency costs and operational improvements of firms are identified due to the discipline effect of debt and better aligned management incentives [Liu (2014) and Guo et al. (2011)]. The improvement in cash flows is the result of the reduction of available cash flow and consequently lesser agency costs of free cash flow. Tax benefits are the outcome of the interest payments since interest is tax deductible to the corporation, therefore leverage can provide a valuable tax shield [Jensen (1986) and Axelson et al. (2007)]. The mitigation of the agency conflicts is related to the lender’s monitoring of manager’s behavior [Liu (2014)] and with the reduced costs of processing and acquiring information about firms and their managers through financial intermediaries [Chakraborty et al. (2006)]. Regarding the incentives of the management, as Jensen (1986) reveals, issuing large amounts of debt is an effective motivating force for managers to reach a more efficient corporation since the risk caused by failure of debt service payments is higher.
Although LBOs provide greater advantages for the target firm there are also some disadvantages. Cumming and Zambelli (2010) allege that LBO is associated with a negative impact on the target firm and the possibility of conflicts of interest within managers. Additionally, LBOs turn the acquired company weaker and
eradicate jobs. Ivashina and Kovner (2011)argue that the benefit of private equity investors also affect the employees with the deterioration of jobs and wage cuts. Kaplan and Strömberg (2009) show evidence that private equity investors profit from circumstances in market timings, tax benefits and superior information. Additionally, Damodaran (2008) demonstrates that the use of debt has three disadvantages: (i) a possibility of bankruptcy costs; (ii) agency costs; and (iii) loss of future financing possibilities. Concerning the bankruptcy costs, with the increase of debt level the probability of failure in debt payments increases in the same proportion. Furthermore, these bankruptcy costs have legal fees and court costs which can affect the value of the assets of a bankrupt firm and may cause financial stress. The agency costs result from the creation of covenants and monitoring costs from the different and competing interests of equity investors and lenders in the firm. Regarding the loss of future financing flexibilities, with the increase of debt level the firm can be incapable to make future investments because of the debt payments of loans.
According to Ivashina and Kovner (2011), a stronger bank relationship with a lead bank and LBO firms is related with lower loan spreads. In a loan contract, there is an essential element named loan covenant. Colla et al. (2012) show that the inclusion of covenants significantly decreases spreads at the loan tranche level. Loan covenants have an implication on the reduced asymmetric information since bank loan covenants can prevent bankruptcy due to financial flexibility. These covenants can be reduced with repeated bank lending relationships once that better-informed banks can worry less about the potential conflicts of interest in a LBO [Ivashina et al. (2011)]. Demiroglu et al. (2010) show that tighter covenants serve to limit moral hazard problems but also makes it possible for banks to impose contingent control rights to reduce risk shifting.
The financing debt used in a LBO is gathered through the issue of different types of loans, securities and other instruments [Rosenbaum et al. (2009)]. LBOs
are usually included in the high leveraged transactions due to the high leverage borrowed and the debt components of the capital structure. These components are usually deemed non-investment grade or rated as “Ba14” and “BB+5”
[Angbazo et al. (1998) and Rosenbaum et al. (2009)]. The rating evaluates the capacity of the borrower to repay interest on time, as promised.In the U.S., a major percentage of the LBO transactions were financed with syndicated loans [Ivashina et al. (2011)].
According to Maskara (2010), syndicated loans have a relationship-based bank financing, as well as characteristics such as bond financing. The syndicated loan is “tranched” into heterogeneous components, distributed across lenders with different risk aversion (e.g., liquidity characteristics or different seniority) and sometimes sold at different prices in the capital market. The multiple tranches have a lower credit spread and the same credit risk as a stand-alone loan tranche with similar loan characteristics.
Colla et al. (2012) find that tranche spreads can be explained by the same factors as corporate bond yields, which means spreads increase with equity volatility and with the cost of debt.
2.2 The Financial System and Investor’s Protection
According to several authors6, the main goal of a financial system is to
approach and assemble funds from investors and exchange these funds between investors and borrowers through regulated markets and intermediaries. The types of financial system, bank-based versus market-based, play an important role due to the benefits and disadvantages of each financing decision, and thus
4 Moody’s Investor Service 5 Standard and Poor’s
may impact significantly the leverage level of a LBO and, consequently, the cost of debt.
Chakraborty and Ray (2006) show that in corporate finance the ability of a firm to raise external funds and to grow through corporate governance is affected by the organization of financial activities. Boot and Thakor (1997) describe the roles of banks and financial markets and assume that “agents within a bank can cooperate and coordinate their actions, whereas agents in a market compete”. In a market-based financial system, the transaction or a deal is made without a relationship between the lender and the borrower and each part is not monitored nor pressured. On the other hand, banks are more involved in the project selection, identifying promising entrepreneurs and monitoring firms [Chakraborty et al. (2006)].
Beck and Levine (2002) show that banks are more effective than the market in financing new projects that require high leverage since banks can bind to additional funding, if necessary, during the development of the project. Additionally, market-based reveal more information in public markets about the firm which can affect public stock prices during the acquisition of the LBO.
In financial systems, there is an extremely important component, the legal system. Allen and Gale (1999) show that the law plays an important role given that it controls the restrictions used on securities, the type of contracts and which governance mechanism is more suitable for the firm. Legal rules protect investors against expropriation and also protect shareholders. La Porta et al. (1997) argue that countries with better legal protections can enable higher external finance with better terms, valued at higher amounts, and broader capital markets. Furthermore, smaller debt and equity markets are related with countries which have lower investor protections.
La Porta et al. (1998) further on research legal protections of investors across 49 countries. Laws globally differ across the countries, which means countries
with common law tradition (English law) protect investors more than the countries with civil law (derives from Roman law). Common law countries give stronger protections for shareholders and creditors. On the other hand, investors in civil law countries have the weakest legal rights.
Colla et al. (2012) suggest that bond markets play an important role in the capital structure of LBOs and consequently the type of the financial system. These suggestions are related with the discovery that the deals in common law countries are concentrated in higher junior leverage and lower senior leverage.
Foley and Greenwood (2010) experiment at a country level the relationship between ownership concentration and investor protection. Their results indicate that countries with weaker investor protection have a higher ownership concentration. As a consequence, firms use more external finance (debt) and grow less because of the concentrated ownership: blockholders do not issue equity.
According to Gatti et al. (2013), loans for projects in countries with stronger creditor rights, lower political and economic risks have lower spreads. Esty and Megginson (2003) claim that lenders create smaller and concentrated syndicates to enable monitoring and low cost contracting, when the country has strong creditor rights and legal enforcement.
The legal system is also correlated with economic growth. Ergungor (2008) shows that flexible judicial environments are correlated with well-developed countries and economic growth since market-based has an established and developed stock market. Consequently, entrepreneurs will invest more instead of paying rents to investors.
2.3 Differences in spreads between the U.S. and W.E
Several authors7 have showed that the LBO loan market is still a recent market
which has suffered a few changes since the recent economic crisis. Therefore, the market is not globally integrated and the spreads on syndicated loans to LBOs are different across the United States (U.S.) and Western Europe (W.E.). Considering W.E., the U.K. is the most developed buyout market.
Although the crisis had an impact on credit spreads across the U.S. and W.E., the biggest difference is due to the type of financial systems used to finance LBO transactions.
Carey and Nini (2007) show evidence that syndicated loan credit spreads are significantly smaller in Europe than in the U.S. The location of the borrower’s and lender’s activity has some impact in debt pricing. Transactions in syndicated loans are normally centered in London, New York and Hong Kong, which lead to several home bias. Carey and Nini (2007) find a relationship between borrower and lender domicile and the market location concerning the pricing differences.
According to Ergungor et al. (2004), countries with common law are market-based and countries with civil law are bank-market-based financial systems. Common law countries are more effective than civil law countries since they have more flexibility in interpreting and creating new rules. Consequently, banks emerge in countries with civil law as a solution to enforce contracts. In addition, common law countries have more creditor and shareholder protection laws which enables the development of financial markets.
Considering the type of the financial system, the United Kingdom (U.K.) is a common law country like the U.S., both having a market-based financial system.
On the other hand, most of the countries is Western Europe are civil law countries and have bank-based financial system.
Wright et al. (2006) show that the U.K. had an exponential growth due to the investment of U.S. private equity firms in European buyout markets. A major part of the firms in the U.K. and Europe are family-owned with aging firms which can toughen the entry of hedge funds for buyout deals. Furthermore, U.K. managers are inclined to be more risk lovers than in W.E. for buyout deals and the infrastructure for doing buyouts differs across countries in Europe. For example, the U.K. has more developed private equity and debt markets and more favorable legal and tax backgrounds. Relatively to the size of the LBOs, higher buyouts have a greater performance and increased investor returns due to the bankruptcy risk [Nikoskelainen et al. (2007)]. Smaller LBOs have a higher risk of bankruptcy which is also related with the difficulty of hedge funds in Europe.
According to Colla et al. (2012), between 1997 and 2009, a major part of buyout deals occurred in the U.S. and the rest of them have been placed in the U.K. Moreover, deals in common law countries rely on higher junior and lower senior leverage with a significant difference in spreads. Spreads in common law countries are 32 to 58 bps higher than in civil law countries.
2.4 The Latest Financial Crisis
According to Shivdasani and Wang (2011), a leveraged buyout boom occured between 2004 and 2007, which also coincided with an exponential growth in collateralized debt obligations (CDOs) and other forms of securitization. This growth is related with important developments in capital market conditions, investor landscape and structured credit markets [Rosenbaum et al. (2009)]. During this LBO boom, banks used to finance LBO loans with collateralized loan
obligations (CLO) which are CDOs backed by loans. CLOs have financed globally private equity firms in leveraged buyouts [Benmelech and Dlugosz (2009)].
During this period, some of the LBO transactions were driven by the accessibility of debt financing, which implied low returns since managers were not motivated by the potential of operating and governance developments [Kaplan and Strömberg (2009)].
Banks used to finance LBO loans with CDOs due to easier credit terms and lower costs for its borrowers with cheaper credit and looser covenant protections [Shivdasani et al. (2011)]. However, the 2007-2008 financial crisis has deteriorated the credit market conditions and investors lost confidence in structured finance credit ratings. Consequently, CLOs and LBOs dissipated, and interest rates on debt related to buyouts increased significantly [Kaplan et al. (2009) and Benmelech et al. (2009)]. According to Marques et al. (2015), credit spreads for other type of syndicated loans - project finance loans - significantly increase as consequence of the financial crisis.
2.5 Different terms for divergent loans
During the past years, project finance (PF) has been associated with successful financial and operating transactions loans but with differences compared with other loans. PF is a structured finance defined by the creation of a legally independent vehicle company, a special purpose vehicle (SPV), to achieve its financing objectives [Gatti et al. (2013)]. According to Caselli and Gatti (2005), SPVs are a project company made for a particular purpose which is financially and legally independent from the sponsors. Since PF loans create a SPVs,
similarly to LBO loans, and are related with high leverage, the determinants that affect PF loans can be used to explain the pricing processes for LBO loans.
According to Kleimeier and Megginson (2000), PF loans differ from other loans (non-project finance) in that they have longer maturities, more participating banks, and lesser loan covenants. Ivashina and Kovner (2011) defend that a stronger bank relationship between the LBO firms and the lead bank is related with lower loan spreads. Kleimeier and Megginson (2000) determine that PF loans have lower credit spreads compared to non-PF loans due to reduced agency costs. Colla et al. (2012) examine spreads at the tranche level for LBOs and find that extended maturities tranches are associated with higher spreads. On the other hand, Kleimeier and Megginson (2000) and Gatti et al. (2013) conclude that the connection between spread and maturity have a significantly negative relationship for project finance loans. Several authors do not agree with this negative relationship between maturity and spreads. As reported by Sorge and Gadanecz (2008), the term structure of credit spreads for project finance is humped-shaped, which is due to essential characteristics of PF structures, such as high leverage and short-term liquidity as a consequence of the risk of longer maturity. Since loan repayment relies mostly on the cash-flow of the acquired firm, the short-term liquidity represents a risk. Consequently, the spreads are higher in shorter-term maturities. However, in longer maturities the cash-flow of the acquired firm is higher and the liquidity risk is smaller. Thus, the loan spreads are lower. Marques et al. (2015) also conclude that PF loans have a robust hump-shaped relationship between credit spread and maturity.
2.6 Pricing Determinants
In this section, the literature on the pricing of loans is reviewed.
Barclay and Smith (1995) provide evidence that regulated firms issue more long-term debt since regulation controls the underinvestment problem. A strong connotation between firm size and debt maturity is also identified since big firms issue more long-term debt than small firms. Additionally, a reliable positive relationship between a firm financial (S&P) bond rating and debt maturity is found.
Sorge and Gadanecz (2008) find an important determinant of the pricing of loans, the interest rates. Loan spreads are measured over base rates of different maturities and inflations expectations, which can have a significant impact on the pricing rate of debt. Campbell and Taksler (2003) consider the equity volatility as an important determinant of corporate bond yield spreads and also find that yield spreads and credit rating can be explained by volatility, especially for firms with a high ratio of long-term debt.
Colla et al. (2012) investigation focuses on a sample of 238 LBOs closed between 1997 and 2008, of which 1,006 individual debt tranches are included. Spreads are tested at tranche level and proved that they increase with maturity. In addition, macroeconomic factors can be used to explain tranche spreads since spreads increase with equity volatility and credit spreads. Furthermore, the investigation proves that market conditions positively affect the cost of LBO debt; longer maturity tranches have higher spreads; loan covenants decrease significantly spreads and the size of the loan is not significant.
Ivashina and Kovner (2011) use a sample of 1,590 LBO loans with detailed loan information for each sponsor/borrower between 1993 and 2005. The fact that bank relationships are a competitive advantage is found. Stronger bank relationships are associated with a lower cost of lending (covenants) and better
loan terms since the asymmetric information problem is reduced. LBO firms improve value since banks lower the spreads when there are potential cross-selling prospects.
Demiroglu and James (2010) investigate the role of private equity group reputation in LBO financing using a sample of 180 public-to-private LBOs in the US between 1997 and 2007. Private equity group invest more in LBO markets when lending requirements in the credit markets are sloppy and credit risk spreads are minor. Additionally, reputable private equity group (1) pay limited institutional and bank loan spreads; (2) have longer maturities; and (3) depend more on institutional loans.
Previous researchers8 focus their investigation on term structure spreads for
project finance (PF) loans.
Sorge and Gadanecz (2008) analyze the pricing of the cross section of loans and bonds, focusing on the relationship of spread-maturity. This relationship in PF is “humped-shaped” due to the short-term liquidity. Marques et al. (2015) also prove that PF term structure of spreads is “humped-shaped” as opposed to investment-grade and speculative-grade bonds, which are linearly positive.
Kleimeier and Megginson (2000) compare a sample of 4,956 PF loans with samples of non-PF loans closed in international capital markets between 1980 and 1999. Their evidence proves that PF loans have longer maturity, more detailed loan covenants, transparent cash-flows in riskier countries (more than average), and lower loan size than non-PF loans. In addition, Corielli et al. (2010) evidence that in PF, lenders rely on the network of nonfinancial contracts to control agency costs and improve risk management.
Gatti et al. (2013) use a sample of 4,122 PF loans between 1991 and 2005 and prove that prestigious arranging banks allow larger leveraged loans and create economic value by reducing loan spreads. Esty and Megginson (2003) use a
sample of 495 loan tranches in 61 different countries completed between 1986 and 2000. A high concentration between syndicate structure and legal risk is identified.
Marques et al. (2015) investigate which factors determine the pricing of PF loans and corporate bonds using a sample of a cross-section of 24,435 Western European loans and bond issues. This sample incorporates the issues closed during the 2000-2011 period. PF loans have a robust hump-shaped relationship between credit spread and maturity.
3. Hypothesis development
In this section, the hypothesis related to the research question are presented and explained.
The literature review shows that various studies demonstrate that numerous determinants affect LBO loan spreads. The main motivation of the investigation on the determinants is related to the fact that the available literature is scant and to investigate if the determinants that affect other loan spreads are the same for loans to LBO. This thesis aims to cover the literature on debt financing and price on syndicated loans.
Hypothesis 1: Loans in LBOs are influenced by common pricing determinants similarly as other syndicated loans.
The second hypothesis intends to examine the impact of the financial system on LBO loan spreads. The market-based financial system is associated with common law countries and the bank-based financial system with civil law countries. A country with a market-based financial system to finance a LBO transaction is a country with better law enforcement and with better protections to investors. The second hypothesis aims to investigate the impact of the financial system on spreads and pricing processes of loans to LBOs.
Hypothesis 2: LBO loan spreads and pricing processes differ significantly between market-based and bank-based financial systems.
Carey and Nini (2007) show that spreads on syndicated loans in LBOs are higher in the U.S. than in Europe. The third hypothesis has the purpose of testing if there is a significant difference in terms of spreads and pricing processes between the U.S. and W.E.
Hypothesis 3: LBO loans spreads arranged to U.S. borrowers are significantly higher than those of LBO loan spreads arranged to W.E. borrowers.
The fourth hypothesis has the purpose of testing if the 2007/2008 financial crisis and the subsequent European sovereign debt crisis had a significant impact on credit spreads and pricing processes of loans to LBOs.
Hypothesis 4: After controlling for macroeconomic conditions and loan characteristics, the 2007/2008 financial crisis did have a significant impact on LBO loan spreads.
The fifth hypothesis aims to test the term structure of spreads in LBO loans, since Sorge and Gadanecz (2008) and Marques et al. (2015) find non-linear relationships between spread and maturity for syndicated loans extended to PF, a type of structured finance transaction like LBOs.
Hypothesis 5: After controlling for microeconomic and macroeconomic pricing factors, the term structure of spreads in LBO loans differs from that of corporate financing loans.
4. Data and Sample Selection
In this chapter, we explain how our database was assembled; the definition of the variables used and their respective expected signal; and to present a descriptive statistics and preliminary analysis of the sample used.
4.1 Data Description
The sample used to determine whether loans in LBOs are more or less expensive for borrowers located in market-based versus bank-based financial systems, in U.S. versus W.E., examine to what extent loans in LBOs are priced by common characteristics with other syndicated loans. Loans data were extracted from Dealscan and the sample consists of individual loans between 2000 until 2013. Macroeconomic variables and firm characteristics were obtained from Datastream.
Dealscan includes information on the microeconomics characteristics of the loan, bond offers and borrower. Relatively to the bond offers data available includes transaction and tranche size, maturity, currency, pricing rating, and type of interest rate. Concerning the borrowers, Dealscan has data on name, nationality and industry sector information. Finally, Dealscan contains detailed historical information on all syndicated loans settled in international capital markets but only loans with a deal specific purpose code of “leveraged buy-out” were extracted.
Deals with no tranche amount or deal amount available and deal status not closed or completed were excluded from our sample. Our final sample consists in a single loan tranche, multiple issues from the same transaction or deal appear as separate observations.
From Datastream we collected macroeconomics variables such as level of interest rates, market volatility and slope of the yield curve were extracted.
Data from Datastream and Dealscan were matched, in order to use a unique dataset and investigate the impact of firm’s characteristics on credit spreads. However, Dealscan does not provide firms identification codes, it was necessary to hand-match firms in both databases by using the target name. The principal identifier in Dealscan is the firm’s name, ISIN and Ticker are only available for a small subset firms, which were used when available. The matching is complex and we were conservative and only matches with lower risk were kept, ignoring matches that are not unique.
Our final sample includes 13,315 LBO loans closed between 2000 and 2013 worth $1,856,630 million. This sample, is the “full sample” being the unit of observation a single loan tranche, multiple issues from the same transaction and deal appear as separate observations in the database only for deal amount and number of facilities, therefore we conduct separate analysis for these variables and control our regressions for this.
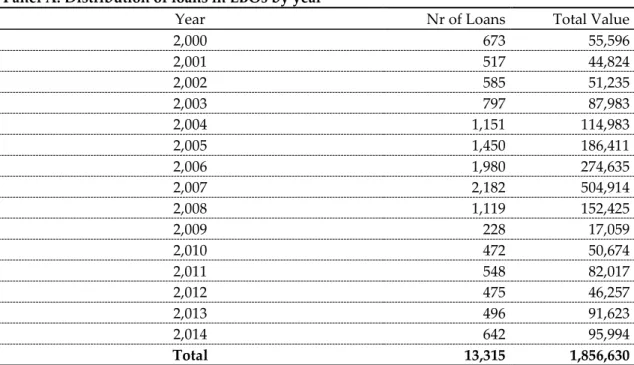
Table 1 presents the distribution of loans in LBOs across time, borrower’s nationality and industry. Panel A presents an increase of LBO loans between 2000 and 2007 worth in total $1,320,581 million. In 2007, LBO loans had the highest total value of $504,914 million. Since in 2007/2008 the financial crisis has affected conditions in capital market, LBO loans had a huge descent having a total value of $17,059 million in 2009.
Panel B reveals that LBO lending is concentrated in the U.S. and W.E. In the U.S the total number of loans were 5,821 worth in total $883,235 million and in W.E. including U.K. they have 6 362 loans with a total value of $799,183 million. The other regions only had 1,132 LBO loans worth in total $174,212 million. This values are in line with the idea that countries with developed capital markets and with low country risk has higher structured finance transactions such as LBOs.
Lastly, Panel C presents the distribution of loans in LBO by industrial category of borrower. The highest number of loans is concentrated in the commercial and industrial category, more specified in the manufacturing (5,401 loans), services (3,140 loans) and retail trade (1,067 loans).
Table 1: Distribution of the full sample of loans in LBOs by year, borrower's nationality and industry
Panel A: Distribution of loans in LBOs by year
Year Nr of Loans Total Value
2,000 673 55,596 2,001 517 44,824 2,002 585 51,235 2,003 797 87,983 2,004 1,151 114,983 2,005 1,450 186,411 2,006 1,980 274,635 2,007 2,182 504,914 2,008 1,119 152,425 2,009 228 17,059 2,010 472 50,674 2,011 548 82,017 2,012 475 46,257 2,013 496 91,623 2,014 642 95,994 Total 13,315 1,856,630
Panel B: Geographic distribution of loans in LBOs
Geographic Location of Borrower Nr of Loans Total Value
Europe 35 8,841 Western Europe 4,674 561,849 U.K. 1,688 237,334 U.S. 5,821 883,235 North America 222 39,261 Asia 397 59,996 Africa 26 4,570 Australia 385 42,772 Caribbean 5 10,720 Latin America 13 498 Others 49 7,554 Total 13,315 1,856,630
Panel C: Distribution of loans in LBOs by industrial category of borrower
Industrial Category of Borrower Nr of Loans Total Value
Commercial and Industrial
Agriculture, Forestry and Fishing 645 64,326
Mining 197 30,759 Construction 294 30,841 Manufacturing 5,401 683,954 Wholesale Trade 783 88,794 Retail Trade 1,067 171,531 Real Estate 205 50,860 Services 3,140 418,771 Utilities 765 192,162 Financial Services 345 71,508 Transportation 442 49,695 Public Administration/Government 31 3,429 Total 13,315 1,856,630
Note: Table 1 presents the distribution of the full sample of loans in LBOs across time (Panel A), borrower’s nationality (Panel B), and industry (Panel C). The first column details the number of loans, while the second column describes the total value in $US Million.
4.2 Variables of the Model
In this section, an analysis of the variables used in the model will be present. Initially, the explained variable will be explained and then the explanatory variables divided into macroeconomics independent variables and microeconomic independent variables.
4.2.1 Dependent Variable
Spread (Spread) represents the spread paid by the borrower over Libor plus the facility fee (all-in-spread-drawn). Maskara (2010) has also used the AISD for the dependent variable, because the all-in-spread-drawn (AISD)9 holds the
9 “All-in-spread-drawn (AISD) is calculated as the coupon spread plus the annual fee, expressed
interest rate of the loan paid by the borrower to the lender. Concerning syndicated loans, the all-in-spread-drawn (AISD) does not represent the full economic cost of credit (fees), such as commitment fees and up-front fees. As an alternative to the AISD, Berg et al. (2015) proposes the ‘total-cost-of-borrowing’ (TCB), which accounts for fees and spreads.
4.2.2 Independent Variables
The explanatory variables are divided into microeconomic independent variables and macroeconomic independent variables.
4.2.3 Microeconomic Independent Variables
Maturity represents the maturity of the loan in years. The term structure of syndicated loans appears as unknown, so the relationship between spread and maturity will help to understand how the maturity influences the spread and the slope of the curve between this relationship [Kleimeier and Megginson (2000); Colla et al. (2012); Gatti et al. (2013); Ivashina and Kovner (2011); Marques et al. (2015)].
Log transaction size is the natural log of the loan transaction size. Transaction size is converted into $US when necessary. Researchers such as Kleimeier e Megginson (2000), Sorge and Gadanecz (2008), Maskara (2010), Gatti et al. (2013) identify that the transaction size affect loans spread for syndicated loans.
for the deal as the weighted average of the spreads for each tranche, where the weight is the amount of the loan in that tranche relative to the total amount of that loan.” [Maskara (2010)].
Marques et al. (2015) used Log transaction size in the research and this one was significantly positively related to credit spread.
Loan size to deal size is the ratio of the tranche size to the transaction size of a given loan. Esty and Megginson (2003) have shown a positive relationship between syndicated size and loan pricing.
However, Kleimeier and Megginson (2000) and Sorge and Gadanecz (2008) conclude that loan size does not reduce loan spreads.
Number of tranches is the number of loans per deal. According to Maskara (2010) results, riskier borrowers benefit most from tranching syndicated loans having lower credit spreads than other identical non-tranched loans.
Currency risk is a dummy equal to 1 for loans that are denominated in a currency different from the currency in the borrower’s home country. According to Kleimeier and Megginson (2000), syndicated loan spreads are related to currency risk such as other variables. Nevertheless, the currency risk has a significantly negative impact on spreads.
Number of lenders is the number of lenders participating in the deal. According to Ivashina and Kovner (2011) LBO lenders (sponsors) have better loan terms to sellers in the form of higher transactions prices. Meaning financial sponsors preserve competition in loan pricing with repeated relationships with numerous banks.
Fixed rate is a dummy equal to 1 if a loan has a credit rating and 0 otherwise. In line with the Sorge and Gadanecz (2008) study, most bonds are fixed rate while loans are priced over a floating base rate. Using the fixed rate instead of floating
rate appears to have a significant discount in the pricing because of the insurance of the future interest rates of the floating rate.
Rated is a dummy equal to 1 if the loan has a credit rating and 0 otherwise. The Sorge and Gadanecz (2008) research concludes that bonds with ratings correspond to higher credit quality and associated with lower spreads. Gatti et
al. (2013) has included the credit rating in the variable country risk and has found
that spreads are lower in low-risk countries.
Rated*Rated is the interaction between rated dummy variable and rating. The rating evaluates the capacity of the borrower to repay interest and principal on time as promised. The rating classification used is based on 22 rating scales for S&P’s and Moody’s. Loan ratings are based on the S&P and Moody’s rating at the time of closing the loan, and converted as follows: AAA=Aaa=1; AA+=Aa1=2 and so on until D=22 [Sorge and Gadanecz (2008) and Gatti et al. (2013)].
Term loan is a dummy equal to 1 if the loan is a term loan and 0 if the loan is a credit line. According to Colla et al. (2012), term loans have higher spreads for all loans than credit lines. Furthermore, Berg et al. (2015) has discover that it is only possible to compute a total-cost-of-borrowing (TCB) measure for term loans.
4.2.4 Macroeconomic Independent Variables
Risk free rate is the yield on a 3-month U.S. Treasury bill as the time of signing the loan - a proxy for the general level of interest rates. In his research, Marques
et al. (2015) has used the risk-free rate and has found that it is negatively related
with project finance loan credit spreads, i.e., the higher the general level of interest rates the lower the spread.
Country Risk is the country credit rating at close of S&P’s. This variable measures from 1 for the countries with lowest risk (AAA=1) to 22 for the countries of highest risk (D=22). The rating is converted as follows: AAA=1; AA+=2 and so on until D=22. Other measures of country risk are available and were used in other studies but in this thesis, the S&P’s rating were used because as Corrielli et al. (2010) has pointed out, there is a strong correlation between the S&P’s measures and the alternative measures (monthly data compiled by the International Country Risk Guide (ICRG) or the country risk rank provided by Euromoney magazine).
Volatility represents The Chicago Board Options Exchange Volatility Index (VIX). VIX reflects a market estimate of future volatility. According to Colla et al. (2012), there is a positive and significant relationship between market volatility and spreads. Although according to Marques et al. (2015), for project finance credit spread and volatility have an insignificant relationship.
5yTB – 3mTB represents the yield curve slope. It was obtained as the difference between the U.S. five-year Treasury Bond rate and the U.S. 3-month Treasury Bill rate. According to the results presented by Marques et al. (2015), spread and the yield curve slope 5Ytb-3mTB are significantly negatively related for loans, meaning a steeper yield curve is associated with lower spreads.
Common law is a Dummy equal to 1 if the loan is extended to a borrower located in a country with a common law legal regime and 0 otherwise. According to Colla et al. (2012) results, loans settled in countries with a common law legal system are associated with higher spreads than civil law countries.
Market-Based is a Dummy equal to 1 if the loan is extended to a borrower located in a country with a market-based financial system and 0 otherwise.
Crisis is a Dummy equal to 1 if the closing date belongs to the crisis period and 0 otherwise. In line with the results of Marques et al. (2015), the 2007-2008 financial crisis and the subsequent European sovereign debt crisis has induced an increase in spreads for loans in project finance.
4.3 Descriptive Statistics
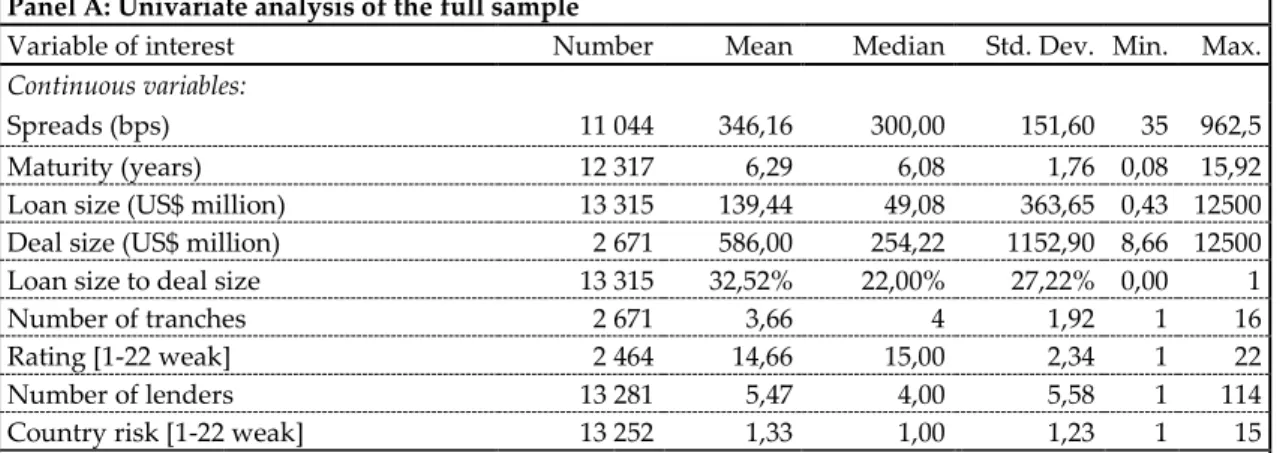
The descriptive statistics present in Table 2 allow an analysis regarding the performance of the variables of interest, considering the contractual characteristics of loans in LBOs. Table 2 present values of the summary statistics for the full and high-information of loans in LBOs.
From the univariate analysis of the full sample (Panel A), only issues that have complete data on credit spread were selected likewise values for the deal size and loan size variables (deal size and number of tranches). In addition, financial and non-financial firms vary across fundamental characteristics. Therefore, deals classified with the industrial category of “Financial Institutions” were excluded, having eliminated 345 deals.
In Panel B, the information sample consists of 10,753 loans. The high-information sample is used in the regression analysis. The mean (median) of spreads is 345.75 bps (300 bps) and the mean for maturity is 6.33 years. Each tranche (loan size) worth on average $138.69 million and each deal has on average 6.11 tranches (number of tranches). The mean of deal size is $643.22 million and each loan as on average 5.75 number of lenders. The loan size to deal size mean (median) is 31.80% (21.74%) and the average rating for LBO loans in
the high information sample is 14.67. The country risk mean (median) is 1.24 (1) which indicates that the spread of each loan has on average a credit rating of AAA=Aaa=1. LBO loans are very secure with a guarantee of 97.07%. The probability of an occurrence on currency risk in a LBO loan is low (9.09%) and the probability on having a fixed rate loan is also extremely low (2.44%). This low occurrence of having a fixed rate loan is explained by the fact that LBO loans are characterized by having floating interest rates. Finally, the probability of the loan is a term loan instead of a credit line is 65.21%.
Table 2: Contractual characteristics of syndicated loans in LBOs
Panel A: Univariate analysis of the full sample
Variable of interest Number Mean Median Std. Dev. Min. Max.
Continuous variables:
Spreads (bps) 11 044 346,16 300,00 151,60 35 962,5 Maturity (years) 12 317 6,29 6,08 1,76 0,08 15,92 Loan size (US$ million) 13 315 139,44 49,08 363,65 0,43 12500 Deal size (US$ million) 2 671 586,00 254,22 1152,90 8,66 12500 Loan size to deal size 13 315 32,52% 22,00% 27,22% 0,00 1
Number of tranches 2 671 3,66 4 1,92 1 16
Rating [1-22 weak] 2 464 14,66 15,00 2,34 1 22
Number of lenders 13 281 5,47 4,00 5,58 1 114
Country risk [1-22 weak] 13 252 1,33 1,00 1,23 1 15
Dummy Variables:
Nº of issues with data available Nº of issues with dummy=1 % of total available data
Secured 6 903 6 664 96,54%
Term loan 13 315 8 920 66,99%
Currency Risk 13 315 1 222 9,18%
Financial firms 13 315 345 2,59%
Fixed rate loan 11 286 451 4,00%
Panel B: Univariate analysis of the high-information sample
Variable of interest Number Mean Median Std. Dev. Min. Max.
Continuous variables:
Spreads (bps) 10,753 345.75 300 151.34 35 962.5 Maturity (years) 10,292 6.33 6.5 1.65 0.08 15.00 Loan size (US$ million) 10,753 138.69 50.00 324.87 0.63 8,537.8 Deal size (US$ million) 1,958 643.22 207.24 1 177.08 9.06 12,178.9 Loan size to deal size 10,753 31.80% 21.74% 26.26% 0.00 1
Number of tranches 1,958 6.11 3 1.89 1 16
Rating [1-22 weak] 2,182 14.67 15 2.32 1 22
Number of lenders 10,749 5.75 4 5.84 1 114
Country risk [1-22 weak] 10,709 1.24 1 0.99 1 15
Dummy Variables:
Nº of issues with data available Nº of issues with dummy=1 % of total available data
Secured 5 558 5 395 97,07%
Term loan 10 753 7 012 65,21%
Currency Risk 10 753 977 9,09%
Financial firms 10 753 0 0,00%
Fixed rate loan 10 753 262 2,44%
Note: Spread is the spread paid by the borrower over Libor plus the facility fee (all-in-spread-drawn). The loan ratings are based on S&P and Moody's ratings at closing; the rating is converted as follows: AAA=Aaa=1, AA+=Aa1=2, and so on until D=22. Country risk is the S&P's country credit rating at closing date. The rating is converted as follows: AAA=Aaa=1, AA+=Aa1=2, and so on until D=22.
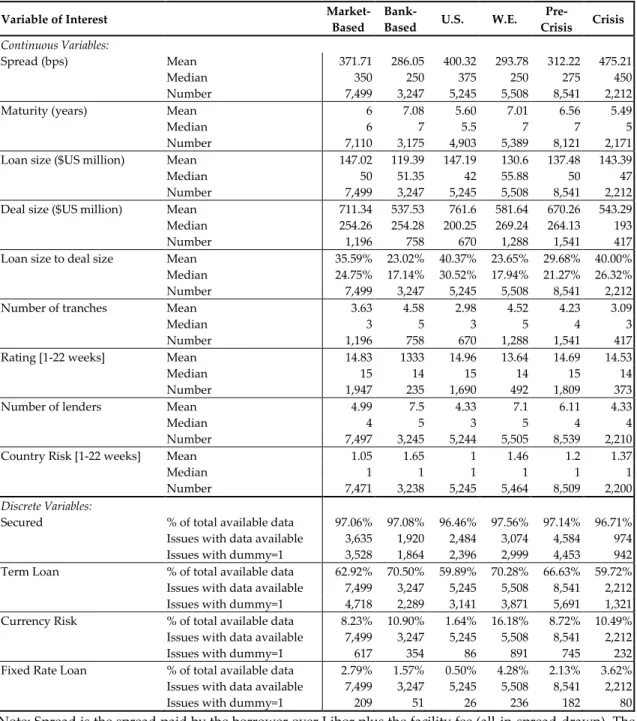
Table 3 provides an analysis and comparison of means and medians for continuous variables and levels for discrete variables of the contract characteristics between sub-samples. The descriptive statistics for sub-sample are grouped (1) whether the borrower is located in a country with a bank-based versus a market-based; (2) whether the borrower is located in U.S. versus W.E. and (3) whether the crisis has affected an increase in spreads.
Concerning the sub-sample (1) the mean of spreads diverges across borrowers located in market-based relatively to the bank-based financial systems. The spread mean (median) is higher for loans concentrated in market-based (371.71 bps) than the bank-based (286.05 bps). These results are in accordance with Foley and Greenwood (2010) since countries with weaker investor protection have a higher ownership concentration and therefore use more external finance (debt). For the sub-sample (2) the mean spread is also higher for the U.S. (400.32 bps) compared to W.E. (293.78 bps).
The maturity mean does not divergence significantly from market-based to bank-based having a mean of 6 years and 7 years respectively, and for the U.S. the maturity is 5.5 years and for W.E. it is 7 years.
Each loan (loan size) worth more on average in countries with market-based financial systems ($147.02 million) than in bank-based financial systems ($119.39 million). The same is true for W.E. having a higher mean of $55.88 million compared to the U.S. of $42 million.
The deal size mean is higher for countries with market-based ($711.34 million) compared to countries which are bank-based ($537.53 million). Similarly, the U.S. also has a higher mean of $761.60 million compared to W.E. of $581.64 million.
The loan size to deal size ratio mean is higher in countries with market-based (24.75%) compared with countries with bank-based (17.14%) financial systems. The same happens with the U.S. compared with W.E. The loan size to deal size is higher for the U.S. (30.25%) compared to W.E. (17.94%).
The number of the tranches mean is higher for countries with bank-based financial systems (4.58 tranches) and for W.E. (4.52 tranches) in comparison with countries with market-based financial systems (3.63 tranches) and for the U.S. (2.98 tranches). Therefore, LBO loans are more advantageous when they are tranching in W.E. countries with bank-based financial systems.
The average rating for loans extended for countries with market-based financial systems is 14.83 and for the U.S. is 14.96 which are higher compared to countries with bank-based financial systems which are 13.33 and 13.64. for W.E.
Concerning the country risk rating, it does not follow the same results as the average rating. For countries with market-based financial systems and for the U.S., the average rating is 1.05 and 1 respectively, being lower than the countries with market-based financial systems and for W.E., which are 1.65 and 1.46 respectively.
The number of lenders mean is inferior for countries with market-based financial systems (4.99) and for the U.S. (4.33) compared to countries with bank-based financial systems (7.5) and for W.E. (7.1). This difference is explained by the fact that the countries with bank-based systems and W.E. have a higher number of tranches and the principal financial sector is the bank.
Relatively to the discrete variables, all the loans are significantly secured but the U.S. (96.46%) is the country with lowest percentage of the loans compared with W.E. (97.56%), market-based financial systems (97.06%) and bank-based financial systems (97.08%).
The percentage of loans settled as term loans in the bank-based financial systems (70.50%) and W.E. (70.28%) are higher compared to the market-based financial systems (62.92%) and the U.S. (59.89%), which are more likely to be a credit line than a term loan.
The currency risk is much smaller in market-based financial systems (8.23%) and the U.S. (1.64%) than in bank-based financial systems (10.90%) and W.E. (16.18%).
The fixed rate loan percentage is lower for all the loans of the sub-sample (1) and (2) since the floating interest rate is used the most, being a distinguishing factor of loans in LBOs.
Regarding the sub-sample (3) whether the crisis has affected an increase in spreads, the average spreads for loans after the crisis (475.21 bps) is significantly higher than the pre-crisis (312.22 bps), concluding that the crisis has indeed affected an increase in spreads. For the rest of the variables this is also verified, except for the maturity, deal size, number of tranches, average rating and the term loan which suffered a decrease after the crisis. Maturity and deal size can be explained by the fact that banks have lost their capacity of lending after the crisis. The number of tranches diminishes after the crisis since loans became more controlled and expensive. The average rating can be explained by the fact, that after the crisis, the rating became more reliable and more controlled.
Table 3: Tests for similar distributions in contract characteristics across sub-samples
Variable of Interest Market-Based
Bank-Based U.S. W.E. Pre-Crisis Crisis Continuous Variables: Spread (bps) Mean 371.71 286.05 400.32 293.78 312.22 475.21 Median 350 250 375 250 275 450 Number 7,499 3,247 5,245 5,508 8,541 2,212 Maturity (years) Mean 6 7.08 5.60 7.01 6.56 5.49
Median 6 7 5.5 7 7 5
Number 7,110 3,175 4,903 5,389 8,121 2,171 Loan size ($US million) Mean 147.02 119.39 147.19 130.6 137.48 143.39 Median 50 51.35 42 55.88 50 47 Number 7,499 3,247 5,245 5,508 8,541 2,212 Deal size ($US million) Mean 711.34 537.53 761.6 581.64 670.26 543.29 Median 254.26 254.28 200.25 269.24 264.13 193 Number 1,196 758 670 1,288 1,541 417 Loan size to deal size Mean 35.59% 23.02% 40.37% 23.65% 29.68% 40.00% Median 24.75% 17.14% 30.52% 17.94% 21.27% 26.32% Number 7,499 3,247 5,245 5,508 8,541 2,212 Number of tranches Mean 3.63 4.58 2.98 4.52 4.23 3.09
Median 3 5 3 5 4 3
Number 1,196 758 670 1,288 1,541 417 Rating [1-22 weeks] Mean 14.83 1333 14.96 13.64 14.69 14.53
Median 15 14 15 14 15 14
Number 1,947 235 1,690 492 1,809 373 Number of lenders Mean 4.99 7.5 4.33 7.1 6.11 4.33
Median 4 5 3 5 4 4
Number 7,497 3,245 5,244 5,505 8,539 2,210 Country Risk [1-22 weeks] Mean 1.05 1.65 1 1.46 1.2 1.37
Median 1 1 1 1 1 1
Number 7,471 3,238 5,245 5,464 8,509 2,200
Discrete Variables:
Secured % of total available data 97.06% 97.08% 96.46% 97.56% 97.14% 96.71% Issues with data available 3,635 1,920 2,484 3,074 4,584 974 Issues with dummy=1 3,528 1,864 2,396 2,999 4,453 942 Term Loan % of total available data 62.92% 70.50% 59.89% 70.28% 66.63% 59.72% Issues with data available 7,499 3,247 5,245 5,508 8,541 2,212 Issues with dummy=1 4,718 2,289 3,141 3,871 5,691 1,321 Currency Risk % of total available data 8.23% 10.90% 1.64% 16.18% 8.72% 10.49% Issues with data available 7,499 3,247 5,245 5,508 8,541 2,212 Issues with dummy=1 617 354 86 891 745 232 Fixed Rate Loan % of total available data 2.79% 1.57% 0.50% 4.28% 2.13% 3.62% Issues with data available 7,499 3,247 5,245 5,508 8,541 2,212 Issues with dummy=1 209 51 26 236 182 80
Note: Spread is the spread paid by the borrower over Libor plus the facility fee (all-in-spread-drawn). The loan ratings are based on S&P and Moody's ratings at closing; the rating is converted as follows: AAA=Aaa=1, AA+=Aa1=2, and so on until D=22. Country risk is the S&P's country credit rating at closing date. The rating is converted as follows: AAA=Aaa=1, AA+=Aa1=2, and so on until D=22
4.4 Preliminary Analysis
Table 4 presents an overview of the expected sign of each variable of the high-information sample divided into sub-samples (Market-based versus Bank-Based financial systems and U.S. versus W.E.).
Concerning the microeconomic independent variables, only the Fixed rate had an insignificant impact on the spread. For the macroeconomic independent variables, the variables Volatility and Common Law also has little impact on the spread. Relatively to the Acquired firms' characteristics only the variable Fixed
assets to total assets had a significant impact on the spread.
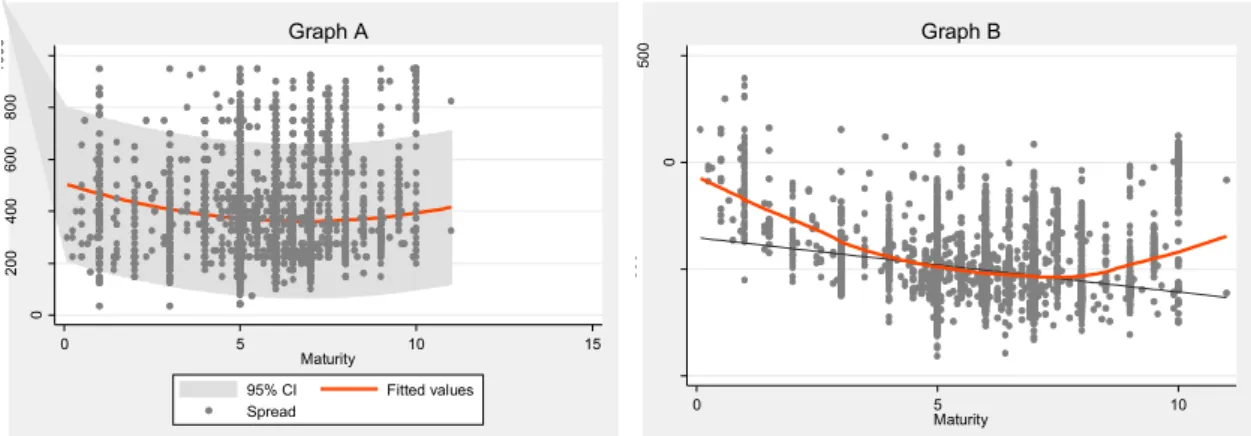
The variable Maturity has a convex relationship for all the sub-samples having a significant impact on the spreads.
For the sub-sample market-based the variable Maturity has a convex relationship impact on the spread. The variables Currency risk, Fixed rate, Country
Risk, Common Law, Log total assets and Debt to total assets have an insignificant
influence on the spread. On the other hand, in the bank-based financial systems these variables were all significant to the spread except for the variables of the acquired firms' characteristics.
On the sub-sample U.S. the variables Number of tranches, Log total assets, Debt
to total assets and Short-term debt to total debt have an insignificant impact on
spread. The sub-sample W.E. had a dissimilar impact on these variables, being significant on the spread. However, the variables Fixed rate, Rated, Rated*Rating,
Common Law, Market-Based, Log total assets, Debt to total assets, Market to book ratio, Return on assets have an insignificant impact on the spread.
In conclusion, the acquired firms' characteristics only had an impact on the spread for the sub-samples market-based and U.S.
Table 4: Expected sign and findings
Independent Variables Expected Findings
Sign M.B B.B. U.S. W.E.
Microeconomic Independent Variables:
Maturity (years) + CX CX CX CX
Log transaction size - - + - +
Loan size to deal size - - - - -
Number of tranches - - - I/- -
Currency risk + I/+ + - +
Number of lenders - - - - -
Fixed rate I/+ I/+ - + I/-
Rated - - I/+ - I/+
Rated*Rating + + I/- + I/-
Term Loan + + + + +
Macroeconomic Independent Variable:
Risk free rate - - - - -
Country Risk + I/- + N/A +
Volatility I/+ + - + -
5yTB-3mTB - - - - -
Common Law I/+ I/- + N/A I/+
Market-Based + N/A N/A N/A I/+
Crisis + + + + +
Acquired firms' characteristics:
Log total assets I/+ I/+ I/- I/+ I/+
Debt to total assets I/+ I/- I/+ I/- I/+
Short-term debt to total debt I/- - I/- I/+ -
Fixed assets to total assets - - - - -
Market to book ratio I/- - I/+ - I/+
Return on assets I/- - I/- - I/+
Note: The following characters mean: – = negative impact on spread | + = positive impact on spread | I = insignificant impact on spread | CX = convex relationship | N/A = not applicable.