GDAēSK UNIVERSITY OF TECHNOLOGY
CHEMICAL FACULTY
DEPARTMENT OF ANALYTICAL
CHEMISTRY
MASTER THESIS
„Applicability of Head Space Solid Phase
Microextraction (HS-SPME) with Polyethylene
Glycol (PEG) fibre for GC-MS determination of
Volatile Fatty Acids in Aqueous Samples”
Student: Promoter:
Moosa Faniband Prof.dr.hab.inz. Bogdan Zygmunt
Supervisor:
mgr. inz. Anna Banel
ACKNOWLEDGEMENTS
All the praises and thanks are for Almighty Allah, who granted me the opportunity to learn and work in the scientific atmosphere.
I express my deep gratitude towards Prof. Bogdan Zygmunt for giving me the opportunity to work with him. I want to thank him for all the time spent with me for his guidance towards this work and patience while dealing with all the problems.
I want to pay my special thanks to mgr inz eng. Anna Banel for her continuous efforts to execute the work, her guidance, support and encouragement throughout this project. I am extremely grateful to Prof. Jacek Namiesnik for his valuable support and encouragement in everything. I specially thank him for his cheerful nature and humour which helped us to keep up our spirit.
Special thanks to Dr. Piotr Konieczka for his timely guidance and help.
I highly appreciate all my lab mates and my colleagues Teeka and Anu for their company and support through thick and thin, during my stay in Gdansk.
Special thanks to the European Union for providing me a studentship and an opportunity to live and study in Europe through the EMQAL course. And I express deep sense of respect towards University of Algarve and Gdansk University of Technology.
Table of Contents A. List of abbreviations ... 3 B. List of tables ... 4 C. List of figures ... 5 D. Abstract ... 6 I. Introduction ... 7
II. Theoretical part ... 8-16 2.1. Techniques of extraction of VFAs ... 8
2.2. Literature study for determination of VFAs ... 9
2.3. An overview of SPME technique ... 10
2.4. SPME mechanism ... 10
2.5. SPME technique and review of fibres ... 11
2.6. Types of fibres and coatings ... 12
2.7. PEG ... 14
2.8. Analysis of fatty acids using SPME ... 15
2.9. Factors affecting the adsorption ... 16
III. Aim of study ... 17
IV. Experimental ... 18-21 4.1. Chemicals ... 18
4.2. Samples and solutions ... 18
4.2.1. Stock solutions ... 18
4.2.2. Working standard solutions ... 19
4.2.3. Aqueous standard solutions ... 19
4.3. Real samples ... 19
4.4. Sample preparation and extraction procedure ... 19
4.5. Apparatus ... 20
4.6. Procedure ... 20
4.6.1. Selection of the method ... 20
4.6.2. Operational conditions of chromatographic system ... 21
V. Results and discussion ... 22-37
5.1. Selection of GC conditions ... 22
5.1.1. SIM and SCAN mode ... 22
5.1.2. Desorption conditions ... 23
5.1.3. Extraction conditions ... 24
5.1.4. Extraction time ... 24
5.1.5. Extraction temperature ... 26
5.1.6. Sample volume ... 27
5.1.7. Quantity of sodium chloride ... 28
5.1.8. Selection of fibre for extraction of VFAs ... 29
5.1.9. Development of the method ... 30
5.2. Calibration curves ... 31
5.2.1. Calibration curves for volatile fatty acids standard mixture in water31 5.3. Determination of Limit of detection (LOD) and Limit of quantitation (LOQ) ... 34
5.3.1Method of LOD and LOQ calculation ... 35
5.4. Real samples ... 35
VI. Conclusion ... 38 VII. References ... 39-44
A. LIST OF ABBREVIATIONS
BTEX - Benzene-toluene-ethylbenzene-xylenes
CAR (DVB) -Carbowax-Divinylbenzene CAR (TR) -Carbowax-Template Resin
ECD -Electron Capture Detector
FID -Flame Ionization Detector
GC -Gas Chromatography
HPLC -High Performance Liquid Chromatography
HS -Head Space
LLE -Liquid-Liquid extraction
LLME -Liquid-Liquid Micro extraction
LOD -Limit of Detection
LOQ -Limit of Quantitation
MS -Mass Spectrometry
MTBE -Methyl-t-butyl ether
NIST -National Institute of Standard and Technology
PA -Poly Acrylate
PAHs -Polycyclic Aromatic Hydrocarbons
PCBs -Polychlorinated biphenyls
PDAM -1-pyrenyldiazomethane
PDMS -Polydimethylsiloxane
PEG -Polyethylene Glycol
SIM -Selected Ion Monitoring
SPME -Solid Phase Micro Extraction
VFAs - Volatile Fatty Acids
B. LIST OF TABLES
Table 1: Literature study of determination of volatile fatty acids by various techniques. Table 2: Comparison of some commercial fibres and the sol–gel PEG fibre (Z. Wang et
al. 2000).
Table 3: List of volatile fatty acids used for study with details of purity and density. Table 4: Ions selected for SIM monitoring of particular acids.
Table 5: Properties of the PEG fibre selected for study. Table 6: LOD and LOQ values for different acids determined
C. LIST OF FIGURES
Fig1: Schematic diagram of SPME device
Fig 2: Chromatogram of a standard solution of VFAs each at a concentration of 250
mg/dm3 (Stabilwax-DA and mass spectrum of a peak identified as acetic acid by NIST spectral library).
Fig 3: Optimization of desorption time
Fig 4: Effect of time on amount of analyte absorbed (Supelco bulletin 929A) Fig 5: Change of extraction yield (peak area) with extraction time at constant
temperature.
Fig 6: Selection of extraction temperature Fig 7: Selection of sample volume
Fig 8: Dependence of extraction efficiency on the quantity of NaCl added to the sample. Fig 9: Chromatogram obtained from working standard solution of 25 mg/L VFA C2– C8
mixture in MTBE.
Fig 10: Chromatogram obtained from standard mixture solution of 25 mg/L VFA, C2–
C7, in water.
Fig 11: Calibration curves with curve parameters for acetic acid. Fig 12: Calibration curves with curve parameters for propionic acid. Fig 13: Calibration curves with curve parameters for isobutyric acid. Fig 14: Calibration curves with curve parameters for butyric acid. Fig 15: Calibration curves with curve parameters for isovaleric acid Fig 16: Calibration curves with curve parameters for valeric acid Fig 17: Calibration curves with curve parameters for isohexanoic acid Fig 18: Calibration curves with curve parameters for hexanoic acid Fig 19: Calibration curves with curve parameters for heptanoic acid
D. Abstract
A method consisting of head-space solid phase micro extraction (HS-SPME) followed by gas chromatography coupled with mass spectrometry (GC-MS) was developed for determination of volatile fatty acids in wastewater. A new fibre polyethylene glycol (PEG) was evaluated for the sample preparation. This fibre is designed to show high sample capacity, faster mass transfer during extraction, shorter equilibrium times and faster desorption process. The developed method showed good sensitivity with comparable limit of detection (LOD) and limit of quantitation (LOQ) values. The selection of various parameters included extraction time, extraction temperature, sample volume and desorption conditions. The experimental results showed low detection limits ranging between 0.01 mg/L to 0.06 mg/L for different acids. The new fibre was found to be efficient towards acetic and propionic acid.
I. Introduction:
Volatile fatty acids (VFAs) are produced during anaerobic biodegradation of the organic matter. They originate from aerobic biodegradation of carbohydrates, proteins and fats [1]. Monitoring of VFAs is of growing interest since they are, together with sulphur compounds and volatile amines, responsible for odour formation in waste water treatment or during composting operations [1]. VFAs originate from natural as well as anthropogenic sources. They are emitted by some bacteria, fungi, higher plants and animals; and anthropogenic sources such as pig farming, food processing, organic wastes, wastewater, waste sludge, waste leachates, etc.[2]. The analytical determination of VFAs, polyfunctional aliphatic acids and amino acids is very important because of ecological and environmental technological considerations. The presence of VFAs in
sample matrix often indicates bacterial activities.
VFA analysis is of significance in studies of health and disease in the intestinal tract. VFA measurements are required to monitor the operation of landfills and biological wastewater treatment plants carrying out anaerobic digestion, phosphorus removal or denitrification. VFAs such as acetic acid and propionic acid have been demonstrated to be the most suitable substrates to support enhanced biological phosphorus removal [3, 4]. Studies have also been presented showing that VFAs such as acetic, butyric and propionic acid can reduce nitrate formation with no effect on ammonia oxidation during activated sludge treatment [5, 6]. Also leaching of the organic content as a result of percolation and biological transformation processes occurs in landfills. This leads to uncontrolled environmental impacts due to run-off of toxic compounds into surface waters. Beyond this, the emission of methane contributes to the greenhouse effect. If these effluents are treated properly, they can contribute in environmental protection and energy recovery.
II. Theoretical Part:
2.1. Techniques of extraction of VFAs:
For short-chain acids, the sensitivity and reproducibility of the analytes is poor because they are very polar and soluble in water and are possibly adsorbed in the gas chromatographic (GC) column, especially at low concentrations. And for long chain fatty acids this happens because the long chain acids are less volatile and unsuited to GC stationary phases [7]. The most common practice to prevail over this problem is methylation. However, methylation also has limitations when dealing with short-chain fatty acids.
Traditional methods for the extraction of organic compounds have been persistently used such as Soxhlet extraction. These methods are time consuming, and need high purity solvents in large quantities. These solvents no doubt are expensive but some of them are also toxic and carcinogenic, which in turn raise environmental concerns. This gave rise to the development of easy, solvent free techniques such as Solid-Phase Micro Extraction (SPME). Sorbent extraction techniques can be classified as solid-phase extraction (SPE) and solid-phase micro extraction [8]. In SPE, the liquid sample is passed through a sorbent where the analytes of interest are retained, similar like a stationary phase in high performance liquid chromatography (HPLC). SPE has been known as a powerful tool for chemical isolation and purification ever since it came into existence. SPE uses an adsorbent material to extract trace organic compounds from aqueous samples. But it is more suitable to semi-volatile or non- volatile compounds. The more usual approach is to use SPE in an offline procedure, analytes are desorbed from the sorbent with a small volume of organic solvent and an aliquot of sample is subsequently analysed. But this procedure has a major drawback of high risk of contamination. The SPME is characterised with the simplicity, solvent free, non-exhaustive technique, which takes over all other techniques. Besides this it has higher detection limits than liquid-liquid (LLE) [8]. SPME has very effective concentrating effect and leads to good sensitivity. Taking into consideration all these features, SPME could be concluded as very suitable fast screening technique which also can be used on-field, can be completely automated and coupled with GC and HPLC, with better detection limits. However, carry over and precision can be of problem sometimes [9].
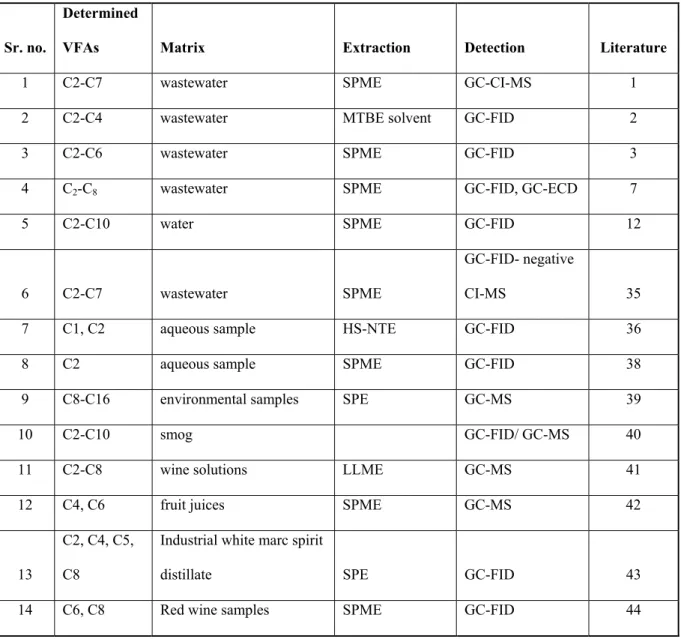
2.2. Literature study for determination of VFAs:
Various methods have been reported for the determination of VFAs such as Gas Chromatography (GC) and High Performance Liquid Chromatography (HPLC) with a wide range of detectors which are accounted in the table below. Apart from chromatographic techniques, Fourier transform Raman Spectrometry [9] and electrochemical detection techniques [10] have also been used in some studies. Generally a derivatisation step is included before GC analysis, to determine non-polar VFAs, but there is a risk of analyte loss, contamination potential and poor reproducibility. Hence direct aqueous injection of sample without any derivatisation step has been advised by lot of researchers, but also lay disadvantages such as contamination of column or GC injection port and increased maintenance.
Table 1: Literature study of determination of volatile fatty acids by various techniques.
Sr. no.
Determined
VFAs Matrix Extraction Detection Literature
1 C2-C7 wastewater SPME GC-CI-MS 1
2 C2-C4 wastewater MTBE solvent GC-FID 2
3 C2-C6 wastewater SPME GC-FID 3
4 C2-C8 wastewater SPME GC-FID, GC-ECD 7
5 C2-C10 water SPME GC-FID 12
6 C2-C7 wastewater SPME
GC-FID- negative
CI-MS 35
7 C1, C2 aqueous sample HS-NTE GC-FID 36
8 C2 aqueous sample SPME GC-FID 38
9 C8-C16 environmental samples SPE GC-MS 39
10 C2-C10 smog GC-FID/ GC-MS 40
11 C2-C8 wine solutions LLME GC-MS 41
12 C4, C6 fruit juices SPME GC-MS 42
13
C2, C4, C5, C8
Industrial white marc spirit
distillate SPE GC-FID 43
2.3. An overview of SPME technique:
SPME makes analyte identification and quantitation more reliable by reducing interferences of noise in pesticide or other analytes [11]. The amount of analyte adsorbed by the fibre depends on the thickness of the polymer coating and on the distribution constant for the analyte. The distribution constant of the analytes generally increases with increasing molecular weight and boiling point of the analyte. Selectivity can be made more specific by changing the type of the polymer coating on the fibre or the type of target analytes. Volatile compounds require a thicker coating and a thin coating is usually most effective for enrichment of less volatile analytes. Also one of the advantages of SPME is that the amount of analyte extracted by the fibre coating is regardless to sample volume. This makes this technique ideally suited for direct field sampling and analysis. SPME significantly reduces field analysis time by combining sampling, extraction and concentration into a short single process.
For high accuracy and precision from SPME, consistency in sampling time and other sampling parameters is more important than full equilibration. It is also important to keep constant the vial size and the sample volume and, when sampling by immersion, the depth to which the fibre is immersed in the sample [12].
2.4. SPME mechanism:
Solid phase micro-extraction is a very convenient, time saving, solvent free extraction method, which is being widely accepted and used in various analytical techniques. Besides, it is the most efficient and a very adaptable technique for selective sample preparation prior to analysis. In SPME, is used a thin layer polymer coated fine optical fibre to extract analytes directly from a liquid, the headspace above liquid or solid or a gaseous phase [12]. The analytes are adsorbed on this fibre during sample extraction and desorbed thermally after the injection of the fibre in hot injector port of the instrument. And the analysis of desorbed analytes proceeds simultaneously with desorption. The techniques involved in SPME agitation are the most commonly followed magnetic stirrer technique or the other follows moving of the fibre in the aqueous solution by insertion-withdrawal of fibre or vibration. Also sonication is a potential technique which has advantages of both stirring as well as vibration. SPME method coupled with GC is a big success in Gas chromatography. The method is being used extensively ever since it came into existence.
Fig1: Schematic diagram of SPME device
2.5. SPME technique and review of fibres:
Phenols were the first group of polar compounds analyzed with the SPME technique, and this method was successful [11]. SPME when coupled with derivatization leads to a significant improvement in the sensitivity for the determination of polar fatty acids and enhances the coating gas and coating water partition coefficients of target analytes [13]. The diffusion coefficients in water are lower by several orders of magnitude compared to extraction from the gas phase, hence mass transport in solution is slower compared to gas phase, i.e. the time necessary to attain equilibrium is higher by an order of magnitude under static absorption conditions when extracting aqueous solutions [14].
Extensive comparitive studies of different agitation techniques have been presented by R. Eisert and J. Pawliszyn (1997) which conclude as follows. The preference of the technique depends on the purpose and the compounds interested. High
precision was reported using fibre vibration method and small 2ml vials, which could be suitable where the sample volume was limited. Magnetic stirring showed slightly faster equilibration for compounds with higher k (distribution constant) values as compared to fibre vibration method. From all the different adsorption modes used in the study it was concluded that efficiency of SPME could be optimised by a high linear flow at the surface of the fibre. Hence, the stationary layer of water surrounding the fibre was kept to a very small radius. And technically this can be achieved either by mixing the aqueous sample or by moving the fibre itself. The fibre vibration technique improved the efficiency for the automated SPME-GC for semi-volatile analytes, the sample output was increased and the precision was still high [14]. The comparision of SPME-GC-ECD versus LLE-GC-ECD, in determination of carbonyl compounds proves the reliability of SPME technique with better LODs [14].
SPME technique has been used very extensively for varied purposes and indifferent matrices such as fatty acids [1], [12]; volatile organic compounds in sediments and water [14], amines in air and water [13], carbonyl compounds in water [15], chlorobenzenes in water [16], analysis of cyanide in blood [17], etc.
It has also been discussed about the types of SPME fibres available and their properties and their suitability for different analytes, in this study.
2.6. Types of fibres and coatings:
The choice of the most suitable coating is very important for achieving good selectivity for the target analytes; the principle of “like dissolves like” can be applied to fibre selection [18]. Non- polar analytes are most effectively extracted with a non-polar fibre coating and polar analytes are most effectively extracted with a polar coating.
A wide range of SPME fibres are being provided by various companies, besides these researchers develop their own made to order fibres according to the behaviour of their analytes. Selection of fibres is also a crucial decision. Various parameters have to be taken into consideration before deciding the type of fibre to be used for a specific purpose. This takes a lot of comparative study using different fibres for determining a same analyte or analytes in laboratory made standards or the real samples. Firstly, the polarity and thickness of the coating of fibre is to be decided carefully while dealing
with volatile compounds. Thicker the coating, the better it is for the retention of highly volatile compounds. Thinner coats can be advisable for fast diffusion and release of semi-volatile compounds. But on the other hand thinner coats provide fast diffusion and fast and better desorption, whereas thicker coatings provide better sensitivity but take longer extraction times and desorption times. Sensitivity is not the only aspect to be considered to compare the performance of the fibre, a relative lack of affinity for interfering compounds and the ability to be desorbed easily so that no sample carryover occurs is an important consideration [19].
Various authors have worked with different fibres and developed methods for determination of their specific analyte of interest for diverse matrices. Lin Pan et al. performed a comparative study of three fibres PDMS, PA and Carboxen-coated with derivatization agent PDAM for the determination of fatty acids [12], in another study they compared CAX (DVB), PDMS and PA fibre for determination of amines in air and water [13]. In another approach, K. Takekawa et al. applied Carbowax (DVB) for the analysis of cyanide in blood [17]. F. Mangani and R. Cenciarini developed a method for a coating a fused silica fibre with graphitized carbon black, Carbograph I [20]. Fibres have also been developed coated with phenyl, C8 and monomeric and polymeric C18
stationary phases for the determination of PAHs in water samples for HPLC [21].
There are two distinct types of SPME coatings available commercially, one is absorption type and the other is adsorption type; absorption type coating is a rubber-like liquid polymer which looks solid but is in a liquid form at desorption temperatures, and the adsorption type is a solid porous like material [22]. The most widely preferred material is polydimethylsiloxane (PDMS). It is a liquid coating with a high viscosity rubbery liquid. Poly acrylate (PA) is a solid crystalline coating that turns into liquid at desorption temperatures. Both PDMS and PA extract analytes by absorption. The other coatings including PDMS–DVB (divinylbenzene), Carbowax–DVB, Carbowax–TR (template resin—DVB with uniform pore sizes) and Carboxen, are mixed coatings, in which the primary extracting phase is a porous solid, extract analytes by adsorption. The organic molecules might sometimes remain in the coating for long time and hence they can diffuse into the bulk of the coating and this could result in the process called persistent carryover which is difficult to eliminate even after repeated desorptions.
According to study of G. Tadeusz et. al. (1999) adsorption is treated as a reaction where a molecule A reacts with an empty site, S, to yield an adsorbed complex Aad:
At equilibrium, surface concentration of A in mol cm-2, [Aad], is described by the
following equation:
where, [S0] is the total concentration of active sites on the surface (maximum surface
concentration of the analyte) in mol cm-2, KA is the adsorption equilibrium constant, and
[A] is the concentration of A in the matrix.[22]
If the extraction of the analytes on the surface of the adsorption type coating is considered as the process where the analytes interact with the adsorption sites to form complexes, we might describe the relationship between the adsorbed amount of an analyte and its concentration at equilibrium in the sample by Langmuir isotherm. [23].
2.7. PEG:
Polyethylene glycol (PEG) is a newly developed phase coating specially designed to extract polar analytes from non-polar matrices. Only few reports such as Wang et al. (2000) and R. G. C. Silva (2005), of this PEG fibre used for SPME are known. This material can be coated well on an inert metal fibre better than other fibres, which provide durability of the fibre. According to SUPELCO Bulletin 923, it is beneficial to add an adsorbent material to the coating such as coating strongly polar Carbowax PEG onto divinylbenzene polymer. The polymer increases the available surface area and thus improves extraction of small polar molecules. This material also facilitates long lengths of the fibre coating and unbreakable. Besides, the top priority of PEG fibre is its durability and robustness [24].
Until date several polymer-coated fused-silica fibres for SPME have been commercially available [25]. The PDMS fibre shows excellent selectivity for non-polar compounds such as benzene-toluene-ethylbenzene-xylenes (BTEX) [26], polycyclic aromatic hydrocarbons (PAHs) [27], and polychlorinated biphenyls (PCBs) [28]. The PA fibre which has an obviously more hydrophilic coating facilitates the extraction of polar analytes such as phenols [29], organophosphorous pesticides [30] and nitrogen containing herbicides [31].
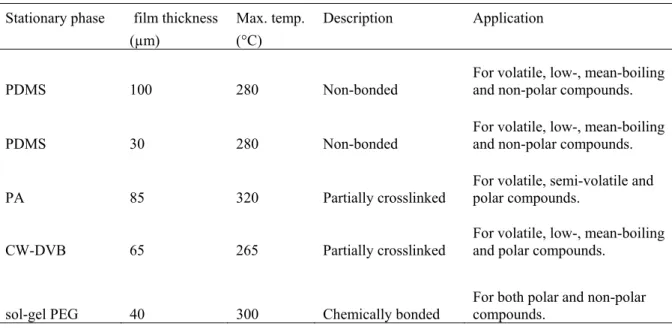
The newly developed high performance Polyethylene glycol (PEG) fibre shows a high sample capacity to both polar and non-polar compounds [32]. Z. Wang et al. (2000) detailed explanations of the structure and performance of PEG fibre say that PEG material has faster mass transfer during extraction, shorter equilibrium times and faster desorption process. The porous coating structure of the sol-gel PEG fibre significantly increases the available surface area on the fibre, thus facilitating high mass transfer rate.
Table 2: Comparison of some commercial fibres and the sol–gel PEG fibre (Z. Wang et
al. 2000).
2.8. Analysis of fatty acids using SPME:
Analysis of the volatiles in water can be sub-divided according to the extraction agents, into gas extraction, liquid extraction, solid phase micro-extraction, membrane Stationary phase film thickness Max. temp. Description Application
(µm) (°C)
PDMS 100 280 Non-bonded
For volatile, low-, mean-boiling and non-polar compounds. PDMS 30 280 Non-bonded For volatile, low-, mean-boiling and non-polar compounds.
PA 85 320 Partially crosslinked
For volatile, semi-volatile and polar compounds.
CW-DVB 65 265 Partially crosslinked For volatile, low-, mean-boiling and polar compounds.
extraction, distillation techniques and direct injection [33]. In gas extraction the analytes are directly extracted into the carrier gas. Liquid extraction involves extraction of analytes into small amount of organic solvents, hence increasing simplicity of the technique, improving speed and low solvent consumption. In SPME as we know, the analytes are adsorbed on the optical fibre while extraction and desorbed into hot injector while analysis. It is the fast, simplest, sensitive, cost-effective and solvent free technique which can be used for gaseous as well as liquid samples. In membrane extraction, the aqueous sample is contacted with a membrane and volatile organic compounds (VOCs) leak selectively through the membrane into gaseous phase on the other side. Then follows evaporation or stripping of VOCs from outer membrane surface into the stripping gas. Distillation technique follows pre-concentration step before GC analysis of water distillate. But this technique needs another pre-concentration technique too which is difficult. Hence this method is not as popular, as it is a bit complicated. In direct injection, sample is directly injected into the GC column. This is a very rapid method but can contaminate the injector and column as well. Hence, it is not very reliable. W. Wardencki et al. (2007) has discussed in detail about the recent developments which have allowed the full automation of the SPME and headspace (HS) processes. The techniques are fulfilling the most important requirements for “greener” sample preparation techniques. Their main features are that they require less organic solvents, they integrate the discrete steps of the analytical process (sample preparation, analysis, automated record keeping with greater use of combined methods, e.g., SPME/GC/MS), they are amenable to smaller sample volumes and miniaturization, standardization, automation, modularization, on-line, and onsite measurement, and require less sample preparation, due to improvements in selective detection [34].
2.9. Factors affecting the adsorption:
Adsorption process is very sensitive to various parameters such as temperature, the type of coating material on the fibre, extraction time, type of extraction, pH of the sample, etc. These parameters are discussed in detail in the experimental part of the study. Adsorption is a competitive process and hence matrix composition as well as extraction conditions, all affect the amount of analyte extracted by the fibre. Derivatization and type of matrix can also affect the adsorption.
III. AIM OF STUDY
The analytical determination of volatile fatty acids (VFAs) has gained importance in recent years from the ecological and environmental point of view. VFA measurements play a significant role in the monitoring of sewage and wastewater treatment plants and landfill operations. A lot of effort has been poured into this area constantly, to develop newer and better methods for their determination.
Aim of this work was to develop a method for qualitative and quantitative determination of the VFAs in wastewater based on the Solid Phase Micro Extraction (SPME) using a novel fibre coated with Polyethylene Glycol (PEG) for sample preparation and Gas Chromatography coupled with Mass Spectrometry (GC-MS) for the analysis proper. PEG is a newly developed phase coating specially designed to extract polar analytes from rather non-polar matrices.
This research work includes selection of the significant parameters for the method being developed i.e. for GC-MS analysis and for SPME extraction process. Then the procedure developed was subjected to a sort of validation and used to analyse real samples.
IV. Experimental: 4.1. Chemicals:
Chemicals were obtained from a variety of suppliers. All the fatty acids; acetic acid, propionic acid, iso-butyric acid, butyric acid, iso-valeric acid, valeric acid, Caproic acid, enanthic acid and caprylic acid, were obtained from the Fluka (Switzerland). 2-ethyl butyric acid used as internal standard (IS) was obtained from the manufacturer Fluka (Switzerland). Methyl-tert-butyl ether (MTBE) was from Merck (Germany). Volatile acid standard mixture of C1-C7 (10mM) in water used was obtained from
Supelco, USA. H2SO4 used was of 95% purity of brand Polskie Odczynniki Chemiczne
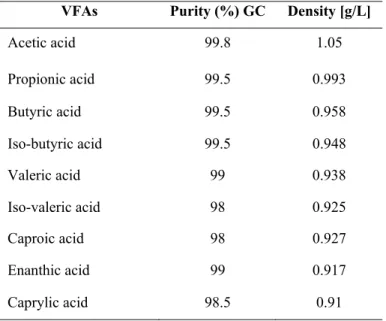
POCh Gliwice. Sodium chloride pure p.a. used of brand Polskie Odczynniki Chemiczne POCh Gliwice. Water used in experiments was purified by reversed osmosis with the use of Millipore Qplus 185. The characteristics of the VFA reagents is given in table 3.
Table 3: List of volatile fatty acids used for study with details of purity and
density.
VFAs Purity (%) GC Density [g/L]
Acetic acid 99.8 1.05 Propionic acid 99.5 0.993 Butyric acid 99.5 0.958 Iso-butyric acid 99.5 0.948 Valeric acid 99 0.938 Iso-valeric acid 98 0.925 Caproic acid 98 0.927 Enanthic acid 99 0.917 Caprylic acid 98.5 0.91
4.2. Solutions and samples: 4.2.1. Stock solutions:
Stock solutions of individual acids were prepared by dissolution of known amounts of VFA reagents in MTBE or in methanol. These solutions were mixed together in selected proportions to obtain a stock solution. Stock solution of 5000 mg/L
VFAs concentration was prepared; it was later used for working standard solution preparation.
4.2.2. Working standard solutions:
Working standard solutions of VFAs in organic solvent of concentration from 0.1 mg/L to 750 mg/L were prepared for calibration study. Calibration standards were prepared using serial dilution with water and 2-ethyl-butyric acid was added as internal standard.
4.2.3. Aqueous standard solutions:
These solutions were prepared by spiking milliQ water with the stock solution in MTBE or methanol. In another approach, a stock standard solution in water (10mM) was diluted with milliQ water. The concentration was in the range from 0.05 mg/L to 200 mg/L. In all cases 2-ethyl-butyric acid was added as an internal standard.
4.3. Real Samples:
Real samples of wastewater and leachates were collected from wastewater treatment plant. They were collected into plastic bottles and acidified to pH of about 2 for their preservation and stored in refrigerator at 40C. The 2 ml of acidified samples was taken into 15 ml of glass vials and internal standard and NaCl was added to vials, after which the extraction procedure was followed.
4.4. Sample preparation and extraction procedure:
To each sample of 2 ml volume, one drop of concentrated H2SO4 and 0.75 g of
NaCl was added and magnetic stirrer was put into the vial. The extraction temperature was set to 250C and agitation speed was set at 1200 rpm. The sample was initially agitated for 3 min and then the SPME fibre was introduced into the headspace and kept exposed for 40 min.
4.5. Apparatus:
SPME Device and fibre:
A manual syringe holder used to mount the SPME fibre was obtained from SUPELCO, Bellefonte, PA. The SPME fibre used in the following study was a 60Pm polyethylene glycol (PEG) coated fibre from Supelco.
Gas chromatograph and mass spectrometry:
Gas chromatographic analysis was carried out using a Thermo Finnigan Trace GC gas chromatograph equipped with a split/splitless injector and a TRACE DSQ quadrupole mass spectrometer. Chromatographic column used was an open tubular capillary column (30m x 0.32mm x 0.50Pm) coated with Stabilwax-DA (crossbond polyethylene glycol treated with nitroterephthalic acid).
Magnetic stirrer:
Agitation of the sample was carried out using a magnetic stirrer; a 10x3 mm stirring bar coated with PTFE. The stirring rate was set at 1200 rpm for 2 ml samples using the equipment Heidolph, MR3000D, Merck. The temperature of magnetic stirring equipment was set at 25oC during extraction process.
4.6. Procedure:
4.6.1. Selection of the Method:
Series of experiments were carried out for the selection of the whole method taking into consideration GC conditions, desorption conditions and extraction conditions such as time and temperature of extraction, volume of sample for extraction, quantity of salt added, pH and type of the fibre used. From the thermodynamic considerations, parameters such as temperature, ionic strength of solution, the polarity of the sample matrix and type of fibre affect the partition coefficient of the analyte between the sample and the stationary phase on the fibre, and thus the extraction efficiency and sensitivity of the method. All these parameters should be included in the optimization process. The basis for the selection of the parameters was to obtain the highest possible extraction efficiency and thus sensitivity while maintaining satisfactory repeatability and maintaining a reasonable analysis time and relatively small labour.
4.6.2. Operational conditions of chromatographic system:
The carrier gas was helium at a flow-rate of 1.5 mL min-1. An injection port equipped with a 1 mm I.D. liner operated in splitless mode was kept at a temperature of 230°C. Transfer line temperature was set at 230°C and electron impact ion source (70eV) was held at 240°C. MS was operated in a full scan mode (m/z 40-400) and in a SIM mode. Temperature program was: 40°C (3 min) then 40°C/min to 180°C (1 min) and then 10°C/min up to 230°C (1 min). Temperature program was selected based on the data contained in the available literature and on own research. Total chromatographic analysis time was approximately 15 minutes.
4.6.3. General SPME procedure:
SPME fibres were conditioned to remove any contaminants. Fibre was conditioned prior to use in a split/splitless inlet at the temperature and time recommended by the manufacturer. 15 ml open top vials with septa were used for extraction. Sodium chloride and magnetic stirrer bar were put into the sample vial which was placed on a heater/magnetic stirrer and septa pierced by the SPME needle. The sample was left on the heater/magnetic stirrer equipment for 3 min and then the SPME fibre was exposed to the sample head-space for 40 min. Then the fibre was retracted and removed from vial and immediately introduced into the heated GC injection port and was left there for desorption.
V. RESULTS AND DISCUSSION: 5.1 Selection of GC conditions: 5.1.1 SIM and SCAN mode
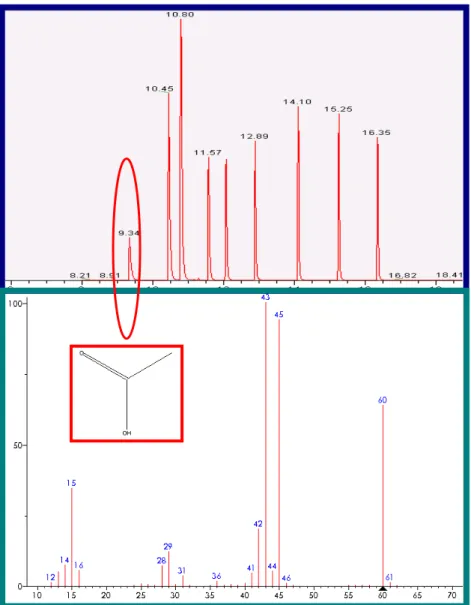
Using the selected temperature program, the experiments were carried out in two modes; SIM and SCAN mode. Chromatograms obtained in SIM mode are characterized by greater selectivity, which facilitates the quantitative interpretation of data. The peaks were identified by retention parameters. The characteristic fragment ions for individual acids obtained from GC-MS analysis of VFAs in SCAN mode were chosen. The mass spectra of the obtained peaks were compared with mass spectra in the library MS. The chromatogram of a standard VFA solution and the peak of acetic acid identified by its mass spectrum is shown in the figure below (Fig.2).
Fig 2: Chromatogram of a standard solution of VFAs each at a concentration of 250
mg/L (Stabilwax-DA and mass spectrum of a peak identified as acetic acid by NIST spectral library).
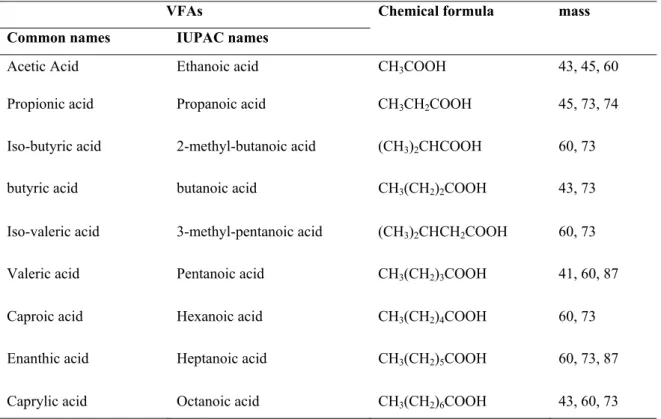
Table 4: Ions selected for SIM monitoring of particular acids.
VFAs Chemical formula mass Common names IUPAC names
Acetic Acid Ethanoic acid CH3COOH 43, 45, 60
Propionic acid Propanoic acid CH3CH2COOH 45, 73, 74
Iso-butyric acid 2-methyl-butanoic acid (CH3)2CHCOOH 60, 73
butyric acid butanoic acid CH3(CH2)2COOH 43, 73
Iso-valeric acid 3-methyl-pentanoic acid (CH3)2CHCH2COOH 60, 73
Valeric acid Pentanoic acid CH3(CH2)3COOH 41, 60, 87
Caproic acid Hexanoic acid CH3(CH2)4COOH 60, 73
Enanthic acid Heptanoic acid CH3(CH2)5COOH 60, 73, 87
Caprylic acid Octanoic acid CH3(CH2)6COOH 43, 60, 73
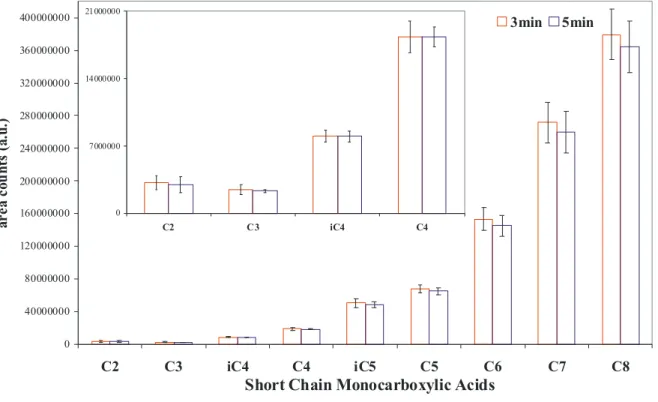
5.1.2. Desorption conditions:
The two most important parameters with respect to desorption efficiency are desorption time and injector temperature. These parameters should be given prime importance to make sure there is minimum or no carry over effect. The slower the rate of desorption, the wider their bandwidth and poorer separation. Increase in temperature causes reduction in affinity and thus increases the effectiveness of release of the analytes and carrier gas flow rate determines the time of transfer of analytes into the GC column. In order to verify if the analytes remaining on the fibre affect the result of subsequent determinations, the fibre was again placed in the GC injector chamber after the first desorption and released substances were subjected to determination. Surface area after the second desorption was smaller than 0.5% of the surface area of the desorption peak. This means only trace amounts remain in fibre after the first desorption and can be omitted, since they are smaller than the experimental errors.
Desorption temperature of 2300C was selected from the available published literature and previous studies. The process was conducted for 3 and 5 min. and corresponding peak areas on two chromatograms were compared (Fig. 3). The
difference was not statistically significant and the time of 3 min. was selected for desorption. 0 40000000 80000000 120000000 160000000 200000000 240000000 280000000 320000000 360000000 400000000 C2 C3 iC4 C4 iC5 C5 C6 C7 C8
Short Chain Monocarboxylic Acids
ar ea cou nt s (a. u. ) 3min 5min 0 7000000 14000000 21000000 C2 C3 iC4 C4
Figure 3: Selection of desorption time
5.1.3. Extraction conditions:
Selection of extraction conditions was carried out keeping in mind parameters viz. extraction time, extraction temperature, sample volume and quantity of salt added.
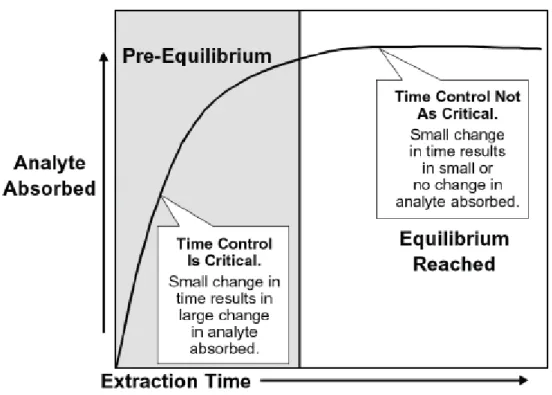
5.1.4. Extraction time:
On the basis of previous studies and publications it can be concluded that equilibrium is not achieved within 20 min. of extraction time. SPME is an equilibrium based process and maximum amount of analyte is extracted when the process is conducted until equilibrium is reached. The exposure time of fibre to the analytes should be critically controlled to ensure good reproducibility. Equilibration time and thus the extraction time is dependent on the analyte partition coefficient, diffusion coefficient and the intensity of mixing the sample, which shortens the time to reach equilibrium. Agitation helps faster transport of analytes to the fibre, hence fasting reaching the equilibrium. Obviously the equilibrium time depends on the stationary phase film thickness on fibre, which is determined by the choice of a fibre.
Fig 4: Effect of time on amount of analyte absorbed (Supelco bulletin 929A)
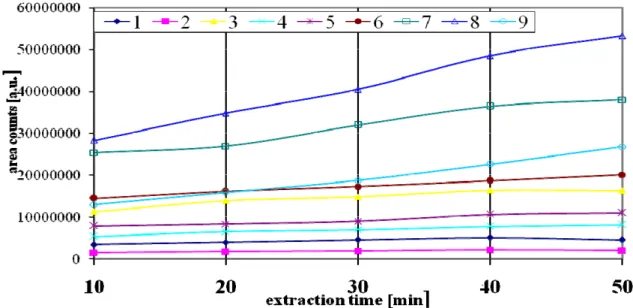
For selection of extraction time which not necessarily must be the time when equilibrium was reached. Experiments with extractions of 10 min., 20 min., 30 min., 40 min. and 50 min. were conducted (Fig 5). From the results, it can be deduced that acetic acid and propionic acid extraction yields rather do not change with the extension of extraction time. In the case of some acids, the extraction yields increase but rather slowly, especially at the time exceeding 40 min. and this time was selected for extraction.
Fig 5: Change of extraction yield (peak area) with extraction time at constant temperature.
5.1.5. Extraction temperature:
Temperature increase enhances the extraction process by faster transfer of analytes to the fibre. Temperature has interestingly contrasting effect on HS-SPME. Changing the temperature alters the distribution coefficient of analytes determined between different phases. Increasing the extraction temperature increases the partition coefficient of analytes between head space and aqueous sample and hence sensitivity. But excessive heating of the sample decreases the efficiency of the adsorption process on the fibre, as adsorption is an exothermic process. Theory of thermodynamics explains the partitioning of analytes between two different phases. Hence, extraction temperature is to be considered a critical parameter for extraction process. These changes are contrary; therefore it must be an optimum temperature at which the efficiency of extraction of the analyte is the greatest. Choosing the extraction temperature should certainly take into account many other factors. Temperature in which the extraction of volatile fatty acids was studied was set in the range of 250C-450 C. Excessive increase in temperature could increase of permeation of analytes through the membrane and possible loss of analytes and also the water vapour in head space which could have a negative effect on sorption of the fibre.
In the present study, temperature of 25oC, 35oC and 45oC were examined. As it can be seen from the results (Fig. 6), the response of fatty acids C2-C6 to the higher
temperatures i.e. 35oC and 45oC decreases the peak area. So, the most convincing temperature for these acids was 25oC. And increased temperature increased the response of C7 and C8. All these results are in line with previous studies and publications by various authors. For other fibres the difference between peak areas at 25oC and 35oC doesn’t seem significant for these two acids. However at 45oC, the peak areas are undisputedly higher, but values of standard deviation are high as well. Hence, the temperature of 25oC would be the best also for the two acids. So the temperature of 250C was chosen for analyte HS-SPME extraction.
0 100000000 200000000 300000000 400000000 500000000 600000000 700000000 C2 C3 iC4 C4 iC5 C5 C6 C7 C8
Short Chain Monocarboxylic Acids
ar ea co u nt s [a .u .] 25°C 35°C 45°C 0 5000000 10000000 15000000 C2 C3
Fig 6: Selection of extraction temperature
5.1.6. Sample volume:
General trend for this parameter is decrease of headspace-aqueous phase ratio lowers the analyte transfer. Amount of analytes extracted is strongly related to partition coefficient, sample concentration and volume of stationary phase of fibre.
For optimization, to obtain highest efficiency of the method and overall sensitivity of the procedure, sample volume of 2ml, 5ml and 8ml was placed in 15ml extraction vials. Surprisingly the peak areas were the highest for the sample volume of 2 ml. In all cases the examined initial concentration of analytes was equal to 25 mg/L. The effect of sample volume on the peak areas of VFAs is shown in Fig 7.
0 100000000 200000000 300000000 400000000 500000000 C2 C3 iC4 C4 iC5 C5 C6 C7 C8
Short Chain Monocarboxylic Acids
ar ea cou nt s (a. u .) 2ml 5ml 8ml 0 5000000 10000000 15000000 20000000 25000000 C2 C3 iC4 C4
Fig 7: Selection of sample volume
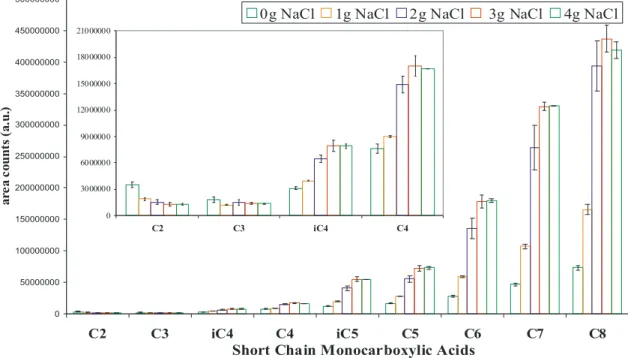
5.1.7. Quantity of Sodium chloride:
Many studies have shown the importance of addition of salt, usually sodium chloride to aqueous samples from which organic analytes are to be extracted. Addition of salt increases ionic strength of sample, reduces the solubility of analytes in the sample and hence it should decrease the coefficient of analyte partitioning between aqueous sample and head space and hence the extraction yield to head space. The degree of increased efficiency of extraction depends on the target analytes and concentration of salt added.
Here, experiment was conducted with samples with no NaCl, 1g, 2g, 3g and 4g of NaCl in 8 mL of sample volume (Fig 8). Better results are seen for 3 g of NaCl with low standard deviation values. Hence, amount of NaCl selected was 3g for 8 ml samples and proportional amounts for the sample volumes, e.g. 0.75g for 2 ml sample.
0 3000000 6000000 9000000 12000000 15000000 18000000 21000000 C2 C3 iC4 C4 0 50000000 100000000 150000000 200000000 250000000 300000000 350000000 400000000 450000000 500000000 C2 C3 iC4 C4 iC5 C5 C6 C7 C8
Short Chain Monocarboxylic Acids
ar ea co u n ts (a .u .)
0g NaCl 1g NaCl 2g NaCl 3g NaCl 4g NaCl
Fig 8: Dependence of extraction efficiency on the quantity of NaCl added to the sample (8 ml).
5.1.8. Selection of the fibre for extraction of VFAs:
The selection of an SPME fibre is based on the principle that non-polar analytes are efficiently extracted into the non-polar stationary phase, and polar analytes are better extracted with polar stationary phase. Selection of the proper fibre is extremely important for the procedures based on micro extraction. Free volatile fatty acids especially the short chain, are compounds with strong hydrophilic properties. According to the principle mentioned above, a polar fibre coating i.e. with polyethylene glycol 60ȝm thick film (Supelco, PEG) was selected for the present study. The characteristics of the fibre are given in Table 5.
Table 5: Properties of the PEG fibre selected for the study.
fibre coating Thickness pH
Max desorption temperature Conditioning temperature Conditioning time Polyethylene
5.1.9. Development of Method:
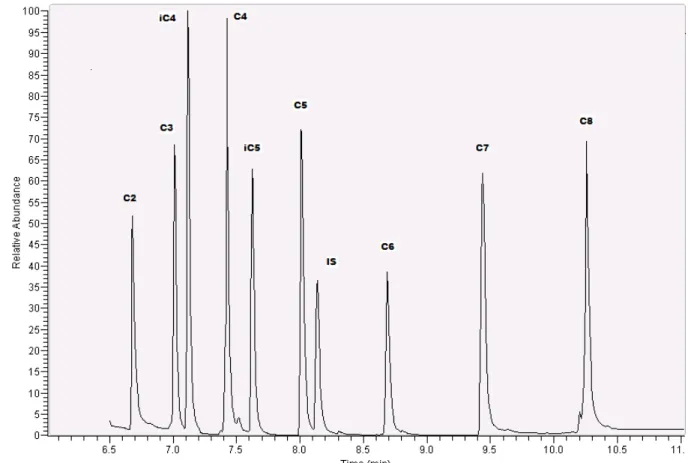
After optimization of all the described parameters for determination of VFAs by HS-SPME-GC-MS, the procedure was proposed and some validation parameters determined. First the calibration curves were prepared by plotting peak areas versus concentration. Four measurements were made for each concentration. Linearity, LOD and LOQ were estimated. Concentration of VFAs ranged from 0.005 mg/L to 750 mg/L in standard samples, to plot calibration curves. The chromatograms below (Fig 9 and 10) show the separation of different acids obtained by the developed method.
Fig 9: Chromatogram of a working standard solution of 25 mg/L VFA C2– C8
mixture in MTBE. C2- acetic acid, C3- propionic acid, iC4- iso-butyric acid, C4
-butyric acid, iC5-iso-valeric acid, C5-valeric acid, C6- caproic acid, C7-enanthic
Fig 10: Chromatogram of a standard solution (10mM) of 25 mg/L C2–C7 in water.
5.2. Calibration curves:
5.2.1. Calibration curves for volatile fatty acids standard mixture (10mM) in water added as aqueous standards:
Fig 20: Calibration curves with curve parameters for propionic acid (C3).
Fig 21: Calibration curves with curve parameters for isobutyric acid (iC4).
Fig 23: Calibration curves with curve parameters for isovaleric acid (iC5).
Fig 24: Calibration curves with curve parameters for valeric acid (C5).
Fig 25: Calibration curves with curve parameters for isohexanoic acid (iC6).
Fig 26: Calibration curves with curve parameters for hexanoic acid (C6).
Fig 27: Calibration curves with curve parameters for heptanoic acid (C7).
5.3. Determination of Limit of Detection (LOD) and Limit of Quantitation (LOQ):
Limit of detection and limit of quantification were calculated from the obtained peak areas by the analysis of calibration standards. Calculated LOD is lower than lower concentrated standard solution used for its determination and ten times LOD is higher than lower concentrated standard solution. Hence, calculated LOD is correct.
LOD and LOQ for working standard solutions of VFA mixture in water were calculated. The LOD and LOQ values obtained were good and comparable to the published articles. The determined LOD and LOQ values of the studied volatile fatty acids are given in the Table 6.
Table 6: LOD and LOQ values for different acids determined. VFAs mg/L LOD LOQ Acetic acid 0.05 0.15 Propionic acid 0.03 0.09 Iso-butyric acid 0.01 0.03 Butyric acid 0.06 0.18 Iso-pentanoic acid 0.04 0.12 Pentanoic acid 0.01 0.03 Iso-hexanoic acid 0.05 0.15 Hexanoic acid 0.02 0.06 Heptanoic acid 0.03 0.09
5.3.1. Method of LOD and LOQ calculation:
Various methods are applied to estimate LOD and LOQ values, in this case, the method adopted was calculation of LOD based on standard deviation of peak areas and slope of the calibration curve. The standard deviation was determined as a standard deviation of the intercept of the obtained calibration curve. LOQ was calculated as three times LOD value.
5.4. Real Samples:
Real samples were obtained from Ekodolina landfill site and Wschod wastewater treatment plant. All the samples were acidified to pH 2 and stored at 40C in refrigerator. Two sets of samples were collected from the landfill; leachates before treatment and leachates after treatment. 2ml acidified samples were taken into 15 ml glass vials and analysed by the procedure developed.
For wastewater, three sets of samples were collected; treated wastewater, mechanically treated wastewater and raw wastewater. The same procedure was
followed here like that for landfill samples. Fig 28. shows chromatogram obtained from the analysis of a real wastewater sample by the developed method.
In landfill samples, only acetic acid and butyric acid were determined. Other acids were below detection limits. In wastewater samples, all the acids were within detectable limits (Table 7).
Fig 28: Chromatogram of the mechanically treated wastewater showing VFAs C2-C7
C2-acetic acid, C3-propionic acid, iC4-iso-butyric acid, C4-butyric acid, iC5-
iso-valeric acid, C5-valeric acid, IS-internal standard (2-ethyl-butyric acid), iC6-iso-hexanoic acid, C6-hexanoic acid, C7-heptanoic acid.
Table 7: Estimated quantities of VFAs in landfill leachates and wastewater samples.
VFAs concentrations (mg/L)
Landfill samples waste water samples
Before treatment After treatment treated mechanically treated raw
C2 3.74-5.63 ND 6.58 102 92.3 C3 ND ND 1.09 43.2 18.7 iC4 ND ND 0.051 0.56 0.25 C4 0.772-0.841 0.614-0.712 ND 3.89 1.13 iC5 ND ND 0.85 2.75 1.71 C5 ND ND 1.34 5.07 2.23 iC6 ND ND 0.92 0.52 0.45 C6 ND ND 1.12 1.41 0.99 C7 ND ND 0.82 1.22 0.42 *ND- not detected
VI. Conclusion
A thorough investigation of different SPME fibre coatings used for determination of volatile fatty acids was done and compared to the performance of a newly developed PEG fibre. A qualitative and quantitative method was successively developed using HS-SPME-GC-MS, with PEG fibre and good LOD and LOQ values were obtained. This new PEG fibre proved to be very efficient towards acetic and propionic acid. PEG fibre can be used for the extraction of free VFAs from C2-C7 from
head space of aqueous samples. The stability of the fibre was found to be good even after 100 injections. Sensitivity is higher in higher molecular weight of VFAs. But in case of acetic acid which is miscible in water and difficult to determine, this method can be efficient.
The developed method was applied to real wastewater samples and the results showed high quantity of volatile fatty acids in raw and mechanically treated wastewater and low values such as 0.05 mg/L of acids in treated wastewater which were quantifiable. Hence, this developed can be applicable in the monitoring of wastewater treatment plants.
VII. References:
1. M. Abalos, J.M. Bayona, Application of gas chromatography coupled to chemical ionisation mass spectrometry following headspace solid-phase micro extraction for the determination of free volatile fatty acids in aqueous samples, J.
Chromatogr. A, 891 (2000) 287–294.
2. B. Zygmunt and A. Banel; GC-FID determination of C2-C4 aliphatic
monocaarboxylic acids in aqueous samples preceded by solvent extraction; Chem.
Anal. 54, 339 (2009).
3. L. Feng, Y. Huang and H. Wang; Solid-Phase Micro extraction in combination with GC-FID for quantification of the volatile free fatty acids in wastewater from constructed wetlands; J. Chromatogra. Sc., vol. 46 (2008).
4. Y. Chen, A.A. Randall and T. McCue; The efficiency of enhanced biological phosphorus removal from real wastewater affected by different ratios of acetic to propionic acid; Water Res. 38: 27-36 (2004).
5. A. M. Eilersen, M. Henze and L. Kloft; Effect of volatile fatty acids and trimethyleamine on nitrification in activated sludge; Water Res. 28: 1329-26 (1994).
6. T. Takai, A. Hirata, K. Yamauchi and Y. Inamori; Effects of temperature and volatile fatty acids on nitrification-denitrification activity in small-scale anerobic-aerobic recirculation biofilm process; Water Sci. Technol. 35: 101-108 (1997).
7. L. Pan and J. Pawliszyn; Derivatization/Solid-phase micro extraction: New approach to polar analytes; Anal Chem. 196-205 (1997), 69.
8. H. Proaen, L. Zupancic-Kralj; Solid-Phase Micro extraction; Trends Anal. Chem., vol. 18. No. 4, (1999).
9. B. Muik, B. Lendl, A. Molina-Diaz and M. J. Ayora-Canada; Direct, reagent-free determination of free fatty acid content in olive oil and olives by Fourier transform Raman spectrometry; Anal. Chim. Acta. 487: 211-20 (2003).
10. A. Kotani, F. Kusu and K. Takamura; New electrochemical detection method in high-performance liquid chromatography for determining free fatty acids; Anal.
Chim. Acta. 465: 199-206 (2002).
11. Supelco, 1998 Sigma Aldrich Co.
12. L. Pan, M. Adams and J. Pawliszyn; Determination of fatty acids using solid phase micro-extraction, Anal Chem. (1995), 67, 4396-4403.
13. L. Pan, J. Michael Chong, J. Pawliszyn; Determination of amines in air and water using derivatization combined with solid-phase micro extraction; J. Chromatogr.
A, 773 (1997) 249-260.
14. Design of automated solid-phase micro-extraction for trace analysis of organic compounds in aqueous samples; Ralf Eisert, Janusz Pawliszyn; J. Chromatogr. A, 776, (1997) 293-303.
15. M. Liang Bao, F. Pantani, O. Griffini, D. Burrini, D. Santianni and K. Barbieri; Determination of carbonyl compounds in water by derivatization- solid-phase micro extraction and gas chromatographic analysis; J. Chromatogr. A, 809 (1998) 75-87.
16. M.N. Sarrion. F.J Santos, M.T. Galceran; Strategies for the analysis of chlorobenzenes in soils using solid-phase micro extraction coupled with gas chromatography- ion trap mass spectrometry; J. Chromatogr. A 819 (1998) 197-209.
17. K. Takekawa, M. Oya, A. Kido and O. Suzuki; Analysis of Cyanide in blood by Headspace Solid-Phase Micro extraction (SPME) and Capillary Gas Chromatography; Chromatographia Vol.47, No. ¾, February (1998).
18. A. Penalver, E. Pocurull, F. Borrull, R. M. Marce; Trends in solid-phase micro-extraction for the determining organic pollutants in environmental samples;
Trends Anal. Chem., vol. 18, no. 8, (1999).
19. E. E. Stanshenko, J. R. Martinez; Sampling volatile compounds from natural products with headspace/ solid-phase micro-extraction; J. Biochem Biophysics. Methods 70 (2007) 235-242.
20. F. Mangani , R, Cenciarini; Solid Phase Micro extraction using fused silica fibres coated with Graphitized Carbon Black; Chromatographia Vol. 41, no. 11/12, December (1995).
21. Y. Liu and M. L. Lee, K. J. Hageman, Y. Yang, and S. B. Hawthorne; Solid-Phase Microextraction of PAHs from Aqueous Samples Using Fibers Coated with HPLC Chemically Bonded Silica Stationary Phases; Anal. Chem. (1997), 69, 5001-5005.
22. T. Górecki, X. Yu and J. Pawliszyn; Theory of analyte extraction by selected porous polymer SPME fibres; Analyst, (1999), 124, 643–649.
23. P. L. Zhu, C. L. Liu, M. C. Liu; Solid-phase microextraction from small volumes of sample in a glass capillary; J. Chromatogr. A, 988 (2003) 25–32.
24. SUPELCO Bulletin 923.
25. Manufacturer Data Sheet, Supelco, Bellefonte, PA, (1998).
26. C.L. Arthur, L. Killam, K. Buchholz, J. Pawliszyn; Automation and optimization of solid phase micro extraction; Anal. Chem. 64 1960 (1992).
27. D.W. Potter, J. Pawliszyn, Rapid determination of polyaromatic hydrocarbons and polychlorinated biphenyls in water using solid-phase microextraction and GC/MS;
J. Environ. Sci. Technol. 28 (1994) 298.
28. M. Llompart, K. Li, M. Fngas,Phase Microextraction and Headspace Solid-Phase Microextraction for the Determination of Polychlorinated Biphenyls in Water Samples; Anal. Chem. 70 (1998) 2510.
29. K.D. Buchholz, J. Pawliszyn, Optimization of solid-phase microextraction conditions for determination of phenols; Anal. Chem. 66 (1994) 160.
30. S. Magdic, A. Boyd-Boland, K. Jinno, J. Pawliszyn; Analysis of organophosphorus insecticides from environmental samples using solid-phase micro extraction; J. Chromatogr. A 736 (1996) 219.
31. A. Boyd-Boland, J. Pawliszyn; Solid phase micro extraction of nitrogen containing herbicides; J. Chromatogr. A 704 (1995) 163.
32. Z. Wang, C. Xiao, C. Wu and H. Han; High performance polyethylene glycol-coated solid phase micro extraction fibres using sol-gel technology; J.
Chromatogr. A, 893 (2000) 157–168.
33. P. Kurán and L. Soják , Mlynská Dolina Environmental analysis of volatile organic compounds in water and sediment by gas chromatography; J. Chromatogr
A, 733 (1996) 119-141.
34. W. Wardencki, J. Curylo and J. Namiesnik; Trends in solventless sample preparation techniques for environmental analysis; J. Biochem. Biophys. Methods 70 (2007) 275–288.
35. M. Abalos, J. M. Bayona and J. Pawliszyn; Development of a headspace solid-phase micro extraction procedure for the determination of free volatile fatty acids in waste waters; J. Chromatogr. A. 873, 101-115 (2000).
36. D. Wei Lou, X. Lee and J. Pawliszyn; Extraction of foric and acetic acids from aqueous solution by dynamic headspace-needle trap extraction temperature and pH optimization; J. Chromatogr. A, 1201, 228-234 (2008).
37. R. G. C. Silva and F. Augusto; Highly porous solid-phase micro extraction fibre coating based on poly(ethylene glycol)-modified ormosils synthesized by sol-gel technology; J. Chromatogr. A, 1072, 7-12 (2005).
38. Gy. Wittmann, H. V. Langenhove and J. Dewulf; Determination of acetic acid in aqueous samples, by water-phase derivatisation, solid-phase micro extraction and gas chromatography; J. Chromatogr. A. 874, 225-234 (2000).
39. P. Campo, G. A. Sorial, M. T. Suidan and A. D. Venosa; Statistical evaluation of an analytical GC/MS method for the determination of long chain fatty acids;
Talanta 68, 888-894 (2006).
40. K. S. Docherty and P. J. Ziemann; On-line, inlet-based trimethylsilyl derivatisation for gas chromatography of mono- and dicarboxylic acids; J. Chromatogr. A, 921, 265-275 (2001).
41. V. Ferreira, A. Rapp, J. F. Cacho, H. Haastrich, I. Yavas; Fast and quantitative determination of wine flavour compounds using micro extraction with Freon 113;
J. Agric. Food Chem. 41, 1413-1420 (1993).
42. Sigma Aldrich Co.; Solid phase micro extraction: Solventless sample preparation for monitoring flavour compounds by capillary gas chromatography; Bulletin 869A (1998).
43. S. C. Dieguez, L. D. Diaz, M. L. G. De La Pena, E. F. Gomez; Variation of volatile organic acids in spirits during storage at low and room temperatures;
44. M. Liu, Z. Zeng, Y. Tian; Elimination of matrix effects for headspace solid phase micro extraction of important volatile compounds in red wine using novel coating;