Catherine Claire Cushenan
nº 56412Validating the use of baited remote underwater video
(BRUV) and unmanned aerial vehicles (UAV’s) in assessing
the abundance of pelagic sharks in shallow tropical waters
in Cocos (Keeling) Island
Catherine Claire Cushenan
nº 56412Validating the use of baited remote underwater video
(BRUV) and unmanned aerial vehicles (UAV’s) in
assessing the abundance of pelagic sharks in shallow
tropical waters in Cocos (Keeling) Island
Trabalho efetuado sob a orientação de:
Dr. Karim Erzini, Prof. Euan Harvey
Declaraçao de autoria de trabalho
This study was conducted in conjunction with Professor Euan Harvey of Curtin University of Technology, which provided the required equipment and facilities based in Perth, Western Australia and the Cocos (Keeling) Islands. I, Catherine Claire Cushenan, aluno no. 56412, declare that this thesis is entirely my own writing and no plagiarism has been used
throughout the project throughout its’ duration from October 10th, 2017 to September 28th, 2018.
Declaro ser a autora deste trabalho que foi feito com base em pesquisa e estudos da minha autoria. Os autores e trabalhos consultados para a elaboração do mesmo foram devidamente citados ao longo do texto e constam no índex de referências incluída.
Catherine Claire Cushenan
Author
iv
A Universidade do Algarve reserva-se ao direito, em conformidade com o apresentado no Código do Direito de Autor e dos Direitos Conexos, de arquivar, reproduzir e publicar a obra, independentemente do meio utilizado, bem como de a divulgar através de relatórios científicos e de admitir a sua cópia e distribuição para fins meramente educacionais ou de investigação e não comerciais, desde que seja dado o devido crédito ao autor e editor respetivos.
Abstract
This study investigates the reliability and accuracy of elasmobranch abundance data collected using baited remote underwater video (BRUV) surveys and unmanned aerial vehicle (UAV) surveys, and shark interaction with equipment in the Cocos (Keeling) Islands, a remote territory of
Australia. The primary aim of the study was to provide insight into strengths and drawbacks of both BRUV and UAV techniques in the study of large pelagic elasmobranchs in shallow tropical ecosystems and to clarify elasmobranch interaction with underwater apparatus. Aerial and
underwater surveys were conducted simultaneously, with the underwater component rotating between use of bait, BRUV and no stimuli between each survey, while a Phantom 4 DJI drone hovered directly above study site. The difference between BRUV and bait-only surveys was not significant overall. The drone, the BRUV and the bait recorded similar enough data that our analysis could not detect a noticeable difference and both were deemed capable tools in shallow water shark research.
Key words unmanned aerial survey, baited remote underwater video,
abundance, diversity, comparison
Este estudo investiga a precisão e rigor da abundância da amostra de elasmobrânquios analisada através de pesquisa utilizando câmeras submarinas controladas remotamente (BRUV), bem como um dispositivo voador não tripulado (UAV), e captar a interação das espécies com o equipamento aquático. O objetivo do estudo foi produzir conjuntos de informação idêntica de forma a comparar e determinar a variação de cálculos entre ambas as metodologias usadas. O principal objectivo foi entender os pontos fortes e fracos de ambas as técnicas usadas, BRUV e UAV, no estudo de grandes elasmobrânquios pelágicos em ecossistemas tropicais de pouca profundidade, assim como, clarificar a interação entre os
vi
O BRUV (que literalmente se traduz em ‘Sistema de câmaras de vídeo submarino iscadas’) é um método muito usado para estudar o ambiente subaquático, uma vez que gera grandes benefícios em relação às pesquisas operadas por mergulhadores. A razão por detrás disso é que a tecnologia pode capturar espécies tímidas ou enigmáticas que podem evitar o tipo de levantamento anterior e, portanto, não são vistas e estão sub-representadas nos estudos marinhos. Tem sido um método confiável durante um longo período de tempo. O drone, objecto voador não tripulado, é uma introdução mais recente, pioneira em silvicultura e agricultura, na qual câmeras aéreas não tripuladas podem voar sobre paisagens para obter o ponto de vista de um pássaro e recolher dados dessa maneira. Embora, em terra, os drones sejam considerados disruptivos, as espécies submersas comprovadamente não são afetadas pela introdução de um drone no seu ambiente, o que dá margem ao potencial de estudos imparciais. No entanto, antes que possam começar, é crucial fazer uma comparação entre este novo método e um método antigo e confiável para realmente confirmar que os drones têm potencial não apenas como um método imparcial, mas também preciso para captar a abundância subaquática e até mesmo traços comportamentais. Este estudo revelou várias informações importantes relativas às capacidades de ambas as tecnologias usadas aqui; ou seja, os métodos BRUV e UAV. Essencialmente, o projeto confirmou que ambos realizam um nível altamente satisfatório quando usados em várias configurações, produzindo simultaneamente resultados estatisticos semelhantes. Isso é positivo por várias razões, confirma que o uso de BRUV em estudos anteriores é justificado, mas também abre a porta para que a tecnologia de drones se torne um componente significativo de estudos futuros. Este estudo pode até revelar o benefício de usar ambos os métodos lado a lado de uma maneira altamente complementar pois ambos capturam os mesmos valores de abundância quando usados no mesmo contexto, capturando diferentes aspectos e características dos ambientes bióticos e abióticos que cercam as espécies de estudo. Por exemplo, os drones são usados para detectar
tubarões de forma a proteger surfistas em áreas costeiras, portanto, este estudo é positivo para o público e para a comunidade científica.
Usar drones em estudos, é uma nova maneira de perceber o ambiente marinho. Enquanto os mamíferos, que respiram à superfície, provaram repetidas vezes que são perfeitamente adequados aos estudos aéreos, este estudo aborda os parâmetros de pesquisa de animais com uma estrutura comportamental diferente: os elasmobrânquios pelágicos que habitam em
águas de pouca profundidade. O objetivo era perceber como os
elasmobrânquios poderiam ser beneficiados pela introdução da ciência
aérea, se for o caso.
O estudo foi realizado nas Ilhas Cocos (Keeling), que são um território remoto da Austrália, a Noroeste de Perth, onde os tubarões nunca foram caçados e, portanto, existem em grande abundância. A água fornece condições perfeitas para as comparações a serem estudadas, uma vez que é consistentemente superficial e clara com uma variedade de substratos para fornecer uma gama de habitats para comparações. No CKI, foram realizados estudos aéreos e subaquáticos, nos quais a isca foi colocada na água para observar a atracção de tubarões no campo de visão de cada câmera: a câmera aérea, voando a 20m com um campo de visão extremamente amplo; ou a câmera subaquática, com alta precisão e resolução, mas um campo de visão relativamente menor.
Os métodos e materiais são descritos na tese em inglês. Para resumir, o drone deveria ser voado três vezes em cada trajecto, para ser referido como "antes, durante e depois". Antes do voo do segundo sector, um BRUV, ou uma bolsa de isca de rede, seria colocado na água directamente abaixo do local onde o drone pairaria. Desta forma, duas configurações idênticas estavam a ser gravadas simultaneamente para apresentar conjuntos de dados directamente comparáveis. A razão para implantar BRUV e isca em ocasiões separadas foi para investigar a resposta dos sujeitos do estudo (os
viii
rapidamente, comparada à BRUV, um grande dispositivo de aço com duas câmeras incluídas. O objetivo aqui foi entender se os elasmobrânquios exibem comportamento de evitação em direção ao equipamento subaquático que poderia causar desvios nos estudos de BRUV.
Naturalmente, ambas as técnicas de estudo envolveram uma série de pontos fortes e fracos que vão desde o custo-benefício, duração da bateria até a capacidade real de capturar espécies-alvo em cima de indivíduos não-alvo. O objetivo da análise era entender o significado desses resultados para, então, perceber se um dos métodos era superior ou, na verdade, complementar e começar a entender as limitações do levantamento aéreo. Nós consideramos os resultados muito semelhantes, com várias observações separadas e diferenças no somatório de abundância ao longo do tempo, o que sugere que os dois podem ser emparelhados para melhorar o poder estatístico de estudos futuros.
Embora as descobertas do estudo preparem o caminho para o desenvolvimento de outras questões e o exame de cada método, os parâmetros do estudo foram bastante amplos. Embora esse tenha sido o objetivo da tese, agora ele deve ser desenvolvido usando comparações mais específicas e, o mais importante, um conjunto maior de dados para melhorar o poder estatístico e reduzir o efeito de anomalias nos resultados gerais.
Como esperávamos, aprendemos que ambos os métodos apresentam uma maneira cientificamente sólida de medir a abundância de nossos elasmobrânquios alvo, ao mesmo tempo em que obtemos insights sobre as melhores metodologias para realizar futuros estudos aéreos de forma a obter os resultados mais consistentes.
Acknowledgements
To everyone in my life who is more intelligent than me and without whom I probably could not have written a full sentence of this thesis. To Mel, my survey monkey and Jarrad, my emotional support and Map Magician. To Annika, queen of statistics and more importantly, patience. To Ambre, for reading through my writing in her second language and still pointing out more errors than the average Brit. To Débora, for using her first language to spellcheck my amateur Portuguese. To Erica, for taking me on as a research assistant to train and help decide the best way to run this study. Most importantly, to Euan, Craig and Dieter for keeping me alive on the islands and
supporting, sponsoring and encouraging my work from the very beginning. You’re all good eggs.
Table of Contents
Declaraçao de autoria de trabalho ... iii
Abstract ... v
Acknowledgements ... ix
Table of Contents ... xi
List of Figures ... 13
List of abbreviations ... 14
Comparing and contrasting the capabilities of UAVs and BRUVs in situ ... 15
1.1 Introduction ... 15
1.1.1 Baited Remote Underwater Video Surveys ... 15
1.1.2 Unmanned Aerial Vehicle Surveys ... 17
1.2 Methods & Materials ... 18
1.2.1 Study location: Cocos (Keeling) Islands ... 18
1.2.2 Sampling design ... 20
1.2.3 Baited remote underwater apparatus ... 21
1.2.4 Unmanned aerial vehicle (UAV) surveys ... 22
1.2.5 Video analysis ... 23
1.2.6 Data analysis ... 24
1.3 Results ... 25
1.3.1 Comparing BRUV surveys to UAV with limited FOV. ... 26
1.3.2 Comparing BRUV to UAV raw and normalized data. ... 26
1.3.3 Comparison of increase in abundance between UAV and BRUV ... 27
1.3.4 Comparing BRUV to bait-only surveys using aerial data. ... 28
1.3.5 Comparison of increase in abundance between BRUV and bait-only ... 29
1.4 Discussion ... 30
1.5 Conclusions ... 34
References ... 37
APPENDICES 45 Appendix A Deployment times for surveys ... 47
List of Figures
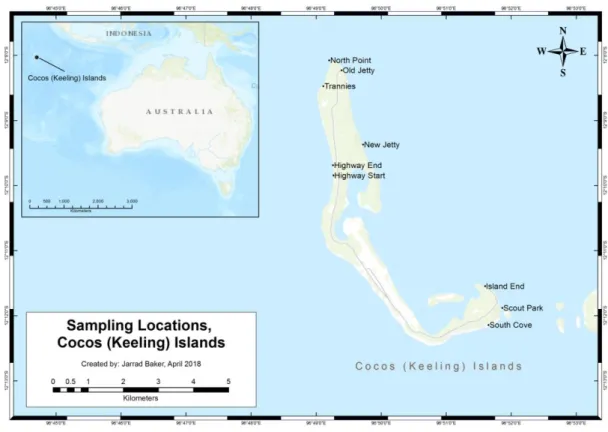
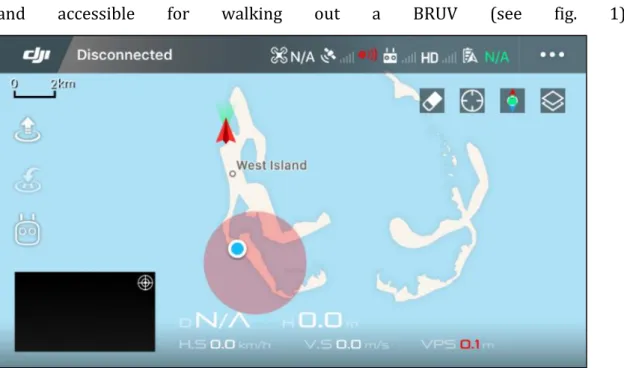
Figure 1 Map depicting location of CKI in relation to Australia (left) and aerial view of the islands (right). Annotations show the nine selected study sites. .... 19 Figure 2: A screenshot taken from the DJI Go4 App of the Cocos (Keeling) Islands. The
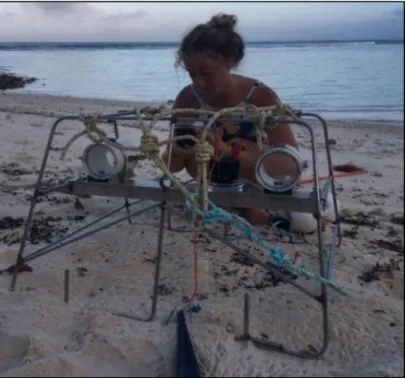
red circle depicts the restricted flight area surrounding the airport, and blue dot depicts my location at time of screenshot. ... 20 Figure 3: Placing the cameras into the waterproof housings before deployment. BRUV
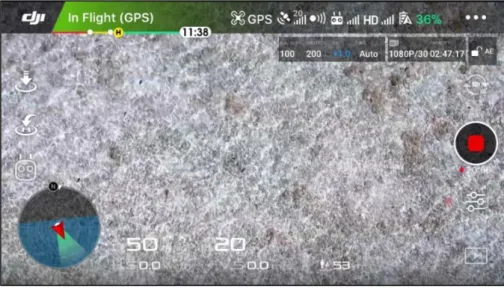
consists of steel frame and waterproof housings for two GoPros stationed at specific angles to permit size identifications of relevant species. ... 22 Figure 4: A screenshot taken from the DJI Go4 App of a study site during a survey. The
50 in the bottom to the left, indicates distance of the drone from the remote controller. The figure next to it, 20, depicts the height of the drone. .. 23 Figure 5: A representation of the field of view used in the comparison from a birds eye
perspectives: left, BRUV and right, UAV (above) and the actual footage that will be produced of BRUV (left) vs UAV (below) ... 24 Figure 6: Box plots of average Max N's over deployment for drone, with and without
normalising data, and for BRUV. N indicates total number of counts within all deployments. Outliers are indicated by dots. ... 27 Figure 9: Increase in abundance over time of BRUV and UAV, and with UAV when data
is normalised for clearer comparison ... 28 Figure 7: Total Max N comparison throughout all data collection in presence and
absence of BRUV mechanism recorded before, during and after the initial introduction of underwater survey into study site. Each segment represents twenty-four minutes. P: prior to deployment, D: during and A: after. 29 Figure 8: Linear regression of increase in abundance over time between BRUV and
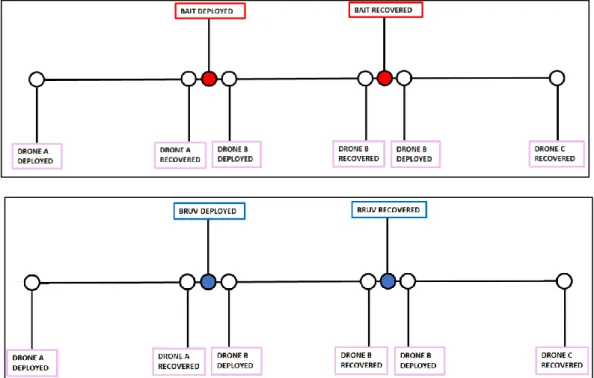
baited surveys ... 30 Figure 10 Time scale of deployments for Drone A, B and C and bait only (above) and
BRUV (below). BRUV or bait will be deployed prior to the second aerial survey and recovered between the second and third airborne surveys.47
14
List of abbreviations
Abbreviation Explanation
BRUV Baited Remote Underwater Video
CKI Cocos (Keeling) Islands
FOV Field of View
UAV Unmanned Aerial Vehicle
Max N The maximum number of individuals of one species seen in one frame during a survey period
Comparing and contrasting the capabilities of UAVs and
BRUVs in situ
1.1
Introduction
One of the most important aspects to consider in designing any reliable ecological study is the selection of equipment and sampling methods that will provide appropriate data to answer the questions raised, pertaining to the focal study species (Rotherham et al. 2007). Every marine research technique has both strengths and drawbacks, discussed over many years, in an attempt to uncover a mechanism able to accurately describe the biodiversity of marine habitats without bias (Willis 2001). Due, primarily, to the relative inaccessibility of underwater ecosystems and the altered behaviour of fish in the presence of most study mechanisms, there is a consistent push to identify a survey type which can encompass the ability to account for species in a time efficient and cost-effective manner. New concepts are constantly being tried and tested (e.g. Bosch et al., 2017; Prato et al., 2017). Here, we ask if aerial surveys may be an important next step in scientific progression of pelagic shark estimates in shallow, tropical ecosystems.
1.1.1
Baited Remote Underwater Video Surveys
Since the dawn of hydrophilic camera technology, underwater imaging has become increasingly relied upon to study the marine environment in situ, for example in measuring fish and invertebrate abundance as deep as hydrothermal vents (Consalvey et al., 2016); exploring predator-prey relationships (Kruschel et al., 2016); examining behavioural patterns and movement ecology (Andradi-Brown et al., 2016) or facilitating the discovery of new marine species (Rogers et al., 2012). Underwater imaging was primarily pioneered in deep- ocean research (Bailey et al., 2007). Now, submersible studies are becoming the norm, with baited remote underwater video surveys (BRUVs) considered indispensable for detecting cautious
16
The BRUV systems use a camera(s) set within a protective, stabilising steel or aluminium frame and a selection of bait in a mesh bag or cannister held in the field of view of the camera, stationed in one position for the duration of a survey. The design often varies in its configurations, with regards to the angle the camera faces, and the number of cameras used. Bait is decided according to the target species for each study, with the aim to attract said species into the field of vision of the cameras. Species indifferent to the plume will also enter the field of view by chance (Cundy et al., 2017).
The baited technology is one of the most widely used methods in behavioural studies, examining the effect of various stimuli on teleost assemblages and permitting a greater understanding of shark fidelity, site restriction and residency (Broad et al., 2010). The baited camera systems can record detailed, fine-scale predator- prey and conspecific interactions and short-term personality, sociability and mating behaviours: all information which can be crucial in successful management and conservation (Letessier et al., 2016).
The immobile BRUV setup faces the challenge of attracting target species into the field of view to be counted, which can prove difficult and lead to potentially biased results when species are artificially drawn in. The strength of the study is also highly dependent on the visibility at the time of survey and therefore the distance that an individual will need to approach to be sighted on the survey. Another downside is the length of time, in both preparation and survey length, required to obtain reliable results (Ventura et al., 2016)
In many cases, the time- consuming aspect of the technique is outweighed by the benefits, of which the ability to photo-capture diver-shy species is a large contributor. Sharks can often show behavioural bias in surveys involving divers, which the remote technology is able to avoid (Andradi- Brown et al., 2017). Now, the introduction of low-cost aerial surveys could provide a modern method by which we can study the underwater environment with the same, or augmented, ability to obtain data regarding evasive species (Fiori et al., 2017).
1.1.2
Unmanned Aerial Vehicle Surveys
Drone surveys are one of the most recent methodologies introduced to the marine research field, in response to the expanding capabilities of remote aerial flight (Wich et al., 2016). This has resulted in a considerable rise in drone usage for studying abundance, distribution and behaviour of wildlife in both marine and terrestrial ecosystems (Barrell, 2016, Christie et al. 2016). Aerial surveys proved to be a useful tool in quantification of animal density and visually assessing human impact on terrestrial ecosystems. The wide field of vision from a bird’s eye point of view provides a unique advantage (Ratcliffe et al., 2013).
Video sampling using any form of camera has seen a steep increase, correlating strongly with a dramatic reduction in the average camera size and cost (Struthers et al. 2015), to which drones are no exception. Aerial studies performed with aircrafts had previously been dismissed as a reliable, yet cost ineffective, means of measuring abundance of larger species (Ornes, 2014). Today, non- commercial unmanned aerial vehicles (UAVs) can fly for up to 30 minutes with ranges of 3-7km, model dependent (Lennertz, 2018), thus offering a similar methodology at a notably lower cost, especially when compared to boat-based surveys, which must consider costs of fuel and manpower for each survey performed. In long-term and large-scale surveys, the cost of producing additional replicates is a key factor to take into account (Bosch et al., 2017). Concerning this, drones are highly efficient.
With the BRUV and aerial surveys being and becoming, respectively, such widely used methods in understanding the marine environment, the comparison of techniques against one another is a logical step to take. Aerial surveys are considered one of the first techniques that can convincingly produce unbiased results in marine research, which provides the unique opportunity to study other aspects of marine interactions as controls (Kiszka et al., 2016) and thus develop conclusive theories on the behaviour of study subjects relevant to surrounding stimuli.
18
conducted. The overarching goal of this research is to investigate data estimates of pelagic elasmobranchs made using both aerial and BRUV surveys in shallow water ecosystems. This involved collecting abundance data on sharks in the Cocos (Keeling) Islands.
Determining efficient protocols is a crucial step that needs to be taken in the field of marine aerial surveys. The primary aim is to address how the exclusive traits of the UAV and BRUVs influence the accuracy of the study. The secondary aim is to study how these traits affect the study subjects, therefore examining the effect of the BRUV apparatus on the behaviour of sharks over the period of the study, and the use of a drone in studying movement ecology.
The specific goal here was to utilise the wide field of view of the UAV to understand how accurately the BRUV cameras capture cartilaginous species, then to reverse the question to use the high resolution of BRUV footage to interpret the potential of the drone resolution in determining abundance.
1.2
Methods & Materials
1.2.1
Study location: Cocos (Keeling) Islands
Data collection was conducted between December 14, 2017 and February 13, 2018 in the Cocos (Keeling) Islands (CKI), 12° 10’ S, 96°50’ E; a remote Australian territory 2750km northwest of Perth, consisting of 27 coral islands over a total land mass of 166.2km². The area consists of subtidal outer reefs, intertidal reef flats and subtidal lagoons (Berry, 1989).
Figure 1 Map depicting location of CKI in relation to Australia (left) and aerial view of the islands (right). Annotations show the nine selected study sites.
CKI have never hosted commercial fishing, and therefore shark populations are healthy, and overall fish abundance and diversity is high. The reefs are relatively pristine and provide extensive habitats to a vast number of species, elevating the health status of the area when compared to ecosystems with otherwise similar potential (Evans et al., 2016).
The islands are influenced by the southeast trade winds, with a reduction in wind strength around December to February, around the Doldrums. The study was conducted during these dates, to increase the likelihood of successful flights. In any UAV study, it is important to consider the flight restrictions of the surrounding area. For CKI, there is an aerial ban spread at a two-kilometre radius around the airport. Nine study sites were selected on West Island in areas that would not overlap with the restriction. Each site was fifty metres from the shore
20
and accessible for walking out a BRUV (see fig. 1).
Figure 2: A screenshot taken from the DJI Go4 App of the Cocos (Keeling) Islands. The red circle depicts the restricted flight area surrounding the airport, and blue dot depicts my location at time of screenshot.
1.2.2
Sampling design
The two focal questions being asked are complimentary, enabling the collection of one set of results, used to answer both questions by later extracting the data in different ways.
As aforementioned, the two components of this study are baited remote underwater video (or a control) and unmanned aerial vehicles, used simultaneously to generate directly comparable results. Aerial flights were conducted in sets of three, essentially the ‘before’, ‘during’, and ‘after’ surveys relevant to the BRUV deployments. These were flown as follows: first, before deployment of BRUV or control; during the deployment, and once the underwater equipment had been brought back to shore.
To allow for the highest quality of aerial data, surveys were conducted between 0600h and 0900h, and 1500h and 1800h, while backscattering of sunlight was at its’ lowest. Studies were conducted twice daily as weather conditions permitted, over 60 sampling days.
For every deployment, a series of environmental data was recorded, pertaining to both the wind and current speed and direction; cloud cover; air and water temperature and tide state at time of deployment. This allowed us to take into consideration the effect the biotic factors may have on study subjects and explain any resulting anomalies or conflicts in data produced by using a current meter to record strength and direction of current throughout any given survey..
1.2.3
Baited remote underwater apparatus
One BRUV system was used throughout the study, designed in accordance with the specifications set by Harvey et al., (2007). Two GoPro Hero 3 cameras were set 0.7m apart on a base bar at 1.2m from a suspended bait bag, comprised of 1kg of mashed pilchard (Sardinops sagax). The cameras were set to allow a 10m field of view (Harvey and Shortis 1996), with video quality recording at 1080fps. Stereo BRUV surveys were set for thirty minutes. The system was walked out and deployed 50m from the shoreline and placed with the bait arm facing away from land.
On alternating days, a control was used, whereby only the bait arm was placed in situ for the allotted 30 minutes. A minimum of two repeats of both BRUV and bait-only surveys were collected at each site throughout the study. The BRUV or controls were always deployed in shallow water of <1.5m depth, within 50m of the coast, and substrate type was recorded (sandy, coral or algal).
The ‘bait-only’ control, consisted of a bait mesh bag identical to that of the deployed BRUV mesh bag; filled with of 1kg of mashed pilchard, and was accompanied by a 2kg weight to hold the bait in place.
The underwater apparatus hosted the addition of a current meter to determine the direction and strength of plume dispersal in both the BRUV and bait-only surveys. Approach direction for each shark that appeared on aerial surveys was also recorded and calibrated according to the direction of the current.
22
Figure 3: Placing the cameras into the waterproof housings before deployment. BRUV consists of steel frame and waterproof housings for two GoPros stationed converging inwardly at 10 degrees, 0.8m apart to permit size identifications of relevant species.
1.2.4
Unmanned aerial vehicle (UAV) surveys
Aerial flights were conducted using a DJI Phantom 4 (83x 83x198mm, weight 1338g) which uses a LiPo3S battery and an internal camera of 4K resolution. The drone is not waterproof. Battery life is 27 minutes with maximum flight speed of 15m/s and a maximum range of 7km in no wind. Flights were recorded in 4K resolution at 60Mbps using a SandMarc polarizing filter to reduce glare for footage analysis. The drone was set in a stationary hover, to improve overall resolution of footage. The internal camera is capable of shooting in photo and video mode. In this case, video mode was used to ensure footage would be comparable to BRUV video footage. Surveys were aborted in headwinds greater than 11kmph and in any instance of rain.
Each UAV flight was set to hover at 20m above the chosen site. This height provided a 20m x 35m field of vision, enabling adequate spatial coverage without sacrificing the resolution of photos, ultimately facilitating the identification of captured individuals.
The drone was flown a total of three times during each trial and was set to hover for 24-minutes. As BRUV was deployed before aerial survey, and removed after landings, this resulted in a 30-minute BRUV deployment during the time of the second aerial survey. Total study time was 85 minutes, carried out as follows. At t-0, the first drone survey was flown to the selected spot, which was saved in ‘Waypoints’ using the DJI Go Smartphone app, so the exact same point could be used each time in survey repeats. The UAV was set to fly on the spot for 24-minutes. Upon landing, the battery was replaced, while the BRUV system was deployed. A five-minute time interval was allowed for this, after which the second aerial survey was flown to record another 24-minute segment. Once this landed, again, the battery was replaced, and another five-minute time interval was used to recover the BRUV. Finally, the third 24-minute survey set off to record movements following the removal of the baited stimulus. Appendix 1 can be referred to for a timeline of each survey.
Figure 4: A screenshot taken from the DJI Go4 App of a study site during a survey. The 50 in the bottom to the left, indicates distance of the drone from the remote controller. The figure next to it, 20, depicts the height of the drone.
1.2.5
Video analysis
Analysis was divided into two sections, dependent on which question was being answered, and therefore the data being extracted. It was first important to consider how results could provide insight to the quality and reliability of data obtained by
24
Species counts were taken by two independent observers for all recorded footage. To ensure counts were reliable and that all individuals were detected by both observers, the counts had to be identical. Focus was specifically on the max N: the maximum number of individuals captured in one video frame at one time.
In each case, BRUV footage was calibrated by discarding the recordings of the first and last three minutes of recording, as these were taken before and after the UAV flight, meaning there is no comparable data. Two identical time frames were created, from different viewpoints. The 24-minute videos were divided into six segments of four-minute recordings. The Max N in a single frame was taken for each survey for each resulting segment, leading to six Max N estimates per survey. Each UAV video was handled in the same way: split into six four-minute segments, with Max N recorded for each, to identify accumulation of individuals over time. Drone analysis was then repeated, here only looking at the scope visible on the BRUV, for a direct comparison of resolution and therefore overall quality of data collected by the drone.
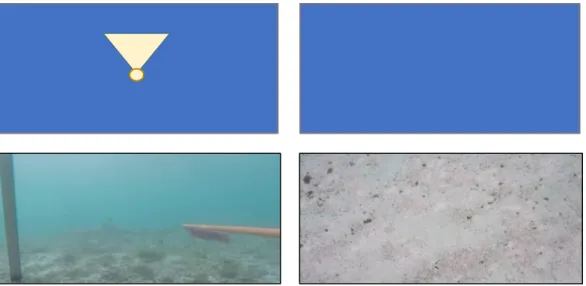
Figure 5: A representation of the field of view used in the comparison from a birds eye
perspectives: left, BRUV and right, UAV (above) and the actual footage that will be produced of BRUV (left) vs UAV (below)
1.2.6
Data analysis
Video analysis provided aerial data of the surveys for before, during and after both BRUV and bait-only deployments, and underwater data for surveys where BRUV
was the in-water component. This meant data analysis was comprised primarily of comparisons between aerial surveys. For this reason, use of the drone itself had to be justified first, leading to the primary statistical analysis. Most analysis required direct comparisons of two related scenarios, so in most cases a paired T-test was used to create an easy-to-comprehend set of results.
To establish that aerial video was capable of visually penetrating the water enough to capture all sharks present in <1.5m of water simply required a paired T-test between the limited field of view (FOV) of aerial data and that of BRUV footage, given that the two data sets are filmed at the same time and results are therefore directly related. As the drone has a much wider FOV and therefore greater potential to capture individuals, aerial data was standardized, whereby the 20x35m (700m²) area was divided to match the estimated 25m2 area of the BRUV. Drone survey Max N was also standardized accordingly.
To compare the change in behaviour of the sharks in the presence of BRUV equipment, the aerial surveys filmed during BRUV deployments were compared to the set of surveys filmed when bait was deployed without the steel structure or camera setups in the water. This again required a simple paired T-test for significant differences for overall Max N of each survey, providing an indication of the relative capabilities of each.
To study the change in abundance over time between the BRUV and both treated and untreated UAV data, a Kruskal-Wallis test accounting for non-parametric data was performed, with a comparison of the three groups simultaneously. Following this, a post-hoc test was performed by using a Bonferroni method Dunn’s test. Total Max N counts for each time segment were grouped to give the tests a stronger statistical power.
1.3
Results
50 aerial surveys were carried out, of which seven endured malfunctions, such as mid-survey abortion due to onset of rainfall and thus recordings cut short. This left twenty-two BRUV surveys and twenty bait-only surveys with accompanying aerial
26
In total, forty-two comparable surveys were carried out, with repeats across nine locations of depth ranging from 0.2m to 1.5m and underwater current strength between 0 (completely still) to 5 (very strong). Only one shark species was captured on either survey type in the study, namely the black tip reef shark (Carcharhinus
melanopterus).
In the aerial survey data set, there is one anomalous set which reached a total Max N of 43. This study site was based at North Point, where the current was consistently extremely strong throughout the survey, following a period of three consecutive days where flights were cancelled due to inclement weather. This anomaly is retained within the data set to assess the ability of each methodology in capturing these behavioural anomalies.
1.3.1
Comparing BRUV surveys to UAV with limited FOV.To confirm data accuracy of aerial survey data, imagery captured inside the BRUV field of view from the drone’s perspective is compared with the BRUV itself. No significance was found between shark counts based on drone limited data and the BRUV itself (two-sided T-test, p = 0.3192, df = 131, t = -1).
1.3.2
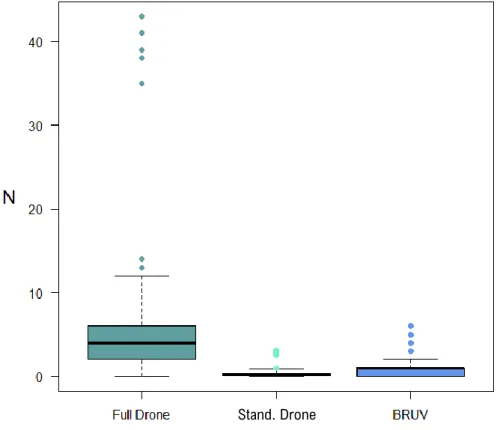
Comparing BRUV to UAV raw and normalized data.Overall statistics drawn by the full capabilities of each methodology were then performed. A total of 43 C. melanopterus were recorded in one frame in full UAV while the same figure for BRUV was 6. Overall comparison between drone full view data and BRUV data revealed a significant difference, demonstrating higher counts using the full view of the drone (two-sided T-test, p < .0001 2.08−12, df = 131, t = 7.764). Drone data was then standardized to account for the much wider FOV to make BRUV and UAV results directly comparable. In this instance, evidence was found indicating a significant difference between both methods (two-sided T-test, p = p < .0001, df = 131, t = -7.25), indicating BRUV Max N to be higher than Max N of normalised drone.
Figure 6: Box plots of average Max N's over deployment for drone, with and without standardised data, and for BRUV. N indicates total number of counts within all deployments. Outliers are indicated by dots.
1.3.3
Comparison of increase in abundance between UAV and BRUVComparison between these three groups shows significance based on a Kruskal-Wallis test accounting for non-parametric data and comparison of 3 groups at the same time (p = 0.0005, df = 2, chi-squared = 15.221). Based on the Dunn’s test, drone full view abundance is significantly different from the drone standardized abundance (p=0.0001). No significant difference was found between drone full view and BRUV estimated abundances (p=0.077) and no significant difference between standardised drone and BRUV estimates (p=0.077).
28
Figure 7: Increase in abundance over time of BRUV and UAV, and with UAV when data is standardised for clearer comparison
1.3.4
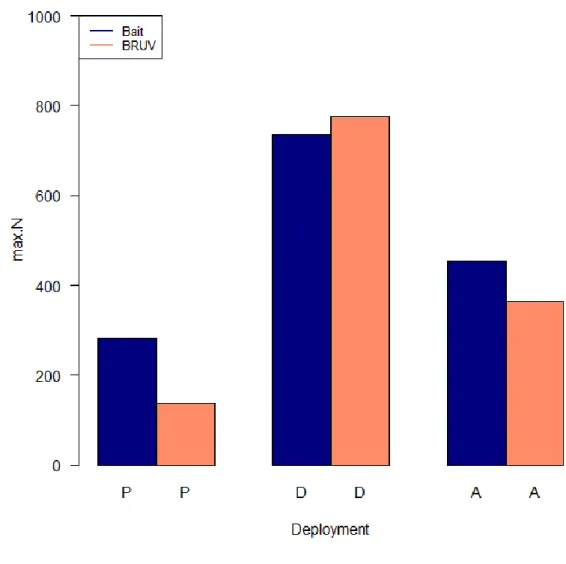
Comparing BRUV to bait-only surveys using aerial data.According to aerial visual analysis, overall Max N during bait-only deployment was not significantly lower in the BRUV setup (7.93 ± 4.39) compared to bait-only deployments (8.43 ± 4.53). Neither yielded a zero count for Max N over the full 24-minute time period, though BRUV did record zeros in a number of the four-24-minute segments. Maximum counts were reached for both methods, bait-only and BRUV, during the deployment of the equipment (N = 735, N= 776; respectively). Measurements for both methods were slightly higher after retrieval than before set up. Lowest counts were obtained for both applications before the equipment was
placed into the water column (N = 283, N = 137; respectively; Fig. 7).
Figure 8: Total Max N comparison throughout all data collection in presence and absence of BRUV mechanism recorded before, during and after the initial introduction of underwater survey into study site. Each segment represents twenty-four minutes. P: prior to deployment, D: during and A: after.
1.3.5
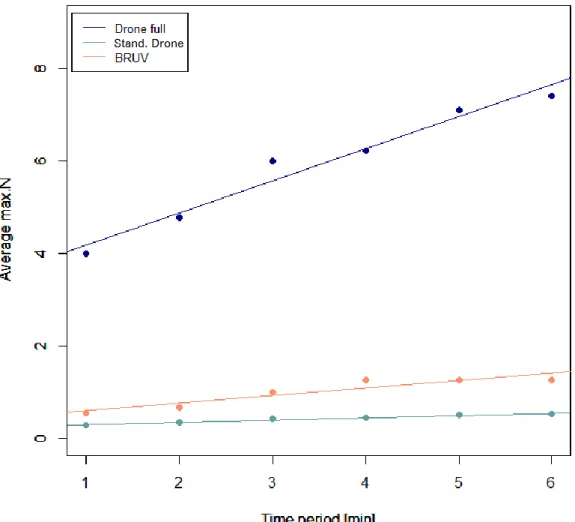
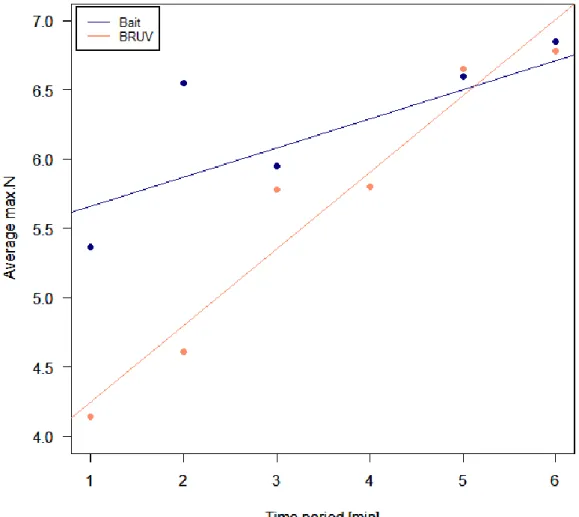
Comparison of increase in abundance between BRUV and bait-onlyAfter a Shapiro-Wilk normality test was used to confirm that results are not normally distributed (P = 0.211), comparison of the average Max N within the different 4 minute time periods demonstrated a faster increase in abundance for BRUV data (slope = 0.553) than for bait-only data (slope = 0.157, Fig. 8). No significant difference was found between both models (Kruskal-Wallis, ꭓ2 = 0.778, df = 1, p-value = 0.378).
30
Figure 9: Linear regression of increase in abundance over time between BRUV and baited surveys
1.4
Discussion
With the introduction of any new research method, it is important to perform basic testing with regards to how best surveys should be operated to capture a full scope of the environment and to identify, to a quantifiable level, relevant strengths and drawbacks. The main objective of this study is to provide evidence of the usefulness of UAVs in pelagic shark studies, with an exploratory insight into conditions in which drone studies are feasible, pertaining to the depth, visibility, and wind conditions required to operate a reliable study on a day to day basis.
According to the analysis, there is no significant difference between the data recorded by the UAV and the BRUV when UAV results have been standardised, inferring that the results are statistically similar. In the context of this study, UAV and BRUV are equally likely to capture an individual that moves into the field of
view in an area up to 1.5m in depth. Results confirm that the drone is a capable tool within the context of this study, when taking into consideration the limitations of weather conditions, allowing us to have confidence in further analysis, as has been suggested by similar studies (Hensel & Layman, 2018, Rieucau et al., 2018).
Simply put, in direct comparison with BRUV results, the UAV captures more. However, the most decisive statistic here is that which compares the Max N of the standardised UAV with the BRUV by adapting the area that the UAV records to match the area seen by the BRUV. When results on the drone are standardized in this way, results generated show that BRUV records a significantly higher Max N. Without discussing this, it could be assumed that the BRUV is the stronger methodology for measuring abundance. However, there are several factors to consider regarding this. First and foremost, the standardised results from the UAV were corrected by dividing the original aerial results until the study area was approximately the same as the field of view of the BRUV. This does not account for the fact that the BRUV focuses only on the area in direct proximity of the bait plume. The UAV records individuals that may be unaffected by the bait plume, such as those who are not downstream of the bait itself, where individuals are thus much less likely to occur (Whitmarsh et al., 2018). To generate a truly fair test, a survey with a ‘RUV’ (Remote Underwater Video: an unbaited underwater survey) should be performed, rather than comparing two data sets in which one focuses only on the focal point of attraction and is consequently biased.
The initial questions proposed by this study assess the impact of the introduction of the BRUV into a study environment. The data indicates that there is no significant difference between the impact of the bait being deployed alone, compared to introduction of the BRUV. The difference between BRUV and bait-only surveys was not significant overall. The drone, the BRUV and the bait recorded similar enough data that our analysis could not detect a noticeable difference. The drone does record a wide field of view, so during recordings it could well be that all surveys are capturing the same number of disinterested individuals, and those individuals that are too shy to approach (Whitmarsh et al., 2018). Perhaps with a smaller FOV, findings would be more significant, but here it can be assumed that the steel does
32
It is worth acknowledging that the placement of the BRUV or bait itself in this study would have had an impact on surrounding species. Wading out to place the in-water equipment created a stir in the water, of which the effect on nearby species is unknown (Langlois et al., 2018). This may merit further investigations whereby a less invasive approach is employed to drop the underwater equipment, which could decrease the time over which target species begin to approach bait directly.
Though the overall differences in Max N between the surveys with and without the steel BRUV structure were not significant, the increase over time is quite conspicuous. As seen in the results, difference in slopes for the two over the 24-minute deployment time is not significant. With more repeats, these results may hold greater implication, as there were a few traits that, if significant, would have been extremely telling. While the bait-only survey has an immediate increase within the first four minutes, it is not until the fifth segment where the number of individuals recorded for each survey type reach similar numbers. It is speculated that the sharks in the area may initially be wary of the steel equipment (Harvey et al., 2018), while in the bait-only surveys the individuals instantly recognise the stimuli as an edible food source, therefore resulting in an initial difference. The alien introduction may pique their interest and the bait plume would encourage immediate approach, but only to a certain distance, potentially as animals do not want to undertake unnecessary risk (Bouchet et al., 2018). The drone hovering to afford a 20x35m (700sqm) scope of vision can capture the initial, ‘nervous’ approach of curious elasmobranchs and thus initial Max N is likely to be higher, leading to more consistent Max N over time throughout the study. As individuals come to recognise the BRUV equipment is not a threat, abundance increases
(Acuña-Marrero et al., 2018). More repeats would confirm if this is a likely
explanation.
While there was no significant difference recorded in the increase over time for BRUV and standardised UAV, only the aerial surveys saw at least one individual at any given time segment throughout the surveys, while BRUV yielded zero counts on multiple occasions. The lack of noticeable difference may be overcome if more repeats are carried out to increase the significance of results and identify if the zero counts, or the abundance incline are subtly consistent over long time periods. As
aforementioned, the increase over time may also be noticeable when the concentrated area of the UAV represents an equal amount of bait present in the water. By dividing the results of the aerial surveys, the significance of the bait plume attraction is divided in turn. With equal concentrations of the bait plume throughout the field of view, the normalised UAV results could yield a significantly higher Max N, which is worth studying.
One downside of the BRUV that needs to be acknowledged is the effort required to set up a BRUV survey, the time it takes to accurately calibrate the use of any camera, and the challenge that upgrading equipment presents, e.g. redesigning sturdy housing structures. Accuracy of measurements can vary if cameras are not carefully guarded in rough seas during transport, for example (Langlois et al., 2018). On the other hand, calibration of the DJI UAV requires only two 360-degree rotations (horizontal and vertical) before it is adequately prepared to run a precisely calibrated survey. In terms of ease of use, the drone has the upper hand as a scientific tool.
On the other hand, reasons for cancellation must be considered, along with relative success rate of surveys. Of fifty surveys, six were aborted mid-survey because of unfavourable conditions for the aerial equipment, while only one was cancelled because of underwater conditions. This is already a much higher number, without taking into consideration the days where surveys were cancelled before the survey even began. The goal for this project had been to collect one hundred and twenty surveys, which the inability of the drone to fly in adverse weather rendered impossible. Rain, wind and back-scattering of sunlight are all factors that will result in the abortion of an aerial survey, while the BRUV is sturdier and can perform in much tougher weather conditions. Despite this, there are conditions in which the drone would be a much more feasible methodology. If a study is in shallow, rocky water which is hard to reach by boat or foot, for example, repeat surveys by a drone will likely be more successful than attempting to deploy a BRUV which may not be stable, or deployable at all.
34
alongside shark abundance. Species ID proved unsuitable with the aerial equipment at 20m and in this regard, the spatial resolution of the underwater methodology is far superior. While observers did note passing turtles on several surveys, and the occasional schools of giant trevally or titan triggerfish, on most BRUVs the camera captured species of fish which were only visible on the aerial footage in schools, and even then, were not identifiable to species level. When flying at lower heights, the drone may be capable of identifying these species and a methodology could later be created to utilise the drone in fish abundance, but this would require further tests. Similarly, our present study addresses the capabilities of the aerial imagery in
shallow water. The UAV accurately captured a highly significant portion of sharks
when analysed alone and had a near perfect match with the BRUV in these conditions. However, it is crucial to carry out these comparisons in deeper water to truly understand the potential of the drone as a stand-alone method. While the BRUV can perform in almost any depth of water, if cameras are adequately housed, with primary limitations being light and visibility (Schmid et al., 2017), this aerial evaluation should be drawn on more and carried out in deeper, less calm waters, to learn the depth and turbidity limitations for providing accurate aerial results. BRUV surveys have been widely complimented as excellent tools for behavioural assessments. The aerial surveys may have potential to add an extra dimension here. Individuals on the BRUV recordings primarily spent less than one minute in the FOV. On the other hand, sharks captured by the drone were consistently visible for up to five minutes, permitting elongated time periods of analysis in future studies, which could be of great use.
1.5
Conclusions
It is important to understand that validating a new survey technique will not render the previously used techniques obsolete. Rather, it provides a choice for a researcher to select a method most suited to the research question, conditions and target species in a given study. This study showcases the crucial aspect of assessing one survey method against another.
We can see from this study that drones have several definite advantages to bring to the field of marine research. They are quick and easy to set up with a large field of view to enable wider scale studies. On top of this, they are relatively inexpensive, flexible tools with high accuracy during flight, permitting either hovers, as used in this study, or mobile surveys as the situation demands. Of course, it is also highly beneficial that the aerial studies can be conducted without disturbing target species, thus creating unbiased conditions for research.
For this study in tropical, clear, shallow water, the UAV shows precise results. However, we still have limited knowledge about the capabilities of the technology with regards to depth of penetration. It is unknown how the technology would function in deeper or murky waters. The limited ability of the UAV to fly in adverse weather conditions is also a large downfall. As technology develops, this should be slowly overcome. For example, aerial cameras are already being released that are water-resistant, and in some cases even waterproof altogether, which will naturally increase their abilities, and therefore the feasibility of their use, in all weather conditions.
The data collected in this study provide a positive outlook for both study types, and similarly both data sets would be stronger with a vaster number of supporting data. To concretely confirm our findings, we should develop and conduct studies with greater sampling effort. With the data presented here, we are unable to confirm how the results would apply to all shallow-dwelling elasmobrachs, but in the case of the black-tip reef shark (Carcharhinus melanopterus) in shallow tropical waters, both methods accurately capture those individuals which pass into their field of view. While this study compares the two methodologies, future studies are likely going to greatly benefit by using both survey types as complimentary means of environmental assessments. Both offer unique benefits that can be used to the advantage of one another to improve our understanding of the underwater world when combined, potentially improving the effectiveness of both pelagic and demersal fish assemblage surveys in a variety of habitats.
References
Acuña-Marrero, D., Smith, A. N., Salinas-de-León, P., Harvey, E. S., Pawley, M. D., & Anderson, M. J. (2018). Spatial patterns of distribution and relative abundance of coastal shark species in the Galapagos Marine Reserve. Marine Ecology Progress
Series, 593, 73-95.
Andradi-Brown, D. A., Macaya-Solis, C., Exton, D. A., Gress, E., Wright, G., & Rogers, A. D. (2016). Assessing Caribbean Shallow and Mesophotic Reef Fish Communities Using Baited-Remote Underwater Video (BRUV) and Diver-Operated Video (DOV) Survey Techniques. PloS one, 11, e0168235.
Andradi-Brown, D. A., Gress, E., Laverick, J. H., Monfared, M. A., Rogers, A. D., & Exton, D. A. (2017). Wariness of reef fish to passive diver presence with varying dive gear type across a coral reef depth gradient. Journal of the Marine Biological
Association of the United Kingdom, 1-11.
Andriolo, A., Martins, C. C. A., Engel, M. H., Pizzorno, J. L., Más-Rosa, S., Freitas, A. C., ... & Kinas, P. G. (2006). The first aerial survey to estimate abundance of humpback whales (Megaptera movaeangliae) in the breeding ground off Brazil (Breeding Stock A). Journal of Cetacean Research and Management, 8, 307.
Bailey, D. M., King, N. J., & Priede, I. G. (2007). Cameras and carcasses: historical and current methods for using artificial food falls to study deep-water
animals.Marine Ecology Progress Series,350, 179-191.
Barrell, J. P. (2016). Quantification and spatial analysis of seagrass landscape
structure through the application of aerial and acoustic remote sensing. Doctoral
dissertation, Dalhousie University 54-56.
Evans, S. N., Konzewitsch, N., & Bellchambers, L. M. (2016). An Update of the Department of Fisheries, Western Australia Invertebrate and Reef Health Research and Monitoring at Cocos (Keeling) Islands. Fisheries Research Division,
Western Australian Fisheries and Marine Research Laboratories. 206, 18-23. Berry, P. F. (1989). Survey of the marine fauna of Cocos (Keeling) Islands, Indian
38
Bradley, D., Papastamatiou, Y. P., & Caselle, J. E. (2017). No persistent behavioural effects of SCUBA diving on reef sharks. Marine Ecology Progress Series, 567, 173-184.
Broad, A., Knott, N., Turon, X., & Davis, A. R. (2010). Effects of a shark repulsion device on rocky reef fishes: no shocking outcomes. Marine Ecology Progress Series, 408, 295-298.
Brooks, E. J., Sloman, K. A., Sims, D. W., & Danylchuk, A. J. (2011). Validating the use of baited remote underwater video surveys for assessing the diversity, distribution and abundance of sharks in the Bahamas.Endangered Species Research,13, 231-243.
Britten, G. L., Dowd, M., Minto, C., Ferretti, F., Boero, F., & Lotze, H. K. (2014). Predator decline leads to decreased stability in a coastal fish community. Ecology letters, 17, 1518-1525.
Bond, M. E., Babcock, E. A., Pikitch, E. K., Abercrombie, D. L., Lamb, N. F., & Chapman, D. D. (2012). Reef sharks exhibit site-fidelity and higher relative abundance in marine reserves on the Mesoamerican Barrier Reef. PLoS One, 7, e32983. Bosch, N. E., Gonçalves, J., Erzini, K., & Tuya, F. (2017). “How” and “what” matters:
Sampling method affects biodiversity estimates of reef fishes. Ecology and
evolution, 7, 4891-4906.
Bouchet, P., Meeuwig, J., Huveneers, C., Langlois, T., Letessier, T., Lowry, M., ... & Thompson, C. (2018). Marine Sampling Field Manual for Pelagic Stereo BRUVS
(Baited Remote Underwater Videos). 1, 16-17.
Bouyoucos, I. A., Suski, C. D., Mandelman, J. W., & Brooks, E. J. (2017). The energetic, physiological, and behavioral response of lemon sharks (Negaprion brevirostris) to simulated longline capture. Comparative Biochemistry and Physiology Part A:
Molecular & Integrative Physiology, 207, 65-72.
Burks, C. M., Driggers III, W. B., & Mullin, K. D. (2006). Abundance and distribution of whale sharks (Rhincodon typus) in the northern Gulf of Mexico. Fishery
Bosch, N. E., Gonçalves, J. M., Tuya, F., & Erzini, K. (2017). Marinas as habitats for nearshore fish assemblages: comparative analysis of underwater visual census, baited cameras and fish traps. Scientia Marina. 81, 159- 169.
Carr, I. (2014). Baited remote underwater video survey of macro-invertebrate distribution and abundance across False Bay, South Africa. Journal of
Experimental Marine Biology and Ecology, 324, 18-24.
Christie, K. S., Gilbert, S. L., Brown, C. L., Hatfield, M., & Hanson, L. (2016). Unmanned aircraft systems in wildlife research: current and future applications of a transformative technology. Frontiers in Ecology and the Environment, 14, 241-251.
Clarke, C., Lea, J., & Ormond, R. (2012, July). Comparative abundance of reef sharks in the Western Indian Ocean. In Proceedings of the 12th International Coral Reef
Symposium, Cairns, Australia. 9-13.
Consalvey, M., Clark, M. R., & Rowden, A. A. (2016). The Future of Biological Sampling in the Deep Sea. Biological Sampling in the Deep Sea, 431-436.
Correia, J. P., Morgado, F., Erzini, K., & Soares, A. M. (2016). Elasmobranch landings in the Portuguese commercial fishery from 1986 to 2009. Arquipélago-Life and
Marine Sciences, 33, 81-109.
Cundy, M. E., Santana-Garcon, J., Ferguson, A. M., Fairclough, D. V., Jennings, P., & Harvey, E. S. (2017). Baited remote underwater stereo-video outperforms baited downward-facing single-video for assessments of fish diversity, abundance and size composition. Journal of Experimental Marine Biology and Ecology, 497, 19-32. Davidson, L. N., & Dulvy, N. K. (2017). Global marine protected areas to prevent
extinctions. Nature Ecology & Evolution, 1, 40.
Díaz-Gil, C., Smee, S. L., Cotgrove, L., Follana-Berná, G., Hinz, H., Marti-Puig, P., ... & Catalán, I. A. (2017). Using stereoscopic video cameras to evaluate seagrass meadows nursery function in the Mediterranean. Marine Biology, 164, 137. Dulvy, N. K., Fowler, S. L., Musick, J. A., Cavanagh, R. D., Kyne, P. M., Harrison, L. R., ... &
40
Dulvy, N.K., Baum, J.K., Clarke, S., Compagno, L.J., Cortes, E., Domingo, A., Fordham, S., Fowler, S., Francis, M.P., Gibson, C. & Martínez, J. (2008). You can swim but you can't hide: the global status and conservation of oceanic pelagic sharks and rays.
Aquatic Conservation: Marine and Freshwater Ecosystems, 18, 459-482
Espinoza, M., Cappo, M., Heupel, M. R., Tobin, A. J., & Simpfendorfer, C. A. (2014). Quantifying shark distribution patterns and species-habitat associations: implications of marine park zoning. PloS one, 9, e106885.
Ferretti, F., Worm, B., Britten, G. L., Heithaus, M. R., & Lotze, H. K. (2010). Patterns and ecosystem consequences of shark declines in the ocean. Ecology letters, 13, 1055-1071.
Fiori, L., Doshi, A., Martinez, E., Orams, M. B., & Bollard-Breen, B. (2017). The use of unmanned aerial systems in marine mammal research. Remote Sensing, 9, 543. Ghazilou, A., Shokri, M. R., & Gladstone, W. (2016). Animal v. plant‐based bait: does the
bait type affect census of fish assemblages and trophic groups by baited remote underwater video (BRUV) systems? Journal of fish biology, 88, 1731-1745. Guttridge, T. L., Van Zinnicq Bergmann, M. P. M., Bolte, C., Howey, L. A., Finger, J. S.,
Kessel, S. T., ... & Cashman, R. C. (2017). Philopatry and Regional Connectivity of the Great Hammerhead Shark, Sphyrna mokarran in the US and Bahamas. Front.
Marine Science, 4, 3.
Harvey, E. S., Cappo, M., Butler, J. J., Hall, N., & Kendrick, G. A. (2007). Bait attraction affects the performance of remote underwater video stations in assessment of demersal fish community structure. Marine Ecology Progress Series, 350, 245-254.
Harvey, E., Santana Garcon, J., Goetze, J., Saunders, B., & Cappo, M. (2018). The Use of Stationary Underwater Video for Sampling Sharks. Shark Research: Emerging
Technologies and Applications for the Field and Laboratory. 2, 12-15. Heithaus, M. R., Wirsing, A. J., Dill, L. M., & Heithaus, L. I. (2007). Long-term
movements of tiger sharks satellite-tagged in Shark Bay, Western Australia. Marine Biology, 151, 1455.
Heithaus, M. R., Frid, A., Wirsing, A. J., & Worm, B. (2008). Predicting ecological consequences of marine top predator declines. Trends in Ecology & Evolution, 23, 202-210.
Hensel, E., Wenclawski, S., & Layman, C. A. (2018). Using a small, consumer-grade drone to identify and count marine megafauna in shallow habitats. Latin
american journal of aquatic research, 46, 1025-1033.
Hutchings, J. A., Myers, R. A., García, V. B., Lucifora, L. O., & Kuparinen, A. (2012). Life‐ history correlates of extinction risk and recovery potential. Ecological
Applications, 22, 1061-1067.
Jaiteh, V. F., Loneragan, N. R., & Warren, C. (2017). The end of shark finning? Impacts of declining catches and fin demand on coastal community livelihoods. Marine
Policy. 87, 65- 71.
Kiszka, J. J., Mourier, J., Gastrich, K., & Heithaus, M. R. (2016). Using unmanned aerial vehicles (UAVs) to investigate shark and ray densities in a shallow coral lagoon.
Marine Ecology Progress Series, 560, 237-242.
Kilfoil, J. P., Wirsing, A. J., Campbell, M. D., Kiszka, J. J., Gastrich, K. R., Heithaus, M. R., ... & Bond, M. E. (2017). Baited Remote Underwater Video surveys undercount sharks at high densities: insights from full-spherical camera technologies. Marine
Ecology Progress Series, 585, 113-121.
Koh, L. P., & Wich, S. A. (2012). Dawn of drone ecology: low-cost autonomous aerial vehicles for conservation. Tropical Conservation Science, 5, 121-132.
Koski, W. R., Abgrall, P., & Yazvenko, S. B. (2010). An inventory and evaluation of unmanned aerial systems for offshore surveys of marine mammals. J. Cetacean
Res. Manage, 11, 239-247.
Kruschel, C., Ivancić, T., Lakić, R., & Schultz, S. T. (2016). The effects of interference interactions on fish communities as assessed by baited remote underwater videography (BRUV). Rapports et proces verbaux des réunions-Commission
42
Langlois, T., Williams, J., Monk, J., Bouchet, P., Currey, L., Goetze, J., ... & Whitmore, S. (2018). Marine sampling field manual for benthic stereo BRUVS (Baited Remote Underwater Videos). Field Manuals for Marine Sampling to Monitor Australian
Waters. 14, 22-28
Lennertz, T., Sparko, A. L., Cardosi, K., Lu, J., Yost, A., Kendra, A., & Sheridan, T. (2018). Pilots' Estimation of Altitude of a Small Unmanned Aircraft System (No. DOT/FAA/TC-18/23). John A. Volpe National Transportation Systems Center, 5, 62-73.
Letessier, T. B., Hosegood, P. J., Nimmo-Smith, A., Fernandes, M. C., Proud, R., Lieber, L., ... & Belamy, Z. (2016). Chagos Archipelago Pelagic Expedition, February 5-24, 2016. Marine Biology, 403, 123-129.
Linchant, J., Lisein, J., Semeki, J., Lejeune, P., & Vermeulen, C. (2015). Are unmanned aircraft systems (UASs) the future of wildlife monitoring? A review of
accomplishments and challenges. Mammal Review, 45, 239-252.
Mammi, I., & Rossi, L. (2017). Unmanned Aerial Vehicle Remote Sensing Applications for Coastal Monitoring. Marine Biology, 143, 128-134.
McLean, D. L., Green, M., Harvey, E. S., Williams, A., Daley, R., & Graham, K. J. (2015). Comparison of baited longlines and baited underwater cameras for assessing the composition of continental slope deepwater fish assemblages off southeast Australia. Deep Sea Research Part I: Oceanographic Research Papers, 98, 10-20. Ornes, S. (2014). Drones put spying eyes in the sky. Science News for Students. 38,
12-21.
Papastamatiou, Y., Meyer, C. G., Kosaki, R. K., Wallsgrove, N. J., & Popp, B. N. (2015). Movements and foraging of predators associated with mesophotic coral reefs and their potential for linking ecological habitats. Marine Ecology Progress Series. 521, 155-170.
Prato, G., Thiriet, P., Di Franco, A., & Francour, P. (2017). Enhancing fish Underwater Visual Census to move forward assessment of fish assemblages: An application in three Mediterranean Marine Protected Areas. PloS one, 12, e0178511.
Ratcliffe, N., Guihen, D., Robst, J., Crofts, S., Stanworth, A., & Enderlein, P. (2015). A protocol for the aerial survey of penguin colonies using UAVs 1. Journal of
Unmanned Vehicle Systems, 3, 95-101.
Rieucau, G., Kiszka, J. J., Castillo, J. C., Mourier, J., Boswell, K. M., & Heithaus, M. R. (2018). Using unmanned aerial vehicle (UAV) surveys and image analysis in the study of large surface‐associated marine species: a case study on reef sharks Carcharhinus melanopterus shoaling behaviour. Journal of fish biology, 93, 119-127.
Roff, G., Doropoulos, C., Rogers, A., Bozec, Y. M., Krueck, N. C., Aurellado, E., ... &
Mumby, P. J. (2016). The ecological role of sharks on coral reefs. Trends in ecology
& evolution, 31, 395-407.
Rogers, A. D., Tyler, P. A., Connelly, D. P., Copley, J. T., James, R., Larter, R. D., ... & Pearce, D. A. (2012). The discovery of new deep-sea hydrothermal vent communities in the Southern Ocean and implications for biogeography. PLoS
biology, 10, e1001234.
Ronney, N., McCann, K., Gellner, G., & Moore, J. C. (2006). Structural asymmetry and the stability of diverse food webs. Nature, 442, 265-269.
Rotherham, D., Underwood, A. J., Chapman, M. G., & Gray, C. A. (2007). A strategy for developing scientific sampling tools for fishery-independent surveys of estuarine fish in New South Wales, Australia. ICES Journal of Marine Science : Journal du
Conseil, 64, 1512-1516.
Russ, G. R. (2002). Yet another review of marine reserves as reef fishery management tools. Coral reef fishes: dynamics and diversity in a complex ecosystem, 1, 421-443.
Schmid, K., Reis-Filho, J. A., Harvey, E., & Giarrizzo, T. (2017). Baited remote
underwater video as a promising nondestructive tool to assess fish assemblages in clearwater Amazonian rivers: testing the effect of bait and habitat
type. Hydrobiologia, 784, 93-109.
Taylor, M. D., Baker, J., & Suthers, I. M. (2013). Tidal currents, sampling effort and baited remote underwater video (BRUV) surveys: are we drawing the right
44
Ventura, D., Bruno, M., Lasinio, G. J., Belluscio, A., & Ardizzone, G. (2016). A low-cost drone-based application for identifying and mapping of coastal fish nursery grounds. Estuarine, Coastal and Shelf Science, 171, 85-98.
Walker, D. I., Lukatelich, R. J., Bastyan, G., & McComb, A. J. (1989). Effect of boat moorings on seagrass beds near Perth, Western Australia. Aquatic botany, 36, 69-77.
Watson, D. L., Harvey, E. S., Fitzpatrick, B. M., Langlois, T. J., & Shedrawi, G. (2010). Assessing reef fish assemblage structure: how do different stereo-video techniques compare? Marine Biology, 157, 1237-1250.
Willis, T. J. (2001). Visual census methods underestimate density and diversity of cryptic reef fishes. Journal of Fish Biology, 59, 1408-1411.
Wich, S., Scott, L., & Koh, L. P. (2016). 7 Wings for wildlife. The Good Drone. 2, 9-11. Whitmarsh, S. K., Fairweather, P. G., & Huveneers, C. (2017). What is Big BRUVver up
to? Methods and uses of baited underwater video. Reviews in Fish Biology and
Fisheries, 27, 53-73.
Whitmarsh, S. K., Huveneers, C., & Fairweather, P. G. (2018). What are we missing? Advantages of more than one viewpoint to estimate fish assemblages using baited video. Royal Society open science, 5, 171993.
Appendix A Deployment times for surveys
A.1
Deployment of aerial and underwater equipment
Figure 10 Time scale of deployments for Drone A, B and C and bait only (above) and BRUV (below). BRUV or bait will be deployed prior to the second aerial survey and recovered between the second and third airborne surveys.