Olga Marisa da Silva Pereira
Agosto de 2013
The effects of anti-leukemia chemotherapy
on LKB1-AMPK pathway functioning in
acute myeloid leukemia cell lines
Os efeitos da quimioterapia anti-leucémica
na funcionalidade da via LKB1-AMPK em
linhas celulares de leucemia mielóide aguda
UMinho|20
13
Olga Marisa da Silva P
er eira The ef fects of anti-leuk emia chemot herapy on LKB1-AMPK pat hw a y functioning in acute m yeloid leuk
emia cell lines
Universidade do Minho
Escola de Ciências da Saúde
Trabalho realizado sob a orientação da
Professora Doutora Paula Cristina da Costa
Alves Monteiro Ludovico
e co-orientação da
Mestre Isabel Maria da Silva Castro
Olga Marisa da Silva Pereira
Agosto de 2013
Dissertação de Mestrado
Mestrado em Ciências da Saúde
The effects of anti-leukemia chemotherapy
on LKB1-AMPK pathway functioning in
acute myeloid leukemia cell lines
Os efeitos da quimioterapia anti-leucémica
na funcionalidade da via LKB1-AMPK em
linhas celulares de leucemia mielóide aguda
Universidade do Minho
iii
The work presented in this thesis was performed in the Microbiology and Infection Research Domain in the Life and Health Sciences Research Institute (ICVS), School of Health Sciences, University of Minho, Braga, Portugal (ICVS/3B’s – PT Government Associate Laboratory, Braga/Guimarães, Portugal). The financial support was given by Fundação para a Ciência e Tecnologia (FCT)/MCTES (PIDDAC) and co-supported by Fundo Europeu de Desenvolvimento Regional (FEDER) though the COMPETE-Programa Operacional Factores de Competitividade (POFC) means of a project PTDC/BIA-MIC/114116-2009.
v
AGRADECIMENTOS
À Professora Doutora Paula Ludovico, pela oportunidade, conhecimento e apoio transmitidos ao longo deste projecto. Obrigada!
À Doutora Isabel Castro, pela ajuda e apoio durante este projecto.
À Belém e à Ângela, pela ajuda constante, apoio incondicional, palavras de amizade e momentos de boa disposição que passamos juntas. Obrigada!
Ao Bernardo, pela disponibilidade e prontidão em ajudar, sempre!
Ao João Amorim, pelos momentos de descontracção, boa disposição e gargalhadas sem fim que me proporcionou.
À Ana Rita e à Joana pelas gargalhadas e momentos de boa disposição que passamos juntas. A todos os colegas do ICVS com quem tive oportunidade de conviver, aprender e crescer enquanto pessoa.
Aos meus pais, que me apoiaram incondicionalmente ao longo de todo o meu percurso académico.
Aos meus irmãos, pelo apoio incondicional, palavras de carinho, momentos de descontracção e por nunca me deixarem desistir. Obrigada!
Aos meus sobrinhos, que são das pessoas que mais amo neste mundo e que sempre me deram força para lutar pelos meus objectivos.
vii
ABSTRACT
Acute myeloid leukemia (AML) is a clonal disorder characterized by genetic alterations in hematopoietic stem and/or progenitor cells, leading to the accumulation of leukemic myeloblasts. Current AML therapies rely mainly on high doses of cytarabine and doxorubicin, which promote good outcomes for young patients but that are highly toxic and have limited application and poor outcomes among old individuals. Thus, the elucidation of the mechanisms underlying AML cell’s response to conventional chemotherapy is still a major challenge.
Studies showed that some anticancer agents that induce DNA damage activate a DNA damage response (DDR), involving the phosphorylation of proteins such as AMP-activated protein kinase (AMPK), that leads to autophagy induction as a pro-survival mechanism. Cytarabine and doxorubicin are inducers of DNA damage and DDR, however, the study of their effects in AML cells is still very scarce. Our preliminary data showed that AML cells treated with conventional chemotherapy displayed cell cycle arrest in G0/G1 and S phases associated with autophagy induction. Therefore, this work aimed to understand if the activation of AMPK pathway with consequent cell cycle arrest and autophagy induction could act as a pro-survival mechanism in AML cells. For such purpose, two AML cell lines (HL-60 and KG-1) were used as in vitro models and their response to conventional chemotherapy, cytarabine and/or doxorubicin was evaluated. The effect of conventional chemotherapy combination with rapamycin or chloroquine (CQ), autophagy activator or inhibitor, respectively, was also determined.
Results suggested that cytarabine or doxorubicin promote DNA damage in HL-60 cells, which leads to the activation of AMPK pathway culminating in G0/G1 cell cycle arrest and autophagy induction as a pro-survival mechanism. Whether anti-leukemia agents promote DNA damage in KG-1 cells is inconclusive due to the high endogenous levels of DNA damage displayed by these cells, however, our data showed that doxorubicin alone or combined with cytarabine promote AMPK pathway activation, S phase cell cycle arrest and autophagy induction as a tumor suppressor mechanism. Results obtained with the combination of anti-leukemia agents with CQ showed a decrease in HL-60 cell viability but an increase in KG-1 cell viability, supporting the hypothesis that this process may function as a pro-survival in HL-60 cells but a pro-death in KG-1 cells. Therefore, different approaches involving the combination of conventional chemotherapy with AMPK/autophagy modulators could be a good strategy for combined chemotherapy in AML.
viii
ix
RESUMO
A leucemia mielóide aguda (LMA) é uma doença clonal caracterizada por alterações genéticas nas células estaminais e/ou progenitoras hematopoiéticas, resultando numa acumulação de mieloblastos leucémicos. A actual terapia anti-leucémica consiste principalmente na aplicação de elevadas doses de citarabina e doxorubicina. Apesar deste regime terapêutico ser eficiente em pacientes jovens, a sua aplicação é limitada e tem resultados insatisfatórios em pacientes idosos. Desta forma, a elucidação dos mecanismos celulares de resposta das células de LMA à quimioterapia convencional é ainda um grande desafio.
Diferentes estudos demonstraram que alguns agentes anticancerígenos indutores de danos no DNA activam uma resposta celular a estes danos, que envolve a fosforilação de proteínas tais como “AMP-activated protein kinase” (AMPK), resultando numa indução de autofagia como mecanismo de adaptação e sobrevivência. A citarabina e a doxorubicina são conhecidos indutores de danos no DNA e da resposta celular a estes danos, no entanto, os dados sobre estes efeitos em células de LMA são ainda muito escassos. Dados preliminares do nosso grupo demonstraram que células de LMA tratadas com quimioterapia convencional exibem uma paragem do ciclo celular nas fases G0/G1 e S associada com a indução de autofagia. Assim, este trabalho pretende determinar se a activação da via AMPK com consequente paragem do ciclo celular e indução de autofagia pode constituir um mecanismo de adaptação e sobrevivência das células de LMA. Para isso, duas linhas celulares de LMA (HL-60 e KG-1) foram usadas como modelos in vitro, sendo sujeitas a tratamento com citarabina e/ou doxorubicina. O efeito da combinação da quimioterapia convencional com rapamicina ou cloroquina (CQ), um activador ou inibidor da autofagia, respectivamente, foi também avaliado.
Os resultados obtidos indicaram que a citarabina e a doxorubicina promovem danos no DNA nas células HL-60, os quais levam à activação da via do AMPK culminando numa paragem do ciclo celular nas fases G0/G1 e indução de autofagia como mecanismo de sobrevivência. Apesar de os resultados serem inconclusivos no que diz respeito à indução de danos no DNA nas células KG-1, principalmente devido aos elevados níveis endógenos de danos no DNA apresentados por estas células, os nossos resultados indicam que a doxorubicina sozinha ou combinada com a citarabina promove activação da via AMPK, paragem no ciclo celular na fase S e indução de autofagia como mecanismo associado à morte celular. Os resultados obtidos com a combinação da terapia convencional com a CQ mostraram uma diminuição da viabilidade das
x
células HL-60 mas um aumento da viabilidade das células KG-1, suportando a hipótese de que a autofagia funciona como um mecanismo de sobrevivência nas células HL-60 mas como um mecanismo associado à morte nas células KG-1. Assim, diferentes metodologias envolvendo a combinação da quimioterapia convencional com moduladores do AMPK/autofagia poderão ser uma boa estratégia terapêutica para pacientes com LMA.
xi
TABLE OF CONTENTS
Pag.
List of tables and figures ……….……. xiii
Abbreviations ………...… xvii
Introduction ……….……….... 1
1. Acute Leukemia ……….…… 1
1.1. Acute myeloid leukemia ……….. 1
1.1.1. Etiology and epidemiology ……….…… 1
1.1.2. Clinical presentation ………...…. 3
1.1.3. Diagnosis and classification ………...………….…. 4
1.1.4. Cytogenetic abnormalities ………....… 6
1.1.5. Therapy and outcomes ……….…..……….….. 7
2. Cytarabine and doxorubicin ……… 11
2.1. Mechanisms of action ………...…. 11
2.2. Activation of a DNA damage response (DDR) ……….…. 13
3. Cell cycle regulation in response to DNA damage ………..…….…….…… 22
4. Autophagy: a pro-survival or a pro-death mechanism? ... 24
5. LKB1-AMPK pathway and autophagy in acute myeloid leukemia: a survival or a pro-death mechanism? .………...…….… 28
Aims ………..….. 31
Material and Methods ………... 33
Results ……….. 37
1. Detection of DNA damage induced by conventional chemotherapy in AML cells ……….… 37
1.1. HL-60 cells (AML - FAB M2 leukemia) ……….……..… 37
1.1.1. Cytarabine and doxorubicin cytotoxicity and IC50 determination ………...… 37
1.1.2. Detection of DNA damage through the evaluation of H2AX phosphorylation…...…….. 40
1.2. KG-1 cells (erythroleukemia - FAB M6 leukemia) ………..….… 42
1.2.1. Cytarabine and doxorubicin cytotoxicity and IC50 determination ………... 42
1.2.2. Detection of DNA damage through the evaluation of H2AX phosphorylation …………. 45 2. Determination of AMPK pathway functioning in AML cells response to conventional
xii
chemotherapy ……….…. 47
2.1. HL-60 cells (AML - FAB M2 leukemia) ……… 47 2.2. KG-1 cells (erythroleukemia - FAB M6 leukemia) ………..………..…. 50 3. Analysis of AMPK pathway outcomes, cell cycle profile and autophagy activity, in AML cells
challenged with conventional chemotherapy ………..…… 53
3.1. HL-60 cells (AML - FAB M2 leukemia) ……….…...…. 53 3.2. KG-1 cells (erythroleukemia - FAB M6 leukemia) ………..……… 56 4. Study the impact of autophagy pharmacological manipulation on cell survival and DNA
damage of AML cells treated with conventional chemotherapy ……….…….… 59
4.1. HL-60 cells (AML - FAB M2 leukemia) ……….…….……. 60 4.1.1. Determination of rapamycin sub-lethal concentrations that induce autophagy …….... 60 4.1.2. Determination of CQ sub-lethal concentrations that inhibit autophagy ………..….. 61 4.1.3. Evaluation the impact of autophagy pharmacological manipulation on viability of cells
treated with conventional chemotherapy ………..…… 63
4.1.3.1. Evaluation of autophagy activity and cell cycle profile ………..…………... 63
4.1.3.2. Evaluation of cell viability ………....…. 68
4.1.4. Evaluation the impact of autophagy pharmacological manipulation on DNA damage of
cells treated with conventional chemotherapy ……….………...….. 71
4.2. KG-1 cells (erythroleukemia - FAB M6 leukemia) ………...…… 74 4.2.1. Determination of rapamycin sub-lethal concentrations that induce autophagy …….… 74 4.2.2. Determination of CQ sub-lethal concentrations that inhibit autophagy ………....… 75 4.2.3. Evaluation the impact of autophagy pharmacological manipulation on viability of cells
treated with conventional chemotherapy ………...….… 77
4.2.3.1. Evaluation of autophagy activity and cell cycle profile ……….. 77
4.2.3.2. Evaluation of cell viability ………..….…. 81
4.2.4. Evaluation the impact of autophagy pharmacological manipulation on DNA damage of
cells treated with conventional chemotherapy ……….…………..…… 84
Discussion ………..… 91 References ……….… 99
xiii
LIST OF TABLES AND FIGURES
Tables: Pag.
Table 1 - Classification of acute myeloid leukemia (AML) according to FAB classification system ………..… 4
Table 2 - Classification of acute myeloid leukemia (AML) according to 2008 WHO classification system ... 5
Table 3 - Treatment outcomes in acute myeloid leukemia (AML) based on age criteria ………...……….. 9
Table 4 - Therapeutic strategies investigated in the treatment of acute myeloid leukemia (AML) …………. 10
Table 5 - IC50 values of cytarabine and doxorubicin determined by MTS assay and sub-lethal and lethal concentrations of hydroxyurea (HU) determined by MTS and Annexin V/PI assays in HL-60 cells …………. 40
Table 6 - IC50 values of cytarabine and doxorubicin and sub-lethal and lethal concentrations of hydroxyurea (HU) determined by MTS and Annexin V/PI assays in KG-1 cells ………. 45
Table 7 - An overview of the results obtained with HL-60 cells ……… 88
Table 8 - An overview of the results obtained with KG-1 cells ……….. 89
Figures: Figure 1 - Schematic representation of the models for acute myeloid leukemia (AML) development ……… 2
Figure 2 - Acute Myeloid Leukemia (AML): Age-Specific Incidence Rates by Sex in the U.S. population (2006-2010) ……….………. 3
Figure 3 - General outline of the DNA damage response (DDR) ……….………. 14
Figure 4 - Partial schematic representation of the DNA damage response (DDR) pathway activated by the chemotherapeutic agent´s cytarabine and doxorubicin ……….……… 16
Figure 5 - Schematic representation of the interplay between AMPK and p53 and p27 in response to DNA damage ……….………. 18
Figure 6 - Schematic representation of the interaction of AMPK with raptor and ULK1 in response to metabolic stress ………. 20
Figure 7 - Schematic representation of the interplay between DNA damage response, activated by the chemotherapeutic agent´s cytarabine and doxorubicin, and LKB1-AMPK pathway ……….. 21
Figure 8 - Schematic representation of the several stages of autophagy ……….……..….………..………. 25
Figure 9 - Cytotoxicity of cytarabine and/or doxorubicin in HL-60 cells ……….……….. 38
Figure 10 - Hydroxyurea (HU) cytotoxicity in HL-60 cells ……….………. 39
Figure 11 - pH2AX (Ser139) and total H2AX protein levels and densitometric analysis of pH2AX/H2AX in HL-60 cells treated with cytarabine and/or doxorubicin (A) or hydroxyurea (HU) (B) ……… 42
xiv
Figure 12 - Cytotoxicity of cytarabine and/or doxorubicin in KG-1 cells ……….. 43 Figure 13 - Hydroxyurea (HU) cytotoxicity in KG-1 cells ………. 44 Figure 14 - pH2AX (Ser139) and total H2AX protein levels and densitometric analysis of pH2AX/H2AX in
KG-1 cells treated with cytarabine and/or doxorubicin (A) or hydroxyurea (HU) (B) ………46
Figure 15 - pAMPK (Thr172) and total AMPK protein levels and densitometric analysis of pAMPK/AMPK in
HL-60 cells treated with cytarabine and/or doxorubicin (A) or hydroxyurea (HU) (B) ………... 48
Figure 16 - pp27 (Thr198) and total p27 protein levels and densitometric analysis of pp27/p27 in HL-60
cells treated with cytarabine and/or doxorubicin (A) or hydroxyurea (HU) (B) ……….….49
Figure 17 - pAMPK (Thr172) and total AMPK protein levels and densitometric analysis of pAMPK/AMPK in
KG-1 cells treated with cytarabine and/or doxorubicin (A) or hydroxyurea (HU) (B) ……….. 51
Figure 18 - pp27 (Thr198) and total p27 protein levels and densitometric analysis of pp27/p27 in KG-1
cells treated with cytarabine and/or doxorubicin (A) or hydroxyurea (HU) (B) ………..…………..…… 52
Figure 19 - Cell cycle profile of HL-60 cells treated with cytarabine and/or doxorubicin (A) or hydroxyurea
(HU) (B) ………. 54
Figure 20 - LC3-I and LC3-II protein levels and densitometric analysis of LC3-II/LC3-I in HL-60 cells treated
with cytarabine and/or doxorubicin (A) or hydroxyurea (HU) (B) ……… 55
Figure 21 - Cell cycle profile of KG-1 cells treated with cytarabine and/or doxorubicin (A) or hydroxyurea
(HU) (B) ………. 57
Figure 22 - LC3-I and LC3-II protein levels and densitometric analysis of LC3-II/LC3-I in KG-1 cells treated
with cytarabine and/or doxorubicin (A) or hydroxyurea (HU) (B) ……… 58
Figure 23 - Determination of HL-60 cell viability after treatment with rapamycin ……… 60 Figure 24 - LC3-I and LC3-II protein levels and densitometric analysis of LC3-II/LC3-I in HL-60 cells treated
with rapamycin ……… 61
Figure 25 - Determination of HL-60 cell viability after treatment with CQ ……….. 62 Figure 26 - LC3-I and LC3-II protein levels and densitometric analysis of LC3-II/LC3-I in HL-60 cells treated
with CQ ……….. 63
Figure 27 - LC3-I and LC3-II protein levels and densitometric analysis of LC3-II/LC3-I in HL-60 cells treated
with cytarabine and/or doxorubicin combined with a sub-lethal concentration of rapamycin ……… 64
Figure 28 - Cell cycle profile of HL-60 cells treated with cytarabine and/or doxorubicin combined with a
sub-lethal concentration of rapamycin ………..……… 65
Figure 29 - LC3-I and LC3-II protein levels and densitometric analysis of LC3-II/LC3-I in HL-60 cells treated
with cytarabine and/or doxorubicin combined with a sub-lethal concentration of CQ ……….. 66
Figure 30 - Cell cycle profile of HL-60 cells treated with cytarabine and/or doxorubicin combined with a
xv
Figure 31 - Determination of HL-60 cell viability after treatment with cytarabine and/or doxorubicin
combined with a sub-lethal concentration of rapamycin ……… 69
Figure 32 - Determination of HL-60 cell viability after treatment with cytarabine and/or doxorubicin
combined with a sub-lethal concentration of CQ ……….. 70
Figure 33 - pH2AX (Ser139) and total H2AX protein levels and densitometric analysis of pH2AX/H2AX in
HL-60 cells treated with cytarabine and/or doxorubicin combined with a sub-lethal concentration of
rapamycin ……….… 72
Figure 34 - pH2AX (Ser139) and total H2AX protein levels and densitometric analysis of pH2AX/H2AX in
HL-60 cells treated with cytarabine and/or doxorubicin combined with a sub-lethal concentration of CQ ………..………. 73
Figure 35 - Determination of cell viability (A) and LC3-I and LC3-II protein levels and densitometric analysis
of LC3-II/LC3-I (B) in KG-1 cells treated with rapamycin ………..………... 74
Figure 36 - Determination of KG-1 cell viability after treatment with CQ ………. 75 Figure 37 - LC3-I and LC3-II protein levels and densitometric analysis of LC3-II/LC3-I in KG-1 cells treated
with CQ …... 76
Figure 38 - LC3-I and LC3-II protein levels and densitometric analysis of LC3-II/LC3-I in KG-1 cells treated
with cytarabine and/or doxorubicin combined with a sub-lethal concentration of rapamycin ………... 77
Figure 39 - Cell cycle profile of KG-1 cells treated with cytarabine and/or doxorubicin combined with a
sub-lethal concentration of rapamycin ……….. 78
Figure 40 - LC3-I and LC3-II protein levels and densitometric analysis of LC3-II/LC3-I in KG-1 cells treated
with cytarabine and/or doxorubicin combined with a sub-lethal concentration of CQ ……….. 79
Figure 41 - Cell cycle profile of KG-1 cells treated with cytarabine and/or doxorubicin combined with a
sub-lethal concentration of CQ ……….…… 80
Figure 42 - Determination of KG-1 cell viability after treatment with cytarabine and/or doxorubicin
combined with a sub-lethal concentration of rapamycin ………..……. 82
Figure 43 - Determination of KG-1 cell viability after treatment with cytarabine and/or doxorubicin
combined with a sub-lethal concentration of CQ ……….. 83
Figure 44 - pH2AX (Ser139) and total H2AX protein levels and densitometric analysis of pH2AX/H2AX in
KG-1 cells treated with cytarabine and/or doxorubicin combined with a sub-lethal concentration of
rapamycin ………. 84
Figure 45 - pH2AX (Ser139) and total H2AX protein levels and densitometric analysis of pH2AX/H2AX in
KG-1 cells treated with cytarabine and/or doxorubicin combined with a sub-lethal concentration of CQ …. 85
Figure 46 - Schematic representation of the results obtained with HL-60 (A) and KG-1 (B) cells during this
xvii
ABBREVIATIONS
HSC - hematopoietic stem cell AMPK - AMP-activated protein kinase
AML - acute myeloid leukemia MDM2 - murine double minute 2
ALL - acute lymphoid leukemia Sesn 1/2 - Sestrins 1 and 2
LSC - leukemic stem cell TSC - tuberous sclerosis
CMP - common myeloid progenitor Rheb - Ras homolog enriched in brain
MDS - myelodysplastic syndrome mTORC1 - mammalian target of rapamycin
FAB - French-American-British system complex 1
WHO - World Health Organization system CDKI - cyclin-dependent kinase inhibitor AML-MRC - AML with myelodysplasia-related Chk - checkpoint kinase
chances Cdc25A - Cell division cycle 25 homolog A
t-MN - therapy-related myeloid neoplasms GADD45 - growth arrest and DNA damage 45
CR - complete remission Atg - autophagy-related genes
HDAC - high doses of cytarabine hVPS34 - vacuolar protein sorting 34
HSCT - hematopoietic stem cell transplantation PE - phosphatidylethanolamine
OS - overall survival 3-MA - 3-Methyladenine
MDR - multi-drug resistance CQ - chloroquine
APL - acute promyelocytic leukemia HU - hydroxyurea
ATRA - all-trans retinoic acid PI - propidium iodide
RXR - retinoic X receptor IC50 - half maximal inhibitory concentration
ATO - arsenic trioxide
Ara-C- 1-β-arabinofuranosylcytosine/cytarabine DDR - DNA damage response
PIKKs - phosphoinositide 3-kinase related
protein kinases
ATM - ataxia-telangiectasia mutated ATR - ATM and Rad3 related
dsDNA breaks - double-strand DNA breaks ssDNA breaks - single-strand DNA breaks LKB1 - liver kinase B1
1
INTRODUCTION
1. Acute Leukemia
Acute leukemia comprises a group of clonal disorders characterized by an uncontrolled expansion of hematopoietic stem cells (HSCs) and/or committed progenitor cells that fail to differentiate normally, resulting in the accumulation of nonfunctional immature cells [1-3]. This group of disorders is divided into two different subtypes depending on their cell of origin: leukemia evolving from myeloid precursors is named acute myeloid leukemia (AML), while lymphocytic precursors give rise to acute lymphoid leukemia (ALL) [4].
1.1. Acute myeloid leukemia 1.1.1. Etiology and epidemiology
AML is a clonal hematopoietic disorder characterized by an extreme proliferation and accumulation of abnormal leukemic myeloblasts in the bone marrow, which interfere with the normal production of blood cells [5-8]. Alterations in HSCs, committed myeloid progenitors cells or both can be responsible for the transformation of normal hematopoietic cells into leukemic myeloblasts [3, 9] and three different scenarios can be described [3]: A) HSC undergoes a first mutation leading to the formation of a pre-leukemic stem cell. Then, secondary mutation(s), epigenetic changes and/or aberrant microenvironment signals promote the transformation of the pre-leukemic stem cell into a leukemic stem cell (LSC) (Fig.1A); B) a first mutation occurs at the HSC level resulting in the formation of a pre-leukemic myeloid progenitor cell. This cell gives rise to LSC after secondary mutation(s), epigenetic changes and/or aberrant microenvironment signals (Fig.1B); C) HSC first differentiates into a common myeloid progenitor (CMP) cell, which then undergoes primary and secondary mutations to ultimately generate LSC (Fig.1C). For all of the three scenarios, the generation of LSC with self-renewal capability, abnormal/arrested differentiation and resistance to death signals leads to the formation and accumulation of leukemic myeloblasts in the bone marrow (Fig.1). This accumulation disrupts the normal production of white and red blood cells and platelets [5-8]. During the progression of the disease, leukemic myeloblasts accumulation occurs not only in the bone marrow, but also in the blood
2
and organs such as brain, skin and gums, which may lead to infection, anemia, bleeding or organ infiltration [5-8].
Figure 1 – Schematic representation of the models for acute myeloid leukemia (AML) development.
Three different scenarios can occur during AML evolution (A-C). HSCs, CMP cells or both are potential targets for primary and secondary mutations, epigenetic changes and/or aberrant microenvironment signals that lead to the acute myeloid disease development. Cells bearing a single mutation are termed “pre-leukemic”, which upon undergoing subsequent mutations, epigenetic changes and/or aberrant microenvironment signals give rise to LSCs. LSCs in turn give rise to the majority of malignant cells found in the leukemia population – myeloblasts. From [3].
AML can arise de novo or secondarily either due to the progression of other malignant disorders, such as myelodysplastic syndrome (MDS) or chronic bone marrow stem cell disorders, [10, 11] or due to the treatment with cytotoxic agents or radiotherapy (10-15% of patients with AML develop this disease after treatment with cytotoxic chemotherapy used in solid tumors) [12, 13].
3
AML comprises about 40% of all leukemia in the Western world [8] and 25% of all leukemia diagnosed in adults [14]. In fact, AML is the most common type of acute leukemia in adults [14], with a median age of diagnosis of 65 years [8, 15, 16]. The incidence of AML increases with age [17-19], being rarely diagnosed before the 40 years (Fig.2) [18, 19]. From 2006 to 2010, the U.S. incidence in the <65 years’ age group was only 1.5 cases per 100,000 people, whereas in the ≥ 65 years’ age group was 18.3 cases per 100,000 people (Fig.2) [19]. AML in adults has a slight male predominance and from 2006 to 2010, the U.S. incidence in the male´s group was 7.9 per 100,000 people, whereas only 5.1 per 100.000 people was in females (Fig.2) [19]. AML incidence is expected to increase in the future in line with age population [17, 18].
Figure 2 - Acute Myeloid Leukemia (AML): Age-Specific Incidence Rates by Sex in the U.S. population (2006-2010). The horizontal axis shows 5-year age intervals. The vertical axis shows the frequency of new cases
of AML per 100,000 people in a given age and sex-group. Red, purple and blue represents males, females and males plus females, respectively. From [19].
1.1.2. Clinical presentation
The AML symptoms are nonspecific and include loss of weight and appetite, weakness and fatigue, lethargy, dyspnea, fever and bleeding [4, 20]. Pains in the bones may occur as result of
<1 1-4 5-9 10-1415-19 20-2425-2930-3 4 35-3940-4445-49 50-5455-59 60-6 4 65-6970-7475-79 80-84 85 + 0 5 10 15 20 25 30 35
Males and Females Males Females Age at diagnosis In ci d e n ce ( p e r 10 0 ,0 0 0 )
4
bone marrow infiltration with blasts [4, 20]. Hepatosplenomegaly may also occur when blasts infiltrate organs [4].
Common physical features may include pallor, epistaxis, gingivitis, splenomegaly, hepatomegaly or bone tenderness [4].
1.1.3. Diagnosis and classification
The 2 systems commonly used in the classification of AML are the French-American-British (FAB) system, initially proposed in 1976 [21], and the World Health Organization (WHO) system, introduced by the first time in 1999 [20, 22]. The FAB classification is based on morphology, cytochemistry and degree of maturation of malignant blasts [23, 24], whereas WHO classification combines not only morphologic and cytochemistry features but also genetic, immunophenotypic, biologic and clinical information [25-27].
The FAB classification recognizes eight subtypes of AML (M0 to M7) (Table 1) [4, 20, 23], while 2008 WHO classification identifies four main subgroups: i) AML with recurrent genetic abnormalities; ii) AML with myelodysplasia-related changes (AML-MRC); iii) therapy-related myeloid neoplasms (t-MN) and iv) those that do not fall into any of these groups (Table 2) [26-28].
Table 1 - Classification of acute myeloid leukemia (AML) according to FAB classification system [20].
FAB subtype Morphological classification
M0 Undifferentiated acute myeloid leukemia M1 Acute myeloid leukemia with minimal maturation M2 Acute myeloid leukemia with maturation M3 Acute promyelocytic leukemia M4 Acute myelomonocytic leukemia M4 eos Acute myelomonocytic leukemia with eosinophilia
M5 Acute monocytic leukemia M6 Acute erythroid leukemia M7 Acute megakaryoblastic leukemia
5
The WHO system created several subclasses of AML (Table 2), allowing physicians to identify subgroups of patients who might benefit from specific treatment strategies [20].
Table 2 - Classification of acute myeloid leukemia (AML) according to 2008 WHO classification system [26-28].
AML with recurrent genetic abnormalities AML with myelodysplasia-related changes
(AML-MRC)
Therapy-related myeloid neoplasms
(MN: AML; t-MDS; t-MDS/MPN)
AML not otherwise specified (AML NOS)
AML with t(8;21)(q22;q22);
RUNX1-RUNX1T1
AML with inv(3)(q21; q26.2) or t(3;3)(q21;q26.2);
RPN1-EVl1
AML cases with a history of MDS (myelodysplastic syndrome) or MDS/MPN (myelodysplastic syndrome/myeloproliferative neoplasm) Direct mutational effect of cytotoxic agents and/or radiation
AML with minimal differentiation Acute erythroid leukemia (erythroid/myeloid and pure erythroleukemia) * AML with inv(16)(p13.1;
q22) or t(16;16)(p13.1;p22); CBFB-MYH11 AML (megakaryoblastic) with t(1;22)(p13;q13); RBM15-MKL1 Without antecedent MDS or MDS/MPN, but with dysplasia in at least 50% of cells in two or
more myeloid lineages
Immunosuppression from prior or current therapy AML without maturation Acute megakaryocytic leukemia Acute promyelocytic leukemia with t(15;17)(q22;q12); PML-RARα Provisional entities: AML with mutated
NPM1; AML with mutated CEBPA
AML cases with myelodysplasia-related cytogenetic abnormalities Ineffective bone marrow microenvironment because of injury to vascular supply or increasing fibrosis (caused by prior treatment) AML with
maturation Acute basophilic leukemia
AML with t(9;11)(p22;q23); MLLT3-MLL Host genetic predisposition Acute myelomonocytic leukemia Acute panmyelosis with myelofibrosis AML with t(6;9)(p23;q34); DEK-NUP214 High frequency of unfavorable cytogenetic abnormalities Acute monoblastic/ acute monocytic leukemia Footnote:
* The 2008 WHO system recognizes two different subtypes of acute erythroid leukemia depending on the presence or absence of a significant myeloblastic component: acute erythroid/myeloid leukemia and pure erythroleukemia. The first subtype is characterized by: i) myeloblasts <20% of all bone marrow cells but ≥ 20% of the nonerythroid cells; ii) at least 50% erythroid precursors in the bone marrow nucleated cell population [28]. In the second subtype 80% or more of the bone marrow cells are immature erythroid precursors with minimal differentiation and no significant myeloblastic component [25].
6
According to WHO classification, a myeloid neoplasm with 20% or more blasts in the peripheral blood or bone marrow is identified as AML, in contrast with the FAB system where this threshold increases to 30% [25, 26].
1.1.4. Cytogenetic abnormalities
AML is a heterogeneous hematological disorder with respect to chromosome abnormalities, gene mutations and changes in expression of multiple genes and microRNAs [20]. Cytogenetic abnormalities are detected in 50% to 60% of the newly diagnosed AML patients [29], being the majority associated with non-random chromosomal translocations [30]. These translocations often result in gene rearrangements that involve a locus encoding a transcriptional activator that leads to the expression of a fusion protein [30]. In many cases, this fusion protein functions as a transcriptional factor capable of interacting with a co-repressor complex [30]. Thus, in the presence of aberrant recruitment of a co-repressor to a locus of active transcription, this fusion protein changes expression of target genes necessary for myeloid development, which contribute for leukemic transformation [31, 32]. The three most common chromosomal translocations that occur in AML are t (15; 17) and t (8; 21) with an occurrence of 10% and inv (16) with an occurrence of 5% [20, 29]. The t (15; 17), t (8; 21) and inv (16) result in the expression of PML-RARα, RUNX1-RUNX1T1 (also called AML1-ETO [33]) and CBFβ-MYH11 oncofusion proteins, respectively. These proteins, by different mechanisms (reviewed in [20, 29, 33]), act as transcriptional repressors that interfere with the expression of genes involved in important processes such as differentiation, impairing the hematopoietic myeloid cells maturation [34-38]. AML patients with these alterations are classified into the group with a favorable prognosis [29].
Around 40%-50% of AML patients present a normal karyotype and are included into the intermediate-risk group [39]. However, not all these patients exhibit the same response to treatment, mainly due to the presence of a large variability in gene mutations. These mutations can be divided into two classes, class I and class II [20]. Class I comprises the mutations that activate signal transduction pathways responsible for proliferation, survival or both in hematopoietic myeloid progenitor cells. Mutations in KIT (feline sarcoma viral oncogene homolog), FLT3 (Fms-like tyrosine kinase 3) and RAS (rat sarcoma viral oncogene homolog) fall into this group [20]. On the other hand, class II includes the mutations that affect transcription
7
factors or components of the cell cycle machinery blocking normal myeloid differentiation. Mutations in MLL (mixed lineage leukemia), BAAL (brain and acute leukemia), WT1 (Wilms tumor 1), CEBPα (enhancer-binding protein α) and NPM1 (nucleoplasmin 1) genes belong to this group [20].
The detailed knowledge about cytogenetic and molecular characterization of AML patients comprises crucial information for a better diagnosis, prognosis and treatment strategies.
1.1.5. Therapy and outcomes
Acute leukemia is a fatal disease that if untreated has a median survival of 3 months or less [4]. Therefore, the early diagnosis and treatment are fundamental for obtain better outcomes.
The treatment of AML is divided into two phases: the remission induction therapy (with possible post-induction phase) and the post-remission therapy [4, 20]. In the induction therapy, the goal is to achieve a marked reduction in the number of malignant cells in the bone marrow and peripheral blood in order to establish normal hematopoiesis [4, 20]. The post-remission therapy is administered weeks after the induction therapy has ended with the intention of preventing relapse [4, 20]. The basis for the current AML treatment was developed nearly 30 years ago and consists in the combination of an anthracycline (DNA intercalating agent and topoisomerase II inhibitor), such as daunorubicin or idarubicin, and cytarabine (a nucleoside analog) [40-43]. The standard regimen used during the remission induction therapy of AML includes 7 days of continuous infusion of cytarabine (100-200 mg/m2) combined with
daunorubicin or idarubicin (45-60 mg/m2) administered intravenously for 3 days, referred to as
“7 + 3” regimen [40-43]. After this first phase, it is expected that AML patients achieve complete remission (CR), which is defined as a bone marrow with less than 5% of blasts and a neutrophil and platelet count greater than 1000 and 100 000, respectively [44]. However, only 65%-75% of patients aged < 60 years [40-42, 45] and 40%-50% of patients aged > 60 years reach CR [45-47]. In order to improve the CR rate, several studies have been conducted using alternative anthracyclines, the anthracenedione mitoxantrone, high doses of cytarabine (HDAC) (cumulative dose 18-24 g/m2) or additional cytotoxic agents such as etoposide, fludarabine, cladribine or
topotecan [6, 7, 20]. However, despite theoretical benefits, none of these regimens have convincingly shown a survival advantage over “7 + 3” standard regimen [6, 7, 20]. Therefore,
8
patients who fail to achieve CR after remission induction therapy, should participate in the post-induction therapy [20]. On the other hand, patients who achieve CR should advance to the next phase, the post-remission therapy, since studies have shown that patients who don´t receive post-remission therapy relapse within 6 to 9 months [48]. The post-remission therapy includes chemotherapy, autologous hematopoietic stem cell transplantation (HSCT) or allogeneic HSCT [7]. The choice of the treatment depends on patient age, comorbidities, chance of relapse based on cytogenetics and whether or not the patient has a suitable donor for HSCT [7]. For patients aged < 60 years, the standard consolidation chemotherapy consists in high doses of cytarabine (2-3 g/m2)[7, 20] twice a day on days 1, 3 and 5, for a total of 3 to 4 cycles [7]. However,
patients older than 60 years receive a less intensive chemotherapy based in 5 days of cytarabine (100 mg/m2) and 2 days of daunorubicin (45 mg/m2), for a total of 2 cycles [6, 7]. Previous
studies showed that high doses of cytarabine induce higher toxicity, mainly cerebellar toxicity, in patients aged > 60 years, making this approach an unacceptable option [49, 50]. HSCT is also associated with increased risks of transplant-related morbidity and mortality. Therefore, this approach is less common in patients aged > 60 years, being used in patients aged < 60 years who have a substantial risk of relapse [51].
In addition to AML treatment recommendations also AML outcomes differ depending on whether patients are above or below 60 years old [52, 53]. Patients aged > 60 years have lower CR rates, shorter disease-free survival and overall survival (OS) and higher incidence of early death during chemotherapy when compared to patients aged < 60 years (Table 3) [7, 46, 47, 54]. These poor outcomes occur because old patients present higher prevalence of unfavorable cytogenetics and myelodysplasia, a greater incidence of multi-drug resistance (MDR) and more frequent comorbidities, which often make them unsuitable for intensive treatment [7]. Thus, while young patients tolerate intensified treatment strategies and have good outcomes, AML treatment is highly toxic and has limited application and poor outcomes among old individuals.
9
Table 3 - Treatment outcomes in acute myeloid leukemia (AML) based on age criteria [20].
Age < 60 years Age > 60 years
Complete remission (CR) (%) 65-75 40-50
Disease-free survival (%) 45 20
Early death (%) 10 25
Overall survival (OS) (%) 30 10
The net incidence of AML in older patients is expected to increase as the population continues to age, making essential the development of new therapeutic strategies [55]. Current clinical trials have focused on less-intensive therapies with the potential to be efficacious without impairing patients’ quality of life [53]. The growing understanding of specific gene mutations, chromosomal translocations and alterations in signaling pathways and gene transcription in AML has led to the development of a number of targeted agents [53, 56]. These include histone deacetylase inhibitors, FLT3 inhibitors, proteosome inhibitors, DNA methyl transferase inhibitors, among others (Table 4) [53, 56]. In addition, several studies have also been done to optimize traditional chemotherapeutics [20]. Alterations in the concentrations and new formulations are examples of these optimizations [20].
10
Table 4 - Therapeutic strategies investigated in the treatment of acute myeloid leukemia (AML) [20].
Therapeutic approach Examples
Epigenetic regulation
Histone deacetylase inhibitors: vorinostat, panobinostat, belinostat;
DNA methyl transferase inhibitors: Vidaza, Dacogen.
Differentiation-inducing therapeutics Retinoid X receptor agonists; Arsenic trioxide.
Angiogenesis inhibition Inhibition of angiogenesis: Velcade; Thalomid, Revlimid.
Inhibition of signaling pathways
Tyrosine kinase inhibitors: midostaurin, lestaurtinib, sorafenib, KW-2449, AC220;
Cell cycle inhibitors: ON 01910.Na;
Farnesyl transferase inhibitors: Zarnestra, Sarasar;
mTOR inhibitors: Afinitor, PI-103, temsirolimus, GSK21110183;
PARP inhibitors: ABT-888;
MEK1/2 inhibitors: AZD6244, AS703026, PD98059, GSK1120212;
Bcl-2 inhibitors: oblimersen, obatoclax, ABT-263;
XIAP inhibitor: AEG-35156;
Aminopeptidase inhibitors (tosedostat);
Modulation of drug resistance Valspodar, zosuquidar
Modified traditional chemotherapeutics
Nucleoside analogs: clofarabine, sapacitabine, elacytarabine;
Alkylating drugs: irofulven, Temodar, Onrigin;
Topoisomerase inhibitors: Hycamtin
Immune therapy Antibodies: Mylotarg, lintuzumab, Avastin, T-cell targeted therapy
Despite the fact that standard treatment strategies, above mentioned, are applied to the most AML subtypes, acute promyelocytic leukemia (APL) is differently treated [57]. APL is characterized by the t(15;17) chromosomal translocation and consequent expression of the fusion protein PML-RARα [57, 58]. In normal conditions and in the absence of the all-trans retinoic acid (ATRA), RARα interacts with the nuclear receptor RXR (Retinoid X receptor) forming the RARα/RXR heterodimer that binds to DNA recruiting co-repressor complexes that blocks transcription of its target genes [59, 60]. However, in the presence of physiological concentrations of ATRA, the co-repressor complexes undergo a conformational alteration that triggers their dissociation and promotes the recruitment of co-activators important for the transcription of genes involved in processes such as differentiation [61, 62]. In APL, PML-RARα
11
binds to RXR and acts as a constitutive repressor that is insensitive to physiological concentrations of ATRA [57, 63, 64]. Thus, the transcription of genes involved in differentiation is disrupted blocking the normal promyelocytic maturation [57, 63, 64]. In an attempt to overcome this problem, APL patients are treated with ATRA, a noncytotoxic agent capable of differentiate abnormal promyelocytes into mature granulocytes [65, 66]. However, despite the high CR rates (80%-90%) [65, 66], this effect is transient, lasting weeks or months, when ATRA is administered as a single agent [66, 67]. Therefore, the current standard approach consists in the administration of ATRA plus anthracycline-based chemotherapy [68]. APL patients treated with this approach present the similar high CR rates but lower relapse rate when compared to those treated with ATRA monotherapy [69]. These better outcomes seem to suggest an additive or synergistic effect of both treatment modalities [69]. Recently, some studies have demonstrated that arsenic trioxide (ATO) has also activity against APL [70], showing a CR rate >80% [71, 72]. A more recent study also showed that APL patients treated with ATRA, ATO or ATRA plus ATO present the same CR rates (> 80%), however, in patients submitted to the combination treatment, the time to achieve CR was significantly shorter and the reduction of the disease burden was greater [73]. Nevertheless, despite these results, the current recommendation for induction therapy in newly diagnosed APL remains the standard approach with ATRA plus chemotherapy [68].
2. Cytarabine and doxorubicin 2.1. Mechanisms of action
Malignant cells are characterized by high nuclear DNA replication rates and consequent extreme proliferation when compared to surrounding healthy cells [74]. Interference in DNA replication of malignant cells leads to unsuccessful DNA replication that creates DNA replication stress, which may culminate in cell death, inhibiting tumor cell expansion [75]. Therefore, the mechanistic basis for several anticancer agents consists in the interference with the machinery required for DNA replication [76]. Cytarabine (1-β-D-arabinofuranosylcytosine [ara-C]), one of the most effective chemotherapeutic agents used in the treatment of acute leukemia [77], is a nucleoside/deoxycytidine analogue that is easily taken up by transformed cells and subsequent metabolized into the nucleoside triphosphate form (ara-CTP) [78], which is a substrate for DNA
12
polymerase [79]. Several studies have reported that the incorporation of ara-CTP instead of deoxycytidine into nascent DNA strand during DNA replication is responsible for the inhibition of DNA strand elongation and unsuccessful DNA replication [80]. Moreover, evidence showed that ara-CTP - deoxycytidine substitution occurs mainly in the Okazaki fragments, inhibiting their elongation and consequently the elongation of the lagging strand during DNA replication [80]. However, the knowledge of how the ara-CTP incorporation interferes with the Okazaki fragments extension is still very scarce. Studies showed that ara-CTP incorporation affects the local structure and/or stability of newly replicated DNA, inhibiting the extension of the nascent DNA at a point distal from the site of substitution [80, 81]. Gmeiner et al. described that ara-CTP incorporation provokes an increase in the bend of the helical axis at the site of ara-CTP substitution, which may contribute to the inhibition of DNA extension [76]. Nevertheless, additional studies are required to better understand this mechanism and to improve chemotherapeutic regimens [76].
Doxorubicin, a hydroxylated daunorubicin derivate used against a broad spectrum of solid tumors, lymphomas and leukemias [82], has also been described as impairing important cellular processes involving DNA, such as DNA replication and transcription [83]. This chemotherapeutic agent is rapidly taken up into the nucleus where it binds with high affinity to DNA by classical intercalation between base pairs [84]. However, its precise mechanism of action is not fully understood and several hypotheses have been proposed [83, 85-88]. The mechanism of action most widely accepted is that doxorubicin acts as a DNA topoisomerase II inhibitor [89-91]. DNA topoisomerases II are enzymes involved in the unwinding of DNA during the replication and transcription processes [92]. These enzymes modify the topology of DNA through different steps [92]: 1) DNA topoisomerase II cleaves one strand of the DNA duplex introducing a transient enzyme-bridged DNA gate; 2) a second DNA segment passes through the enzyme-bridged DNA gate; 3) DNA topoisomerase II catalyzes the re-ligation of the cleavage duplex/double-strand DNA break and the products of the reaction are released from the enzyme. The anthracycline doxorubicin is commonly described as an inhibitor of the re-ligation reaction, leading to the accumulation of enzyme-linked double-strand DNA break complexes [89-92], which are extremely toxic to the cells [83].
13
2.2. Activation of a DNA damage response (DDR)
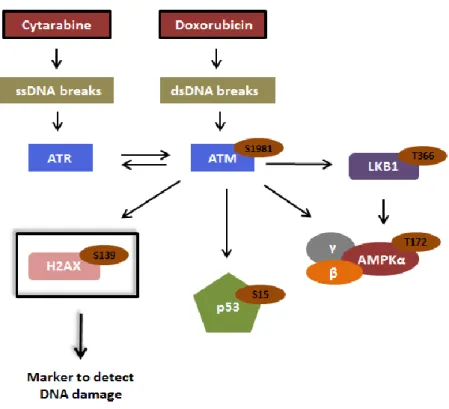
Dividing cells are under continuous assault either by environmental agents, such as UV light, or by products of normal metabolism, such as reactive oxygen intermediates, which may damage the DNA impairing the proper replication and segregation of the genome to daughter cells [93-95]. To preserve the integrity of the genome, eukaryotic cells have evolved checkpoint control mechanisms capable of detect DNA damage [93-95]. The identification of DNA damage results in the activation of a DNA damage response (DDR), which is a complex network of interacting signal transduction pathways that coordinate cell cycle transitions, DNA replication, DNA repair and cell death [96]. The major regulators of the DDR pathways are the phosphoinositide 3-kinase related protein kinases (PIKKs), including ataxia-telangiectasia mutated (ATM) and ATM and Rad3 related (ATR) [96]. ATM is mainly activated in response to double-strand DNA (dsDNA) breaks [97], while ATR is mainly activated by the presence of single-strand DNA (ssDNA) breaks, induced for example by DNA replication stress [98, 99] (Fig.3). Once activated, both ATM and ATR preferentially phosphorylate serine or threonine residues that are followed by glutamine (“SQ”/“TQ” motifs). Therefore, these proteins cross-talk and target an overlapping set of substrates that promote cell cycle arrest and activation of specific repair pathways in order to repair the damaged DNA and guarantee that progeny cells receive two accurate copies of the genome at the time of cell division [96, 99] (Fig.3). However, when DNA damage is extensive and impossible to repair, DDR pathways activate the expression of genes that induce programmed cell death, mainly described as being of apoptotic nature [96, 100] (Fig.3).
14
Figure 3 – General outline of the DNA damage response (DDR). In the presence of DNA damage, such as
dsDNA and ssDNA breaks, a DDR is activated in order to repair these abnormal structures. The central components of the DDR are the ATM protein, activated by dsDNA breaks, and ATR protein, triggered by ssDNA breaks. Activated ATM and ATR target an overlapping set of substrates/effectors that block cell cycle transitions and stimulate DNA repair. Apoptosis is induced through these pathways when DNA damage is impossible to repair. Blue and red arrows represent ATM and ATR pathway activation, respectively. Cell-cycle arrest is illustrated as a stop sign, DNA repair is represented with a DNA helix with several oval-shaped subunits and apoptosis with a tombstone. From [96].
Cytarabine and doxorubicin are chemotherapeutic agents described as inducers of DNA damage [80, 81, 89-91] and DDR pathways [101-103]. As previous referred, cytarabine inhibits the strand elongation during DNA replication [80], which results in ssDNA breaks [104] (Fig.4). On the other hand, doxorubicin inhibits the re-ligation reaction catalyzed by DNA topoisomerase II during the unwinding of DNA, leading to dsDNA breaks [89-91] (Fig.4). Therefore, the lesions induced by cytarabine result in the activation of ATR pathway [101], while the damage caused by doxorubicin activates ATM pathway [103] (Fig.4).
Under normal conditions, ATM protein resides in the nucleus as an inactive dimer or higher order multimer [105]. However, upon introduction of dsDNA breaks, induced for example by
15
doxorubicin [89-91], ATM suffers autophosphorylation at Ser1981 [103, 105], which leads to ATM dimer dissociation into monomers and ATM activation [105] (Fig.4). Although ATM protein is activated by autophosphorylation at Ser1981 upon dsDNA breaks, some studies reported that this protein is also activated by ATR, through phosphorylation at Ser1981, upon DNA replication stress induction [106] (Fig.4). Moreover, ATM protein has also been described as inducer of ATR activation [107] (Fig.4). Therefore, ATR and ATM proteins crosstalk and phosphorylate an overlapping set of substrates [106, 107] (Fig.4).
Once activated, ATM protein phosphorylates the histone H2AX at Ser139 [108], being this modification the currently most widely used marker to detect DNA damage [109-111] (Fig.4). A cyclic process is responsible for the phosphorylation of the histone H2AX over megabases of DNA flanking dsDNA breaks and for the consequent formation of an expanding platform for the recruitment of additional damage-response proteins [108], which act as scaffolding proteins that make some non-chromatin-associated substrates accessible to the activated ATM protein [112, 113]. Thus, beyond histone H2AX [108], ATM protein also phosphorylates several other effectors, such as p53 at Ser15 [114, 115], Liver kinase B1 (LKB1) at Thr366 [116] and AMP-activated protein kinase (AMPK) at Thr172 [117, 118] (Fig.4). AMPK is a heterotrimeric complex composed by one catalytic subunit, AMPKα, and two regulatory subunits, AMPKβ and AMPKγ [119] (Fig.4). Therefore, in response to DNA damage, ATM phosphorylates AMPK at Thr172 located in the α catalytic subunit [117, 118] (Fig.4). In addition to ATM and in response to DNA damage, AMPK is also phosphorylated at Thr172 (AMPKα) by LKB1 [120] (Fig.4), a serine/threonine protein kinase that was discovered 12 years ago as mutated in the Peutz-Jeghers Syndrome [121], a rare disorder that predisposes patients to multiple benign and malignant tumors including gastrointestinal, pancreatic and lung tumors [122].
16
Figure 4 – Partial schematic representation of the DNA damage response (DDR) pathway activated by the chemotherapeutic agent’s cytarabine and doxorubicin. Cytarabine induces ssDNA breaks, which
result in the activation of ATR protein. On the other hand, doxorubicin leads to the formation of dsDNA breaks, which promote the phosphorylation at Ser1981 and consequent activation of ATM. Furthermore, ATR is also activated by ATM, as well as, ATM is stimulated by ATR (through phosphorylation at Ser1981). Once activated, ATM protein phosphorylates the histone H2AX at Ser139, being this modification widely used to detect DNA damage. Beyond histone H2AX, other several substrates are phosphorylated by ATM, namely p53 at Ser15, LKB1 at Thr366 and AMPK at Thr172 (AMPKα). In response to DNA damage, AMPK is also phosphorylated at Thr172 (AMPKα) by the LKB1 protein.
p53 is an important checkpoint protein that plays a crucial role in the maintenance of genome integrity [123]. Under physiological conditions, p53 is kept at basal levels through interaction with the murine double minute 2 (MDM2) protein, an ubiquitin E3 ligase that promotes p53 ubiquitination and degradation by the proteasome [124]. However, in the presence of a stress stimulus, p53 undergoes post-translational modifications, such as the phosphorylation at Ser15 by ATM in response to DNA damage [114, 115], which disrupt p53-MDM2 complex and promotes p53 stabilization and accumulation. Once activated, p53 acts as a transcription factor that regulates the transcription of several target genes leading to cell cycle arrest, DNA repair and apoptosis if the damage is too severe to be repaired [115] (Fig.5).
17
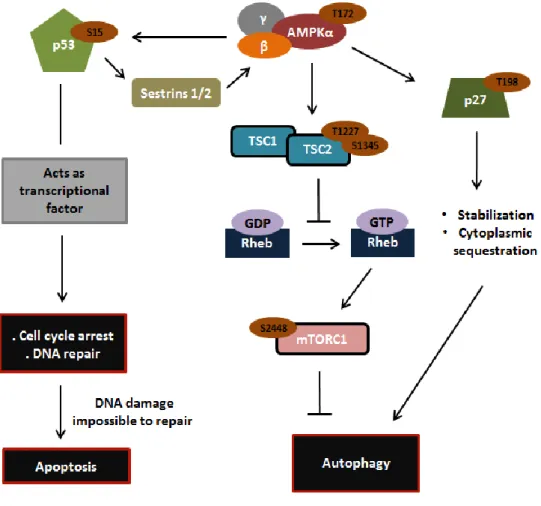
Recently, it was also reported that activation of p53 in response to DNA damage might promote the transcription and expression of the evolutionarily conserved stress-sensitive genes Sestrins 1 and 2 (Sesn 1/2), which form a complex with AMPK and TSC (tuberous sclerosis) 1:TSC2 heterodimer [125] (Fig.5). In this complex, Sesn 1/2 promote the activation of AMPK by induced proximity-dependent autophosphorylation at Thr172 (AMPKα), which, once activated, phosphorylates TSC2, present in the TSC1:TSC2 heterodimer, at Thr1227 and Ser1345 [125] (Fig.5). After activation, TSC2 functions as a GTPase-activating protein for the Ras homolog enriched in brain (Rheb) GTPase, inducing a decrease in the Rheb-GTP levels [125] (Fig.5). As the GTP-bound form of Rheb is required for mammalian target of rapamycin complex 1 (mTORC1) activation, through phosphorylation at Ser2448 [126], in response to DNA damage, mTORC1 is inactivated [125] (Fig.5). The mTORC1 complex, constituted by mTOR, raptor, PRAS40 and mLST8, regulates several important biological processes [127], such as: positively regulates protein synthesis [128, 129] and negatively regulates autophagy (a catabolic process) [130]. Therefore, in response to DNA damage occurs the inhibition of protein synthesis [125] and the activation of autophagy [131] (Fig.5). Upon DNA damage induction, AMPK not only directly phosphorylates TSC2 [125], but also phosphorylates p53 at Ser15 [132], which suggests the existence of a positive regulatory loop to further increase the activation of TSC2 with consequent inhibition of mTORC1 and induction of autophagy (Fig.5). In addition, it was also reported that, in response to DNA damage, AMPK phosphorylates p27 at Thr198 [133] (Fig.5). p27 is a member of the cyclin-dependent kinase inhibitors (CDKIs) family that functions, in the nucleus, to negatively regulate Cdk2 on Cyclin E (A)/Cdk2 complexes, preventing the progression of the cell cycle by induction of G0/G1 cell cycle arrest [134]. Nonetheless, in response to stress stimuli, including DNA damage, the phosphorylation of p27 at Thr198 by AMPK promotes p27 stabilization, exportation and sequestration in the cytoplasm, where it promotes autophagy induction [135] (Fig.5). However, the precise mechanism by which p27 stimulates autophagy is not yet known.
18
Figure 5 - Schematic representation of the interplay between AMPK and p53 and p27 in response to DNA damage. After DNA damage, p53 is phosphorylated at Ser15 and consequently activated. After activation,
p53 functions as a transcription factor that regulates the transcription of several target genes leading to cell cycle arrest, DNA repair and apoptosis when the damage is impossible to repair. As transcriptional factor, p53 may also promote the transcription and expression of Sesn 1/2, which form a complex with AMPK and TSC1:TSC2 heterodimer. In this complex, Sesn 1/2 promote the activation of AMPK by induced proximity-dependent autophosphorylation at Thr172 (AMPKα), which, once activated, phosphorylates TSC2 at Thr1227 and Ser1345. After activation, TSC2 acts as a GTPase-activating protein for the Rheb GTPase, leading to a decrease in the Rheb-GTP levels. As the Rheb-GTP-bound form of Rheb is required for mTORC1 activation, through phosphorylation at Ser2448, in response to DNA damage, mTORC1 is inhibited with consequent activation of autophagy. After DNA damage induction, AMPK also phosphorylates p53 at Ser15, suggesting the existence of a positive regulatory loop to further increase the activation of TSC2 with consequent inhibition of mTORC1 and induction of autophagy. In addition, activated AMPK also phosphorylates p27 at Thr198 promoting p27 stabilization and cytoplasmic sequestration, leading to autophagy induction.
19
The information above referred shows us that AMPK is a central/crucial player in the DDR, since this protein allows the interconnection of several molecules involved in this complex pathway.
In addition to DNA damage, the LKB1-AMPK pathway is also activated in response to metabolic/energy stresses, such as nutrient starvation (e.g. glucose or amino acid deprivation), growth factor withdrawal, hypoxia or agents that affect ATP synthesis (reviewed in [136]). These cellular stresses reduce ATP production or accelerate ATP consumption, causing a rise in the AMP:ATP ratio (reviewed in [136]). The accumulation of AMP results in the allosteric binding of AMP to the regulatory γ subunit of AMPK, which induces conformational changes in the AMPK heterotrimeric complex, improving the ability of the catalytic α subunit of AMPK to serve as a substrate for upstream kinases (reviewed in [136, 137]). LKB1 is one of the most important upstream kinases that activate AMPK, through phosphorylation at Thr172 (AMPKα), in response to energy depletion [138]. Once activated, and similar to that described for DDR (Fig.5), AMPK phosphorylates p53 at Ser15 [139], TSC2 at Thr1227 and Ser1345 [140] and p27 at Thr198 [141]. The activation of p53 induces cell cycle arrest and consequent cell proliferation inhibition [139], while the stimulation of TSC2 suppresses mTORC1 complex, which results in the inhibition of anabolic processes, such as protein synthesis [140] and activation of catabolic processes, such as autophagy [130]. The phosphorylation of p27 at Thr198 by AMPK is also described as inducing autophagy in response to metabolic stress [141]. Furthermore, recently, it was also reported that, in response to energy deprivation, AMPK can inhibit mTORC1 independently of TSC2 by phosphorylating raptor, a component of the mTORC1 complex, at Ser722 and Ser792 [142] (Fig.6). Moreover, it was also described that AMPK is capable of phosphorylating ULK1 at Ser317 and Ser777, leading to autophagy induction [143] (Fig.6).
Therefore, AMPK functions as an important sensor of cellular energy status that allows cells to coordinate energy availability with cell proliferation and regulation of anabolic and catabolic processes [136, 139, 141].
20
Figure 6 – Schematic representation of the interaction of AMPK with raptor and ULK1 in response to metabolic stress. After energy depletion, AMPK is activated through phosphorylation at Thr172 (AMPKα). Then,
AMPK can phosphorylate raptor at Ser722 and Ser792 or ULK1 at Ser317 and Ser777, promoting autophagy induction.
Given the similarities observed between the downstream effectors of AMPK in response to DNA damage and metabolic stress, it is possible that, in response to DNA damage, AMPK also phosphorylates raptor and ULK1 leading to autophagy induction (Fig.6).
Therefore, at the end of the complex DDR three main processes are affected and regulated: cell cycle, DNA repair and autophagy (Fig.7).
21
Figure 7 – Schematic representation of the interplay between DNA damage response, activated by the chemotherapeutic agent’s cytarabine and doxorubicin, and LKB1-AMPK pathway. After DNA
damage, cytarabine activates ATR, while doxorubicin activates ATM (phosphorylation at Ser1981). Furthermore, ATR is also activated by ATM, as well as, ATM is stimulated by ATR (through phosphorylation at Ser1981). Once activated, ATM phosphorylates several substrates such as histone H2AX at Ser139, p53 at Ser15, LKB1 at Thr366 and AMPK at Thr172 (AMPKα). In response to DNA damage, LKB1 is also capable of phosphorylating AMPK at Thr172 (AMPKα). p53 acts as a transcription factor that after phosphorylation at Ser15 regulates the transcription of genes involved in cell cycle arrest, DNA repair and apoptosis (when the damage is impossible to repair). Furthermore, the activation of p53 results in the transcription and expression of Sesn 1/2, which form a complex with AMPK and TSC1:TSC2 and promote the activation of AMPK by induced proximity-dependent autophosphorylation at Thr172 (AMPKα). The interaction between Sesn1/2, AMPK and TSC1:TSC2 allows the phosphorylation of TSC2 at Thr1227 and Ser1345 by activated AMPK. After activation, TSC2 functions as a
GTPase-22
activating protein that activates the Rheb GTPase, leading to a decrease in the Rheb-GTP levels and consequent mTORC1 inhibition. As mTORC1 is a negative regulator of autophagy, its inhibition results in autophagy induction. Once activated, AMPK also phosphorylates p53 at Ser15, suggesting the existence of a positive regulatory loop to further increase the activation of TSC2, and p27 at Thr198. Phosphorylation of p27 promotes the stabilization and cytoplasmic sequestration of this protein, leading to autophagy induction. Although not yet demonstrated in the DDR, it is known that in response to metabolic stress, AMPK activation, through phosphorylation at Thr172 (AMPKα), by LKB1 results in the phosphorylation of ULK1 at Ser317 and Ser777 and mTORC1 inhibition through raptor phosphorylation at Ser722 and Ser792, which stimulates autophagy induction. Therefore, it is possible that in response to DNA damage these two pathways also occur in order to promote autophagy. Adapted from Paula Ludovico (2012).
3. Cell cycle regulation in response to DNA damage
Activation of DDR promotes an arrest in the cell cycle progression, providing time for DNA repair or apoptosis induction when the damage is impossible to repair [144]. This arrest is mediated by a network of signaling pathways termed cell cycle checkpoints, which include G1, intra-S and G2/M checkpoints [144]. G1 is the first checkpoint and prevents cells with damaged DNA from entering into the S phase and replicate the abnormal DNA [145]. During this checkpoint, the activation of ATM in response to dsDNA breaks promotes the phosphorylation of checkpoint kinase 2 (Chk2), while the activation of ATR in response to ssDNA breaks results in Chk1 phosphorylation [146]. ATM and ATR may also phosphorylate MDM2 [147, 148] and p53 [114, 115] at different residues. Once activated, Chk1 or Chk2 phosphorylates Cdc25A (Cell division cycle 25 homolog A) phosphatase and p53 [144]. The phosphorylation of Cdc25A leads to its enhanced ubiquitination and proteasome-mediated degradation, which prevents the dephosphorylation of Cdk2 on Cyclin E (A)/Cdk2 complexes, promoting Cdk2 inhibition and preventing the initiation of DNA synthesis [145, 149, 150]. This checkpoint pathway targeting Cdc25A occurs rapidly and is relatively transient, arresting cell cycle progression for only some hours [149, 150]. The prolonged maintenance of G1 cell cycle arrest is achieved through a complementary pathway that involves p53 [144, 145]. The phosphorylation of p53 and MDM2, through the proteins previous mentioned, induces the stabilization and accumulation of p53, increasing its activity as transcription factor [144]. One of the key targets of p53 during G1 checkpoint is the gene that codifies the CDKI p21. After transcription and expression, p21 inhibits Cdk2 activity on Cyclin E (A)/Cdk2 complexes, preventing the transcription of genes

![Table 1 - Classification of acute myeloid leukemia (AML) according to FAB classification system [20]](https://thumb-eu.123doks.com/thumbv2/123dok_br/17576982.818469/22.892.112.775.821.1118/table-classification-acute-myeloid-leukemia-aml-according-classification.webp)
![Table 4 - Therapeutic strategies investigated in the treatment of acute myeloid leukemia (AML) [20]](https://thumb-eu.123doks.com/thumbv2/123dok_br/17576982.818469/28.892.118.775.157.768/table-therapeutic-strategies-investigated-treatment-acute-myeloid-leukemia.webp)