Duration-Frequency relationships oF heavy
rainFall in santa catarina, Brazil
(1)Álvaro José Back(2), José luiz rocha oliveira(3) & alan henn(4)
suMMary
the purpose of this study was to adjust equations that establish relationships between rainfall events with different duration and data from weather stations in the state of santa catarina, Brazil. in this study, the relationships between different duration heavy rainfalls from 13 weather stations of santa catarina were analyzed. From series of maximum annual rainfalls, and using the Gumbel-chow distribution, the maximum rainfall for durations between 5 min and 24 h were estimated considering return periods from 2 to 100 years. the data fit to the Gumbel-chow model was verified by the Kolmogorov-smirnov test at 5 % significance. the coefficients of Bell’s equation were adjusted to estimate the relationship between rainfall duration t (min) and the return period t (y) in relation to the maximum rainfall with a duration of 1 hour and a 10 year return period. likewise, the coefficients of Bell’s equation were adjusted based on the maximum rainfall with a duration of 1 day and a 10 year return period. the results showed that these relationships are viable to estimate short-duration rainfall events at locations where there are no rainfall records.
index terms: design rainfall, hydrology, drainage.
resuMo: RELAÇÕES DURAÇÃO-FREQUÊNCIA DE CHUVAS INTENSAS NO ESTADO DE SANTA CATARINA
O objetivo deste trabalho foi ajustar equações que relacionam as precipitações com diferentes durações aos dados medidos em estações pluviográficas do Estado de Santa
(1) received for publication in october 4, 2011 and approved in February 14, 2012.
(2) epagri researcher, experimental station of urussanga, rod.sc 446, km 16, zip code 88840-000, urussanga (sc), Brazil. e-mail:
(3) epagri researcher, information center of hydrometeorology and environmental resources of santa catarina/ciram, rod admar
Gonzaga 1347, itacorubi, po Box 502, zip code 88034-901, Florianópolis (sc), Brazil, e-mail: [email protected]
(4) epagri researcher, information center of hydrometeorology and environmental resources of santa catarina/ciram, rod admar
Catarina. Foram estudadas as relações entre precipitações intensas de diferentes durações de 13 estações pluviográficas do Estado de Santa Catarina. A partir das séries de chuvas máximas anuais, foram estimadas, por meio da distribuição de Gumbel-Chow, as chuvas máximas com durações variando de 5 min a 24 h, considerando-se os períodos de retorno de 2 a 100 anos. A aderência dos dados ao modelo de Gumbel-Chow foi comprovada por meio do teste de Kolmogorov-Smirnov, com nível de significância de 5 %. Ajustaram-se os coeficientes da equação proposta por Bell a fim de estimar a relação entre a chuva com duração t (min) e o período de retorno T (anos), em função da chuva máxima com período de retorno de 10 anos e duração de 1 h. Do mesmo modo, foram ajustados os coeficientes da equação de Bell, cuja base foi a chuva máxima com período de retorno de 10 anos e duração de um dia. Os valores obtidos mostram que o uso dessas relações constitui-se em alternativa viável para estimar as chuvas de curta duração em locais sem registros pluviográficos.
Termos de indexação: chuva de projeto, hidrologia, drenagem.
introDuction
Knowledge on rainfall characteristics allows a safe planning and determination of the dimensions of soil conservation structures such as terraces and contour farming. likewise, the dimensions of hydraulic structures to retain or channel surface runoff after heavy rain, e.g., drainage channels, gullies, retention basins and others are determined based on the maximum rainfall intensity with a certain probability of being equaled or exceeded and defined by the return period.
the dimensions of surface drainage works are determined by adopting values of rainfall events that occur with return periods between 5 and 100 years to design rainfall. to obtain these rains, the annual maximum series observed in more than 10 years is generally used and theoretical probability distributions are adjusted to estimate the maximum rainfall with a given return period or probability of being equaled or exceeded. For heavy rainfall events, several studies showed that the Gumbel distribution adjusts well and has therefore been widely used, although a series of annual maximum values must be available for its application (Kite, 1978; Back, 2001).
in drainage projects, it is often necessary to obtain the intensity of short-duration rainfall, usually shorter than one day. typically, the rainfall intensity is estimated based on intensity-Duration-Frequency (iDF) relationships of rainfall events. in this sense, for locations with rainfall data, it is tried to adjust heavy rainfall equations, also called iDF equations, as in the studies of Fendrich (1998), costa & Brito (1999), oliveira et al. (2000), silva et al. (2002), Back (2002), and Bazzano et al. (2007). iDF relationships are obtained by statistical analyses of long data series from rain gauges. in Brazil, it is relatively easy to obtain 1 day rainfall data. shorter rainfalls are however rarely recorded, due to the lack of
measuring equipment and when available, the measurement series are relatively short and contain numerous data errors. lima et al. (2005), oliveira et al. (2008), cassol et al. (2008), and Back (2009) report the lack of long series of precipitation data, mainly of rainfall.
Material anD MethoDs
Daily graphs of meteorological stations of the Brazilian institute of Meteorology (inmet) and of an agricultural institute of research and rural extension of santa catarina (epagri) from locations listed in table 1 were used (Figure 1).
rainfall charts were digitized and annual maximum rainfall series were determined (durations of 5, 10, 15, 20, 25, 30, 45, 50, 55, 60, 75, 90, 105, 120, 180, 240, 300, 360, 420, 480, 600, 720, 840, 960, 1080, 1200, 1320, and 1440 min) as well as the maximum 1 day rainfall, defined as the total rainfall of one day, accumulated until 9 a.m. For each duration, rainfall values for return periods of 2, 5, 10, 20, 25, 50, and 100 years were also estimated, applying the Gumbel-chow distribution as:
(1)
where: PT - maximum precipitation with return
period t (years, mm); - average of annual maximum series (mm); S - standard deviation of annual maximum series (mm); Yn – average of
reduced variable; Sn - standard deviation of reduced
variable; and Y - reduced variable estimated by:
(2)
where: t is the return period (years).
coefficients of the equation used by Bell (1969) were adjusted, with the height of the estimated rainfall
events, in relation to the maximum rainfall for a return period of 10 years and duration of 1 h (60 min) (p1060),
as:
(3)
where: a, b, c, d, e - empirical coefficients; - estimated precipitation for return period t (years) and duration t (min); - observed precipitation for a return period of 10 years and duration of 1 h (60 min).
results were compared to the estimates obtained with the coefficients used by Bell (1969) given by:
(4)
and the equation proposed by uehara et al. (1980) for Brazil (based on data of 26 weather stations) and são paulo with the respective mathematical expressions:
(5)
(6)
the great majority of rainfall data is measured in pluviometers, which provide only the daily total precipitation. to enable the estimation of design rainfalls with surface runof from maximum rainfall events measured in pluviometers, the coefficients of Bell’s equation were also adjusted in relation to the maximum rainfall with a return period of 10 years and duration of 1 day, given by:
(7)
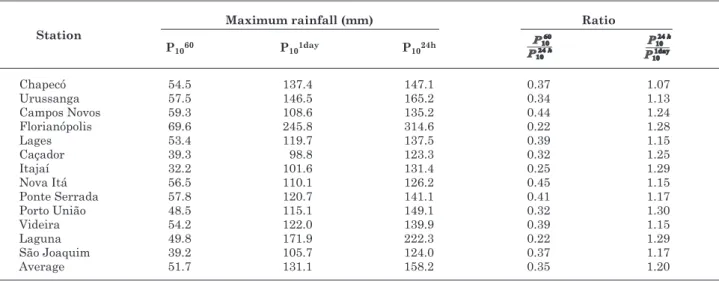
can be explained by the fact at that some stations extreme values of heavy rainfall with 24 h duration were measured, resulting in a lower relationship between 1 h and 24 h rainfall. the relationship between maximum rainfall of 24 h and rainfall of 1 day varied from 1.30 in porto união to 1.07 in chapecó, with a mean of 1.20. occhipinti & santos (1966), using a data series from 1928 to 1965, of são paulo, observed a mean relationship of 1.14. Genovez & pegoraro (1998), analyzing data of 23 rain gauges of são paulo state, obtained a minimum value of 1.03 and maximum value of 1.17, with an average value of 1.13. the environmental sanitation technology company – cetesb (1986) indicated the value of 1.14 based on data of several rainfalls of Brazil.
the coefficients of the equations for each station were adjusted for the estimate of rainfall relationship for return period t and duration t, in terms of the estimated rainfall for 10 year return period and 60 min duration (p1060) (table 3). the coefficients
of the general equation for santa catarina were also adjusted considering data from all stations. the relationships between rainfall events with a 10 year return period and duration t min (p10t) obtained in
this study for santa catarina were compared with the global values obtained by Bell (1969) and the values proposed for Brazil and são paulo by uehara et al. (1980) (Figure 2). the standard error values of rainfall estimates were adjusted with each equation and also standard error of estimate in relation to the values estimated by the equations with global validity for Brazil and the general equation for santa catarina as well as the equations valid for the coastal area (itajaí, Florianópolis and laguna) and for the interior (other stations) of santa catarina (table 4). using the equation adjusted for santa catarina and for 10 min rainfalls, the expression estimates rainfall around 16 % to 19 % lower than Bell’s estimates, for return periods from 5 to 100 years, respectively.
where: - estimated precipitation for a return period of 10 years and duration of 1 day.
the coefficients were adjusted according to the methodology described by Back (2009), minimizing the function s, given by:
(8)
where: s – sum of squared deviations between precipitation estimated by the equation 3 or 7 and the observed precipitation; t – rainfall duration, min; t - return period, years; G – estimated precipitation using the Gumbel-chow distribution for duration t and return period t.
the coefficients of equation were adjusted for each one of the weather stations and the coefficients of the general equation were also obtained covering all weather stations of santa catarina. since the results indicated different relationships, the stations of itajaí, Florianópolis and laguna were grouped in “coastal stations”, for lying at a distance of less than 10 km from the atlantic ocean. the others were all grouped as “interior stations”. thus, the general equations were adjusted and evaluated for the groups of the stations of the coastal area and the interior of the state.
results anD Discussion
the relationship between 1 h precipitation and 24 h precipitation (table 2) varied from 0.22 in Florianópolis and laguna to 0.45 at the station of nova itá, with an average value of 0.35. the environmental sanitation technology company (cetesB, 1986) indicates an average relationship of 0.42 for several weather stations of Brazil, which is higher than that observed for most stations of santa catarina. these differences
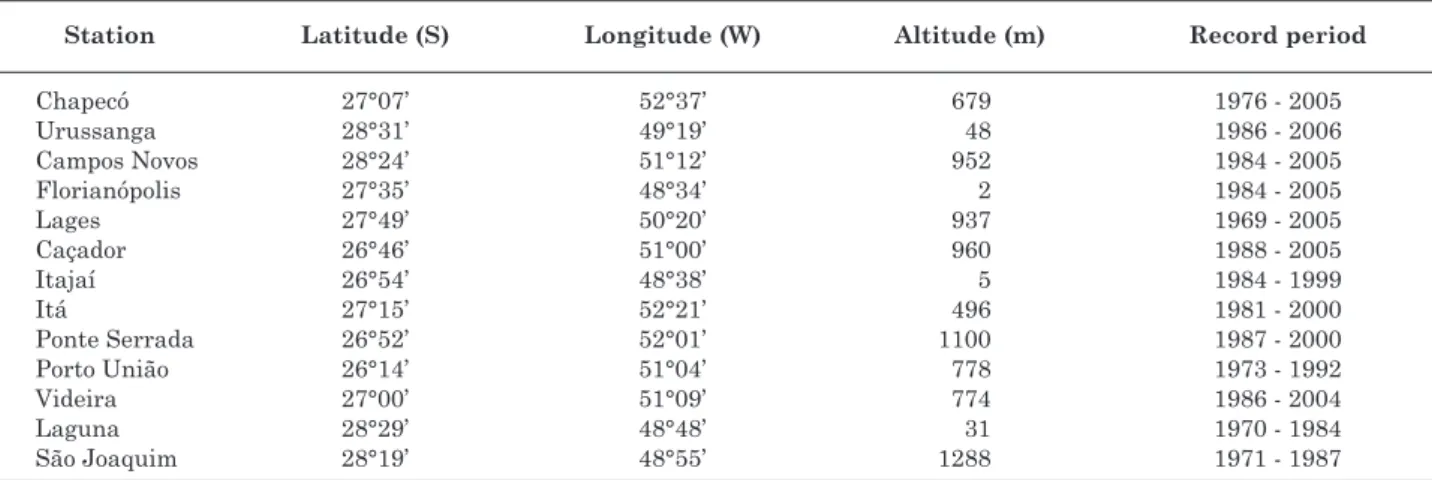
table 1. Geographic coordinates and data series of weather stations used to determine the duration-frequency relationships
station latitude (s) longitude (W) altitude (m) record period
chapecó 27°07’ 52°37’ 679 1976 - 2005
urussanga 28°31’ 49°19’ 48 1986 - 2006
campos novos 28°24’ 51°12’ 952 1984 - 2005
Florianópolis 27°35’ 48°34’ 2 1984 - 2005
lages 27°49’ 50°20’ 937 1969 - 2005
caçador 26°46’ 51°00’ 960 1988 - 2005
itajaí 26°54’ 48°38’ 5 1984 - 1999
itá 27°15’ 52°21’ 496 1981 - 2000
ponte serrada 26°52’ 52°01’ 1100 1987 - 2000
porto união 26°14’ 51°04’ 778 1973 - 1992
videira 27°00’ 51°09’ 774 1986 - 2004
laguna 28°29’ 48°48’ 31 1970 - 1984
table 2. estimated maximum rainfall for a 10 year return period (t) and duration of 1 hour ( ), 1 day ( ) and 24 hours ( ) for the weather stations of santa catarina
station
Maximum rainfall (mm) ratio
p1060 p101day p1024h
chapecó 54.5 137.4 147.1 0.37 1.07
urussanga 57.5 146.5 165.2 0.34 1.13
campos novos 59.3 108.6 135.2 0.44 1.24
Florianópolis 69.6 245.8 314.6 0.22 1.28
lages 53.4 119.7 137.5 0.39 1.15
caçador 39.3 98.8 123.3 0.32 1.25
itajaí 32.2 101.6 131.4 0.25 1.29
nova itá 56.5 110.1 126.2 0.45 1.15
ponte serrada 57.8 120.7 141.1 0.41 1.17
porto união 48.5 115.1 149.1 0.32 1.30
videira 54.2 122.0 139.9 0.39 1.15
laguna 49.8 171.9 222.3 0.22 1.29
são Joaquim 39.2 105.7 124.0 0.37 1.17
average 51.7 131.1 158.2 0.35 1.20
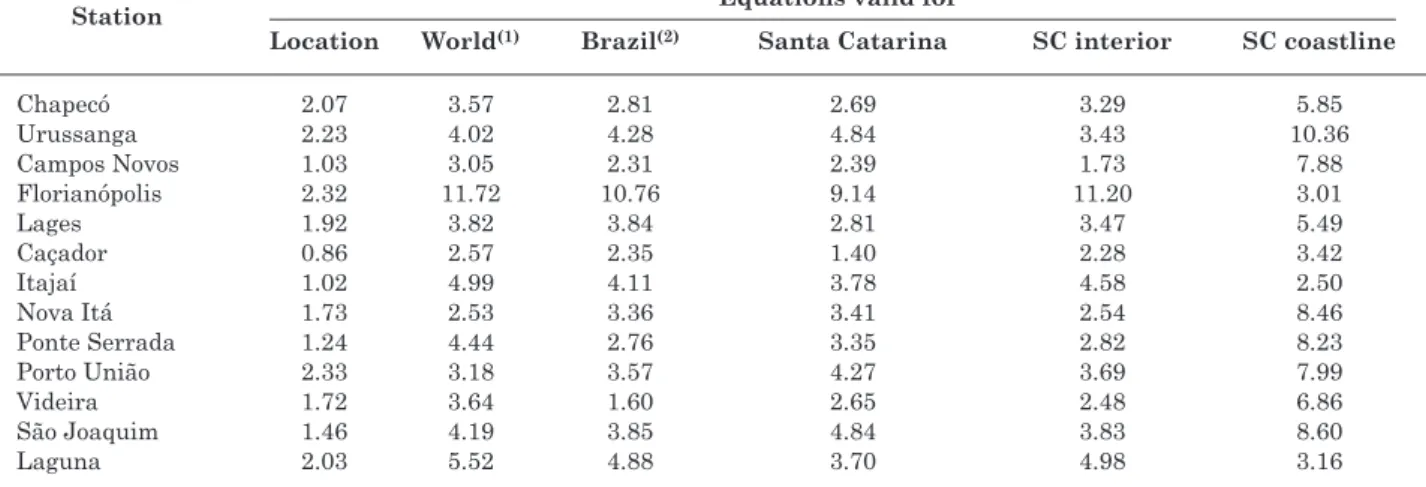
When compared to the values adjusted for Brazil, the differences of precipitation are lower than 3 %. Genovez et al. (1994) compared five generalized iDF equations, including the ones proposed by Bell (1969) and by uehara et al. (1980) for Brazil and são paulo, with data from nine weather stations of são paulo state, and verified that the results of generalized iDF equations were similar and in general, the absolute deviations from the estimated values by the equations with the observed values were lower than 15 %, although for some stations this deviation reached 45 %. When adjusting the equations for each weather station, a reduction of the standard error of estimate higher than 50 % was observed at most stations. the data (table 4) confirm that the establishment of local equations results in more accurate rainfall estimates than the regional or global equations. on the other hand, despite the differences between the values of
rainfall relationships, the behavior pattern is similar (Figure 2).
in figure 3 there are the relationships between rainfall of duration t min and 10 year return period with rainfall p1060, where a differentiated behavior
between the stations is observed. For durations up to 60 min the obtained coefficients for the stations of itajaí, Florianópolis and laguna estimate lower relationships than the ones obtained for the other stations and for durations higher than 60 min. those stations measured values higher than the other ones (Figure 3a). For 10 year return period and 10 min rainfalls, the relationships vary from 0.31 in Florianópolis to 0.49 in porto união. For 120 min rainfalls the relationships vary from 1.58 in Florianópolis to 1.20 in urussanga. For rainfalls longer than 120 min the highest relationships were obtained for the stations of Florianópolis and itajaí with differences above 30 % of the average value obtained for santa catarina (Figure 3b). these variations can be caused by the fact that some stations measure extreme values of heavy rainfall for 24 h duration, resulting in a lower relationship between 1 h rainfall and 24 h rainfall, as observed for the stations of itajaí and Florianópolis (table 2).
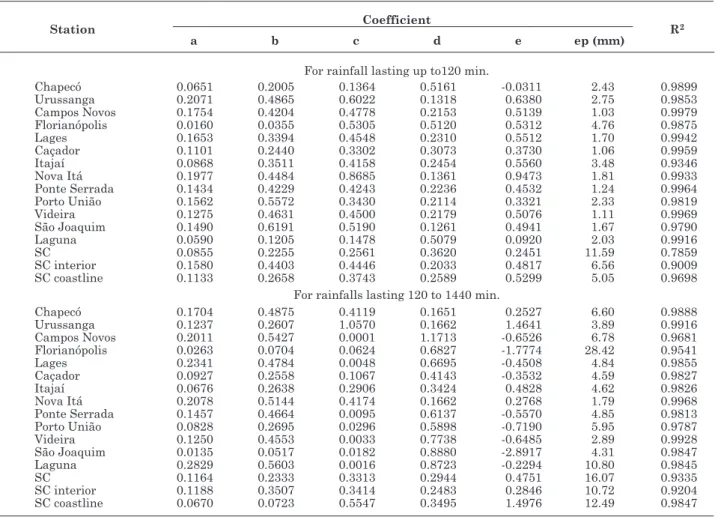
the coefficients adjusted for rainfall with a 10 year return period and 1 day duration (p101day) (table 5). as
the values of standard error of estimate and coefficients r2 obtained were equivalent to those obtained in
table 3, it was observed that the coefficients of the equation presented in table 5 can be used in locations where only information of rainfall for 1 day duration is available. these adjusted equations have practical application for estimates of heavy rainfall of short duration in locations where there are only data of daily rainfall observed with rain gauges.
Figure 2. relationships between rainfall events for 10 year return period and duration t min (p10t)
table 3. coefficients of equation used to estimate precipitation for return period t years and duration t min , in relation to the observed precipitation for a 10 year return period and 60 min duration ( ) and standard deviation (ep) for the weather stations of santa catarina
station coefficients r2
a b c d e ep (mm)
For rainfalls lasting up to 120 min
chapecó 0.1286 0.4032 0.2429 0.4521 0.0830 2.07 0.9913
urussanga 1.3372 3.1844 1.4038 0.0315 1.4408 2.23 0.9889
campos novos 0.2164 0.5191 0.7080 0.2156 0.7613 1.03 0.9979
Florianópolis 0.0679 0.1505 0.1612 0.7172 -0.1600 2.32 0.9955
lages 0.2467 0.5079 0.6235 0.2429 0.7541 1.92 0.9942
caçador 0.1482 0.3209 0.3367 0.4023 0.2674 0.86 0.9973
itajaí 0.0429 0.1681 0.0766 0.8726 -0.8701 1.02 0.9944
nova itá 0.5985 1.3643 1.1348 0.0809 1.2136 1.73 0.9939
ponte serrada 0.1996 0.5920 0.5938 0.2321 0.6281 1.24 0.9964
porto união 0.2034 0.7259 0.6208 0.2121 0.6003 2.33 0.9819
videira 0.1945 0.7062 0.6348 0.2237 0.7142 1.72 0.9969
são Joaquim 0.8051 3.3324 1.7470 0.0265 1.7582 1.46 0.9840
laguna 0.1085 0.2211 0.2711 0.5120 0.1570 2.03 0.9916
sc 0.1660 0.4417 0.4552 0.3178 0.4674 4.18 0.9663
sc interior 0.2567 0.7083 0.7340 0.1858 0.8045 3.00 0.9791
sc coastline 0.0691 0.1604 0.1813 0.6762 -0.1605 2.90 0.9895
For rainfalls lasting 120 - 1440 min
chapecó 0.2244 0.6626 0.4601 0.2291 0.1706 2.23 0.9962
urussanga 0.1963 0.4680 0.1919 0.3818 -0.1392 6.20 0.9913
campos novos 0.2375 0.6156 0.0001 1.2368 -1.0353 5.95 0.9702
Florianópolis 0.1047 0.2093 0.0493 0.7133 -2.0124 21.27 0.9753
lages 0.2897 0.7271 0.0015 0.8853 -0.8673 3.16 0.9916
caçador 0.2009 0.5177 0.5524 0.2571 0.4802 9.67 0.9709
itajaí 0.0541 0.1877 0.0582 0.7048 -3.3157 2.14 0.9965
nova itá 0.2490 0.5516 0.7102 0.1672 0.4817 2.24 0.9966
ponte serrada 0.2411 0.8432 0.0129 0.5988 -0.6570 4.31 0.9831
porto união 0.1574 0.5123 0.0167 0.6930 -1.0608 6.06 0.9781
videira 0.1590 0.5639 0.0082 0.7342 -1.1158 2.89 0.9927
são Joaquim 0.1547 0.5602 0.0003 1.2610 -1.1668 5.78 0.9744
laguna 0.1153 0.2493 0.0085 0.9250 -2.0989 12.29 0.9814
sc 0.0660 0.1441 0.0492 0.6855 -3.1844 35.15 0.6814
sc interior 0.0736 0.2169 0.0347 0.6594 -2.5707 14.46 0.8564
sc coastline 0.0717 0.0794 0.0845 0.7151 -3.1515 15.21 0.9783
table 4. standard deviation of estimates of some general equations used to estimate precipitation for return period t years and duration t min ( ), in terms of the observed precipitation for 10 year return period and 60 min duration ( ), for the weather stations of santa catarina
station equations valid for
location World(1) Brazil(2) santa catarina sc interior sc coastline
chapecó 2.07 3.57 2.81 2.69 3.29 5.85
urussanga 2.23 4.02 4.28 4.84 3.43 10.36
campos novos 1.03 3.05 2.31 2.39 1.73 7.88
Florianópolis 2.32 11.72 10.76 9.14 11.20 3.01
lages 1.92 3.82 3.84 2.81 3.47 5.49
caçador 0.86 2.57 2.35 1.40 2.28 3.42
itajaí 1.02 4.99 4.11 3.78 4.58 2.50
nova itá 1.73 2.53 3.36 3.41 2.54 8.46
ponte serrada 1.24 4.44 2.76 3.35 2.82 8.23
porto união 2.33 3.18 3.57 4.27 3.69 7.99
videira 1.72 3.64 1.60 2.65 2.48 6.86
são Joaquim 1.46 4.19 3.85 4.84 3.83 8.60
laguna 2.03 5.52 4.88 3.70 4.98 3.16
conclusions
1. the relationships between heavy rainfalls lasting between 10 and 120 min for santa catarina show differences below 20 % of the relationships obtained by
table 5. coefficients of equation used to estimate precipitation for return period t years and duration t min , in terms of the observed precipitation for a 10 year return period and 1 day duration ( ) and standard deviation of estimate (ep) for the weather stations of santa catarina
station coefficient r2
a b c d e ep (mm)
For rainfall lasting up to120 min.
chapecó 0.0651 0.2005 0.1364 0.5161 -0.0311 2.43 0.9899
urussanga 0.2071 0.4865 0.6022 0.1318 0.6380 2.75 0.9853
campos novos 0.1754 0.4204 0.4778 0.2153 0.5139 1.03 0.9979
Florianópolis 0.0160 0.0355 0.5305 0.5120 0.5312 4.76 0.9875
lages 0.1653 0.3394 0.4548 0.2310 0.5512 1.70 0.9942
caçador 0.1101 0.2440 0.3302 0.3073 0.3730 1.06 0.9959
itajaí 0.0868 0.3511 0.4158 0.2454 0.5560 3.48 0.9346
nova itá 0.1977 0.4484 0.8685 0.1361 0.9473 1.81 0.9933
ponte serrada 0.1434 0.4229 0.4243 0.2236 0.4532 1.24 0.9964
porto união 0.1562 0.5572 0.3430 0.2114 0.3321 2.33 0.9819
videira 0.1275 0.4631 0.4500 0.2179 0.5076 1.11 0.9969
são Joaquim 0.1490 0.6191 0.5190 0.1261 0.4941 1.67 0.9790
laguna 0.0590 0.1205 0.1478 0.5079 0.0920 2.03 0.9916
sc 0.0855 0.2255 0.2561 0.3620 0.2451 11.59 0.7859
sc interior 0.1580 0.4403 0.4446 0.2033 0.4817 6.56 0.9009
sc coastline 0.1133 0.2658 0.3743 0.2589 0.5299 5.05 0.9698
For rainfalls lasting 120 to 1440 min.
chapecó 0.1704 0.4875 0.4119 0.1651 0.2527 6.60 0.9888
urussanga 0.1237 0.2607 1.0570 0.1662 1.4641 3.89 0.9916
campos novos 0.2011 0.5427 0.0001 1.1713 -0.6526 6.78 0.9681
Florianópolis 0.0263 0.0704 0.0624 0.6827 -1.7774 28.42 0.9541
lages 0.2341 0.4784 0.0048 0.6695 -0.4508 4.84 0.9855
caçador 0.0927 0.2558 0.1067 0.4143 -0.3532 4.59 0.9827
itajaí 0.0676 0.2638 0.2906 0.3424 0.4828 4.62 0.9826
nova itá 0.2078 0.5144 0.4174 0.1662 0.2768 1.79 0.9968
ponte serrada 0.1457 0.4664 0.0095 0.6137 -0.5570 4.85 0.9813
porto união 0.0828 0.2695 0.0296 0.5898 -0.7190 5.95 0.9787
videira 0.1250 0.4553 0.0033 0.7738 -0.6485 2.89 0.9928
são Joaquim 0.0135 0.0517 0.0182 0.8880 -2.8917 4.31 0.9847
laguna 0.2829 0.5603 0.0016 0.8723 -0.2294 10.80 0.9845
sc 0.1164 0.2333 0.3313 0.2944 0.4751 16.07 0.9335
sc interior 0.1188 0.3507 0.3414 0.2483 0.2846 10.72 0.9204
sc coastline 0.0670 0.0723 0.5547 0.3495 1.4976 12.49 0.9847
Bell (1969) and differences below 3 % of the relationships indicated by uehara et al. (1980) for Brazil.
2. equations of itajaí, Florianópolis and laguna located in the coastal area of santa catarina present
differentiated relationships from the other stations of the interior of the state.
3. the relationship of maximum rainfall for a 10 year return period and 24 h duration and of the maximum rainfall in 1 day of the different stations varied between 1.07 and 1.30, with an average of 1.20.
4. the relationships based on the maximum rainfall for 1 day duration and 10 year return period present a standard error of estimate equivalent to that obtained based on rainfall for 1 h duration and 10 year return period and represents an alternative to estimate heavy rainfalls at locations where no rainfall data are available.
literature citeD
BacK, a.J. relações entre precipitações intensas de diferentes durações ocorridas no município de urussanga, sc. r. Bras. eng. agríc. amb., 13:170-175, 2009.
BacK, a.J. seleção de distribuição de probabilidade para chuvas diárias extremas do estado de santa catarina. r. Bras. Meteorol., 16:211-222, 2001.
BacK, Á.J. chuvas intensas e chuva de projeto de drenagem superficial para o estado de santa catarina. Florianópolis, epagri, 2002. 56p.
Bazzano, M.G.p.; eltz, F.l.F. & cassol, e.a. erosividade, coeficiente de chuvas, padrões e período de retorno das chuvas de quaraí, rs. r. Bras. ci. solo, 31:1205-1217, 2007. Bell, F.G. Generalized rainfall-duration-frequency relationships.
J. hydr. Division – asce, 95:311-327, 1969.
cassol, a.e.; eltz, F.l.F.; Martins, D.; leMos, a.M.; liMa, v.s. & Bueno, a.c. erosividade, padrões hidrológicos, período de retorno e probabilidade de ocorrências das chuvas em são Borja, rs. r. Bras. ci. solo, 32:1239-1251, 2008.
coMpanhia De tecnoloGia De saneaMento aMBiental - cetesB. Drenagem urbana – manual de projeto. são paulo, 1986. 464p.
costa, a.r. & Brito, v.F. equações de chuva intensa para Goiás e sul de tocantins. in: siMpÓsio Brasileiro De recursos hÍDricos, 13. Belo horizonte, 1999. anais... Belo horizonte: aBrh, 1999. cD roM.
FenDrich, r. chuvas intensas no estado do paraná (cidades de palmas e são Miguel do iguaçu). curitiba, pucpr, 1998. 57p.
Genovez, a.M. & peGoraro, r.c.F. análise e avaliação de equações de chuvas intensas generalizadas. in: conGresso latinoaMericano De hiDrÁulica, 18., oaxaca, 1998. anais... oaxaca, iahr, 1998. v.1. p.369-379.
Genovez, a.M.; zuFFo, a.c. & Borri Genovez, a.i. relação entre chuvas intensas de diferente duração e avaliação das equações de chuvas generalizadas. in: conGresso latinoaMericano De hiDrÁulica, 16., santiago, 1994. anais... santiago, iahr, 1994. v.3. p.279-290.
Genovez, a.M. & zuFFo, a.c. chuvas intensas no estado de são paulo: estudos existentes e análise comparativa. r. Bras. rec. hídr., 5:45-58, 2000.
Kite, G.h. Frequency and risk analyses in hydrology. Fort collins, Water resources publications, 1978. 224p. liMa, h.M.F.; Mata, i.p. & liMa, a.v.F. aplicação e validação
de um simulador estocástico de variáveis climáticas: o caso da precipitação. ing. Água, 12:27-37, 2005.
occhipinti, a.G. & santos, p.M. relações entre as precipitações máximas de um dia e de 24 horas na cidade de são paulo. são paulo, iau/usp, 1966. 10p.
oliveira, l.F.c.; antonini, J.c.; GrieBeler, n.; Fioreze, a.p. & silva, M.a.s. Métodos de estimativa de precipitação máxima para o estado de Goiás. r. Bras. eng. agríc. amb., 12:620-625, 2008.
oliveira. l.F.; cortes, F.c.; BarBosa, F.o.a.; roMÃo, p.a. & carvalho, D.F. estimativa das equações de chuvas intensas para algumas localidades de Goiás pelo método da desagregação de chuvas. pesq. agropec. trop., 30:23-27, 2000.
silva, D.D.; GoMes Filho, r.r.; prusKi, F.F.; pereira, s.B. & novaes, l.F. chuvas intensas no estado da Bahia. r. Bras. eng. agric. amb., 6:362-367, 2002.