Department of Information Science and Technology
A Predictive Maintenance Approach based in Big Data
Analysis
João Pedro Gonçalves da Silva
Dissertation submitted as partial fulfilment of the requirements for the degree of Master’s in Business Intelligence
Supervisor:
PhD João Carlos Ferreira, Assistant Professor, ISCTE – Instituto Universitário de Lisboa (ISCTE-IUL)
“I started from the bottom Now I’m still at the bottom Never Rise, I fall
Every Season is Autumn”
Acknowledgments
É difícil conseguir expressar em apenas duas páginas o quanto estou agradecido a todas as pessoas que estiveram presentes durantes estes últimos dois anos de mestrado. De certa forma, estas páginas não parecem ser suficientes para atingir o seu propósito.
Antes demais, gostaria de agradecer ao meu Orientador, João Carlos Ferreira, que com esta tese me conseguiu desafiar, permitindo-me assim desenvolver as minhas capacidades e consolidar todo o conhecimento que adquiri ao longo deste mestrado. A sua capacidade crítica e apoio foram peças fulcrais para atingir este resultado.
A toda a equipa do INOV e HFA, um grande obrigado pelo interesse e, acima de tudo, pela vontade demonstrada ao longo deste ano no projeto.
Pai e Mãe, parece que o barco partiu e eu não fiquei no porto a ver navios, hum? É difícil expressar o quanto vos agradeço. Um obrigado por estes dois anos seria insuficiente. Sou-vos grato por tudo, por 23 anos e 352 dias a aturarem-me. Se cheguei aqui hoje foi graças à vossa dedicação e sou capaz de atravessar fogo por vós. Obrigado por todos os conselhos e conhecimento que me passaram e passam diariamente, por todas as vezes em que usaram a vossa “bola de cristal” e, mesmo sem dados ou modelos preditivos, conseguiram adivinhar o futuro e aconselhar o caminho certo a seguir. Obrigado por me terem ensinado a ser como sou hoje e por me terem dado o melhor que dispunham para eu poder atingir sempre os meus objetivos.
Xana, gostaria de escrever em francês, mas o meu domínio de tal dialeto ainda consegue ser inferior ao que possuo de Engenharia Civil. Ainda assim, e cingindo-me aquilo que sei, obrigado pelas conversas às seis da manhã depois das habituais noitadas e por seres a única que compreende verdadeiramente o meu sentido de humor, esse que pode facilmente ser comparado ao de uma criança de cinco anos. Mesmo a mais de 1500 km de distância parece que estás cá comigo todos os dias.
Ricardo, depois disto podes ter a certeza de que vamos jogar um FIFA… até te deixo ganhar. Fora de brincadeiras, como é óbvio isso não vai acontecer. Obrigado por estares sempre presente. Vir para Lisboa com 17 anos foi provavelmente um dos passos mais difíceis da minha vida, e saber que tinha cá alguém com quem podia contar e confiar foi o melhor que podia ter acontecido. Obrigado por tudo, sou um sortudo em ter um Irmão como tu na vida. Não me irei esquecer nos próximos natais e aniversários… Ahah
Á minha avó e tio por todo o apoio e preocupação que tiveram comigo, por todo o interesse e motivação para conseguir dar este passo.
Ao meu primo António, a quem eu devo um profundo obrigado por toda a sua preocupação em eu me tornar a melhor pessoa possível. Ensinaste-me uma das lições mais valiosas que tive até hoje.
Ao Duarte, à Pipas, ao Cruz, ao Batalha, ao Sheng, ao Pedro e ao Renato pela compreensão em todos os momentos em que tive que dizer que não e não consegui estar presente. Sei que foi difícil, mas obrigado pela vossa paciência e por terem manifestado todo interesse para que esta fase corresse o melhor possível.
Ao Diogo, uma das pessoas que me acompanhou ao longo desta tese, Bakayaro
Konoyaro. Obrigado pela oportunidade de podermos trabalhar juntos, sem sombra de
dúvidas foram os trabalhos que mais gostei de fazer até hoje. Obrigado por todas as boleias e motivação que me deste, e por estares sempre presente, principalmente nesta fase final do mestrado. És uma pessoa fantástica. Obrigado por termos partilhado este caminho juntos e espero que venham mais anos a partilhar risos e conversas.
A todos os meus colegas e funcionários do ISCTE-IUL, em particular aos seguranças Rui e Edgar pela paciência que tiveram durante estes anos. Foram pessoas que fiquei a conhecer cada vez melhor em cada noite que passei no ISCTE, uma casa que durante seis anos me acolheu de braços abertos.
À professora Elsa Cardoso, por ter despertado o meu interesse por Sistemas Integrados de Apoio à Decisão e por ter sido um dos principais catalisadores que me fez matricular neste mestrado. Resumidamente, obrigado… “*Drops the mic*”
Por último, Mags isto não é suficiente para te agradecer. Sabes que lá no fundo se fosse a escrever tinha suficiente para fazer um livro. Não é simples dizer isto, mas obrigado. Obrigado por estares sempre presente, nos bons e nos maus momentos, e me motivares sempre a continuar mesmo quando tudo corria mal. Esta tese foi uma perfeita sintonia de altos e baixos que me testou em todos os limites e tu estiveste sempre pronta para me ajudar a ver que isto era o desafio que eu tanto procurava. Tenho imenso respeito por ti, pela tua capacidade de nunca desistir e por quereres sempre o melhor para mim.
A todos vós, porque sem vocês eu não estaria nesta posição. Sem vocês eu não tinha conseguido chegar onde cheguei. Obrigado por tudo o que fizeram por mim.
Resumo
Através da evolução dos sistemas de informação (SI), o fluxo de dados atingiu novos limites, permitindo assim às empresas desenvolver diferentes focos e aplicar novas perspetivas nos departamentos fulcrais à sua atividade, tais como produção, logística e, mais especificamente, a manutenção. Esta última componente evolui paralelamente à indústria, evidenciando novos desenvolvimentos em cada iteração da mesma. Particularmente, a quarta revolução industrial destacou-se pela capacidade de conectar máquinas entre si e pela evolução posterior do processo de extração de dados. Assim, surgiu uma nova perspetiva focada na utilização dos dados extraídos para resolução de problemas. Consequentemente, esta inovação fomentou uma redefinição das prioridades nas decisões tomadas relativas à manutenção, dando primazia à compreensão dos dados gerados. Por conseguinte, a correta elaboração de um plano de implementação de manutenção preditiva (MP) destaca-se como um passo fulcral para as empresas. Este plano tem como objetivo permitir uma abordagem mais segura, possibilitando assim alocar os recursos estrategicamente, reduzindo o risco e potenciando a recompensa. Mediante a análise de múltiplas abordagens de MP, é proposto um modelo genérico que reúne um conjunto diretrizes. Este tem intuito de auxiliar os departamentos de manutenção que pretendem compreender a viabilidade da instalação de uma solução de MP na empresa. A fim de perceber a utilidade dos artefactos desenvolvidos, foi realizada uma aplicação prática do modelo numa pequena e média empresa (PME).
Palavras-chave: Indústria 4.0; Manutenção Preditiva; Big Data; Data Mining;
Abstract
With the evolution of information systems, the data flow escalated into new boundaries, allowing enterprises to further develop their approach to important sectors, such as production, logistic, IT and especially maintenance. This last field accompanied industry developments hand in hand in each of the four iterations. More specifically, the fourth iteration (Industry 4.0) marked the capability to connect machines and further enhance data extraction, which allowed companies to use a new data-driven approach into their specific problems. Nevertheless, with a wider flow of data being generated, understanding data became a priority for maintenance-related decision-making processes. Therefore, the correct elaboration of a roadmap to apply predictive maintenance (PM) is a key step for companies. A roadmap can allow a safe approach, where resources may be placed strategically with a ratio of low risk and high reward. By analysing multiple approaches to PM, a generic model is proposed, which contains an array of guidelines. This combination aims to assist maintenance departments that wish to understand the feasibility of implementing a predictive maintenance solution in their company. To understand the utility of the developed artefact, a practical application was conducted to a production line of HFA, a Portuguese Small and Medium Enterprise.
i
Index
1 Introduction ...1
1.1 Research Problem and Motivation ...1
1.2 Research Aim ...2
1.3 Research Contribution ...3
1.4 Research Methodology ...4
2 State of the art ...6
2.1 Industry 4.0 ...6 2.1.1 Cyber-Physical Systems ...7 2.1.2 Internet of Things ...8 2.1.3 Big Data ... 10 2.2 Predictive Maintenance ... 12 2.3 Data Mining ... 15 3 Case Studies ... 21
3.1 Case A - Pattern Recognition in an SLM machine ... 21
3.2 Case B - Wind Turbine Prediction ... 24
3.3 Case C - Predictive Maintenance in Metallurgic Industry... 27
3.4 Case D - Predictive maintenance in Rail network ... 31
3.4.1 Alarm Prediction ... 31
3.4.2 Bad Truck/wheel prediction ... 33
3.5 Case E - Machine learning in electric motors ... 35
4 Predictive Maintenance Model in Industry 4.0 ... 38
4.1 Generic Predictive Maintenance Model ... 38
4.1.1 Data Extraction ... 40
4.1.2 Data Prediction ... 41
4.2 Guidelines roadmap ... 43
5 HFA Business Case ... 45
5.1 Company Description ... 45
5.2 Production Layout ... 46
5.3 Project Origin ... 51
5.4 Model & Guidelines application ... 53
5.4.1 Situation Assessment ... 54
ii
5.4.3 Data Storage ... 56
5.4.4 Feature Selection ... 57
5.4.5 Data Categorization ... 59
5.4.6 Dataset and Model preparation ... 59
5.4.7 Result Analysis ... 59
5.5 Continuous Information Lifecycle ... 60
5.5.1 Dashboards... 62
6 Conclusions ... 66
6.1 Contributions ... 66
6.2 Limitations and Future Work ... 68
References ... 70
Annex ... Erro! Marcador não definido. Annex A ... 75 Annex B... 76 Annex C... 77 Annex D ... 78 Annex E ... 80 Annex F ... 81 Annex G ... 82 Annex H ... 83 Annex I ... 85 Annex J ... 86 Annex K ... 90 Annex L ... 91 Annex M ... 93 Annex N ... 94 Annex O ... 95 Annex P ... 97
iii
Table of Figures
Figure 1 - The three V's of Big Data (Russom, 2011) ... 11
Figure 2 - CRISP-DM Model (Jenke, 2018) ... 17
Figure 3 - Methodology (Uhlmann et al., 2017) ... 23
Figure 4 - Model used for three-layer prediction (Kusiak & Li, 2011) ... 26
Figure 5 - InValue architecture (Fernandes et al., 2019) ... 28
Figure 6 - Neural network obtained and consequent rules (Li et al., 2014) ... 34
Figure 7 - Three-phase motor (Silva & Pederiva, 2013) ... 35
Figure 8 - Predictive Maintenance Roadmap Proposal ... 39
Figure 9 - Common and specific feature lists ... 41
Figure 10 - Splitting original dataset into training and test dataset ... 43
Figure 11 - Production line six automatic feeder ... 46
Figure 12 - Production line six automatic printer ... 47
Figure 13 - Production line six SPI ... 47
Figure 14 - Production Line six Pick and Place ... 48
Figure 15 - Production line six Reflow Oven ... 49
Figure 16 - Production line six AOI ... 49
Figure 17 - Data flow of HFA production ... 50
Figure 18 - Production line six layout ... 52
Figure 19 - Example of a finished Set of 40 PCB's ... 52
Figure 20 - Proposed Solution for HFA ... 53
Figure 21 - File Analysis and output generated ... 56
Figure 22 - Continuous Information Lifecycle for HFA ... 61
Figure 23 - Dashboard Pick and Place 1 ... 64
Figure 24 - Dashboard Pick and Place 2 ... 65
Figure 25 - Features extracted from Case Study 3 ... 90
Figure 26 - Rules Generated in Case C (Fernandes et al., 2019) ... 93
iv
Table of Tables
Table 1 - Sensor types (Holdowsky et al., 2014) ...9
Table 2 - Traditional Maintenance costs in USA ... 13
Table 3 - Reactive maintenance vs planned maintenance (Colemen et al., 2017) ... 14
Table 4 - Features of common algorithms (Lee et al., 2014) ... 19
Table 5 - Monitored parameters for SLM machine (Uhlmann et al., 2017) ... 22
Table 6 - Status Codes (Kusiak & Li, 2011) ... 25
Table 7 - Algorithm's results for the first layer of prediction (Kusiak & Li, 2011) ... 26
Table 8 - Algorithm's results for the second layer of prediction (Kusiak & Li, 2011) ... 26
Table 9 - Algorithm's results for the third layer of prediction (Kusiak & Li, 2011) ... 26
Table 10 - 10% most redundant pairs (Fernandes et al., 2019) ... 30
Table 11 - Decision Tree Results (Li et al., 2014) ... 32
Table 12 - SVM Results (Li et al., 2014) ... 32
Table 13 - Features selected from sensors (Li et al., 2014) ... 33
Table 14 - Number of patterns per condition (V. Silva & Pederiva, 2013) ... 35
Table 15 - Detection Results of mechanical faults (V. Silva & Pederiva, 2013) ... 36
Table 16 - Detection Results of electrical faults (V. Silva & Pederiva, 2013) ... 37
Table 17 - Machine's Files Descriptions ... 55
Table 18 - Features initially discarded from datasets ... 58
Table 19 - Algorithm's results for P&P1 and 2 ... 60
Table 20 - Features used in P&P dashboards ... 63
Table 21 - SPI_Traceability_AreaResultList ... 75
Table 22 - SPI_Traceability_BoardResultList ... 76
Table 23 - SPI_Traceability_CategoryContainer ... 77
Table 24 – P&P PcbLog ... 78
Table 25 – P&P CartLog ... 80
Table 26 – P&P SetupLog ... 81
Table 27 – P&P ErrorLog ... 82
Table 28 - P&P LotLog ... 83
Table 29 – P&P LotPartsLog ... 85
Table 30 - Joint Dataset (ERR_LOG and LOT_LOG) ... 91
Table 31 - Prediction Results P&P1 ... 94
v
Acronyms
AOI - Automated Optical Inspection BT– Bayesian Networks
BTA – Boosting Tree Algorithm CART – Standard Classification and
Regression Tree
CMT – Condition Monitoring Tool CPS – Cyber-Physical Systems
CRISP–DM – Cross-Industry Standard
Process for Data Mining
DB – Database DT– Decision Trees
FIA – Fédération Internationale de
l’Automobile
FL – Fuzzy Logic
HFA – Henrique Fernando & Alves HTPR – Highest True Positive Rate IoT – Internet of Things
LFPR – Lowest False Positive Rate MNE – Multi National Enterprises
MRMR – Minimum Redundancy
Maximum Relevance
NB – Naïve Bayes NN – Neural Network
NNE – Neural Network Ensemble
OEE – Original Equipment Effectiveness PM – Predictive Maintenance
P&P – Pick and Place
PCB – Printed Circuit Boards RCF – Recolha Chão Fábrica RPM – Rotations per minute SLM – Selective Laser Melting SME – Small and Medium-sized
Enterprise
SMT – Surface-Mount Technology SVM – Support Vector Machine SPI – Solder Paste Inspections TDT – Televisão Digital Terrestre USA – United States of America
1
1 Introduction
This first chapter aims to elucidate the problem and motivation that allowed the development of this dissertation. Consequently, the goals of this work are defined and what contributions are expected to be delivered upon the scientific community regarding the matter in hand. Finally, the outline methodology of this thesis is introduced and described.
1.1
Research Problem and Motivation
Throughout this past couple of years, there has been an immersive revolution in the digitalized world we live in (Marr, 2016). New technologies can perform in standards that were yet to be conceived a decade ago. The performance of processing and storage components breached barriers and still manages to break new ones, upon taking into consideration that perfection is just a term that does not manage to uphold any consideration regarding new solutions. The reason for this statement is mainly due to the fact that new solutions in processing components released today may be considered outdated in time-lapse of two to three years1 (Manyika et al., 2011). This line of thinking generated shock in multiple areas, being one of them, Industry.
Currently, data is everywhere. “According to IBM, we create around 2.5 quintillion bytes of data on a daily basis, and it is estimated that the size of data will double every 2 years” (Lau, Zhao, Chen, & Guo, 2016). Taking into consideration that in the year 2000 only a quarter of all world’s stored information was digital, it can be stated that currently “the amount of data available is literally exploding” (Marr, 2016, p. 2), since in modern days only less than two per cent of all stored information is nondigital (Cukier & Mayer-Schoenberger, 2013).´
Companies face a fierce market, regardless of the sector of the industry they are positioned. Despite a boost in information systems, companies still face a problem regarding the data generated. Disregarding the fact that more and more information is being collected, the consequent analysis and storage are not performed accordingly which leads to the increased difficulty to extract knowledge (Efthymiou, Papakostas, Mourtzis, & Chryssolouris, 2012). Consequently, this issue generates shockwaves to each department of an enterprise, such as
1 Moore’s Law, by Gordon Moore, states the number of transistors that can be placed on an integrated circuit
doubles approximately every two years. In other words, the amount of computing power that can be purchased for the same amount of money doubles every two years.
2
production, logistic, maintenance amongst others. Therefore, a change in focus is desperately needed in order to allow more data-driven solutions to aid the process of decision-making.
This vast generation of data changed the mindset of industries to focus on a more data-driven perspective, mostly due to the shockwaves of the fourth industrial revolution. Industry 4.0 can be considered as “an umbrella term made up of the tools which form its structure”(Chesworth, 2018, p. 1). In total three tools underline this umbrella, Cyber-Physical Systems (CPS), Big Data and Internet of Things (IoT). The collaboration of these components triggered specific outputs to cope with this data-driven approach to industry, one of them being PM (Meissner, Ilsen, & Aurich, 2017).
Throughout time maintenance, practices were an outcome of each industrial revolution. They allowed companies to adapt their methodologies to the new technologies/concepts generated. Nevertheless, only in this revolution, industry was given the possibility to further understand equipment operation and how to fine-tune it (Coleman, Damofaran, & Deuel, 2017). By applying the foundations of industry 4.0 such as Data Mining and IoT, users in different sectors of industry broaden their flow of data and therefore the quality of information gathered for the process of decision making.
1.2
Research Aim
Being PM a direct output from the last industrial revolution, it affected directly all sectors of industry, therefore, constituting a goal to achieve for all companies regardless of the sector. Nevertheless, the maturity stage of each sector varies, which leads to limitations for the implementation of this breakthrough. For instance, sectors where automation cannot be implemented such as metal casting face tremendous difficulties regarding the implementation of this data-focused methodology, mostly due to the fact that it resorts in its majority to manual labour.
With this knowledge in hand, the main goal of this thesis is to produce a predictive maintenance model and a set of guidelines that can simplify the process of implementing this methodology regarding the prediction of unscheduled stops in equipment.
Since the application of this methodology can be morphed into different scenarios, for this dissertation, the focus shall remain on establishing a common ground regarding the steps to be performed in the process of implementation. Therefore, the model to be generated must take as basis a set of cases from different scenarios, which consequently allows to produce a
3
more robust model. Since PM relies on the combination of several concepts, a set of guidelines were created to ease the process of this step-by-step execution. These guidelines focus on the relevant steps of the model to which additional attention is required to ensure proper employment.
Because PM is a direct output of Industry 4.0 and applies its foundations, it is still not enough to establish a mandatory presence of these concepts. As established previously, certain sectors of industry may have limitations regarding the transition into this digitalized era. Thus, a possibility presents itself, in the capability of foundations of industry 4.0 not being utterly defined, is it still possible to proceed to the implementation of its direct output?
Overall, this thesis aims to answer the following questions:
• Can Predictive Maintenance have a leading role, despite the main foundations of Industry 4.0 being not being established?
• Is it possible to achieve a generic model for the implementation of Predictive Maintenance in an Industry 4.0 era?
1.3
Research Contribution
Maintenance methodologies have been a direct output in all industrial revolutions allowing companies to adapt to each different face industry took throughout time. In each iteration, it was possible to perceive a different path being taken, which led to the new methodology overlapping the previous one. This evolution throughout time spiralled into a data-driven approach which led companies to focus their resources in data analysis. In the latest industrial revolution, as stated previously, predictive maintenance was regarded as a direct output since it allows companies to understand their equipment through the analysis of the data generated. Since companies adopt a mindset which emphases results, whether these are production-related, sales-related or even both, trespassing the barrier into the “new” industrial front-line is perceived as a daring move. Additionally, the wide variety of sectors available and fierce market competition leads to knowledge being maintained within area being rated a highly valuable attribute. All this leads to a delay in the adaptation of the main pillars of Industry 4.0 and consequently its direct output.
Taking into consideration the relevance of this event in the industry and the role this new data-approach can have in modern industry this aims to contribute with:
4
• Encourage the adoption of PM methodology through the elaboration of a generalized model to aid the application.
• Simplify the implementation of Predictive Maintenance through a set of guidelines that complement the model generated.
As a result of this thesis a Conference Proceedings named “The aftermath of Industry 4.0 in Small and Medium Enterprises” was created and presented at INTERACT 2019. The aim of this paper is to analyse the effects of the fourth industrial revolution in the Small and Medium Enterprises (J. Silva, Ferreira, & Gonçalves, 2019).
1.4
Research Methodology
In order to understand and address the research questions previously stated in chapter 1.2, the methodology Design Science Research, proposed by Ken Peffers was implemented (Peffers, Tuunanen, Rothenberger, & Chatterjee, 2007). “Design science…creates and evaluates IT artefacts intended to solve identified organizational problems”. (Hevner, March, Park, & Ram, 2004, p. 77). This methodology is divided into six steps that were applied in the following order:
• Identification and Motivation – Previously developed in section 1.1, this step aims at describing the relevance of the data-driven approach and the effect induced by with its introduction through Industry 4.0. To understand how this latest industrial revolution impacted industry PM was identified as a highly relevant output for analysis
• The Objective of the Solution – Defined in section 1.2, the main goal of this thesis is to produce a PM model and a set of guidelines that can simplify the process of implementing this methodology regarding the prediction of unscheduled stops in equipment.
• Design and Development – In order to understand and properly develop the artefact, foundations are needed to create a stable basis for creation. Therefore, in chapter 3, five Cases from different sectors were analysed, which served as foundations for the development of a model and a set of guidelines in chapter 4.
• Demonstration and Evaluation – With the sole purpose of demonstrating the utility of the artefact created, chapter 5 aims to show its implementation in a practical experiment conducted in HFA, a Portuguese SME that produces PCB boards.
5
• Communication – Last but not least, in chapter six, the conclusions obtained are discussed. More specifically, the main knowledge obtained in the process of constructing this dissertation and the future work to be advised is presented.
6
2 State of the art
This chapter provides a proper theoretical placement regarding the problems and objectives previously exposed. The first section aims to clarify the concept of Industry 4.0 and its main fundamentals, CPS, IoT and Big Data. The second concept to be analysed regards the maintenance activity, more specifically, predictive maintenance, conducted by several companies throughout the world. Last but not least, a review of Data Mining is presented to provide a linkage to the concepts previously reviewed.
2.1
Industry 4.0
With a high volatility market constantly changing its regulations and conditions for operability, companies face new challenges that automatically discard solutions previously conceived and implemented (Kampker, Heimes, Bührer, Lienemann, & Krotil, 2018; Schuh & Blum, 2016). Furthermore, product characteristics and lifecycle are changing by each generation manufactured, which leads to solutions inputted to the market that are far more detail specific. This chain of events is mostly due to the fact that the customer is demanding more and more customization (Hees et al., 2017). The only way for companies to address this encounter is to offer its customers with a vast degree of possibilities. On the one hand, this approach allows increased visibility in terms of marketing, since the customer holds power to customize the desired product. On the other hand, the same approach “forces” the company to change their production processes to small-batch manufacturing (Meissner et al., 2017; Wadhwa, 2012). To ensure a proper result upon facing multiple distinct orders from clients, batch production, induced by product volatility, can be seen as an advantage in a competitive point of view, due to the fact that it requires coordination as a vital foundation. To guarantee that the basic foundations are well established and maintained, companies keep updating their systems and production lines, therefore pledging for a viable position in their respective market (Hees et al., 2017; Mehrabi, Ulsoy, Koren, & Heytler, 2002).
With the sole purpose of facing the challenges stated above a new industrial revolution takes place, Industry 4.0. With multiple definitions emerging, this concept is characterized by Meissner as “conjunction of many technologies -both existing and new - which now work together.”(Meissner et al., 2017, p. 165). In another point of view, Özbebek Tunç and Aslan (2020) consider that Industry 4.0 could be defined “by the fact that machines become intelligent and coordinate self-managed production facilities through the internet and inter-machine communication” (Özbebek Tunç & Aslan, 2019, p. 94). For the purpose of this dissertation, the
7
definition proposed by Chesworth was adopted, which considers that Industry 4.0 is the joint effect of CPS’s, IoT, Big Data, therefore, creating a decentralized control and advanced connectivity (Chesworth, 2018). Taking into consideration the relevance of these three pillars, an analysis is conducted in the following sections.
2.1.1 Cyber-Physical Systems
A CPS network is a major component regarding the generation and communication of data. It allows hardware to understand the data being generated. In other words, these systems, provided with machine learning algorithms and historical data have the capability to understand and react to possible scenarios due to past behaviours and therefore adapt to situations without human interference (Chesworth, 2018; Jones, Romero, & Wuest, 2018; Rojko, 2017). One of the major advantages of these systems relies on the fact that all data generated is processed and stored, creating a digital library for future use. Applying this methodology to a production line generates a network of machines communicating past experiences, allowing decentralization of power where “machines, products or other elements in the production system can make decisions on their own without any superior control unit.” (Meissner et al., 2017, p. 167). This approach is best suitable in this specific scenario where industry is facing the modern problem of great variety through batch production. However, the major disadvantage seen in this scenario regards the possibility of each node of network pursuing individual goals, consequently exposing the structure itself (Chesworth, 2018).
To implement the concept of CPS, machines and the surrounding environment are required to gain further abilities. In other words, it is mandatory to assess the notion of sharing data and knowledge generated within the network itself (Hänel & Felden, 2017). This ability once implemented in equipment restructures the concept of centralized control into a vast network where data is exchanged in real-time “with the goal of identifying, locating, tracking, monitoring and optimizing the production process.” (Rojko, 2017, p. 77). Nevertheless, implementing sensors cannot be perceived in the simple idea of generating and collecting data from equipment and environment. This implementation must be seen in the perspective of allowing a two-way communication where machines can both receive and send data which increases the difficulty, since “Today, only some of a manufacturer’s sensors and machines are networked and make use of embedded computing” (Rüßmann et al., 2015, p. 6). Consequently, this important factor leads to high dependency towards the remaining pillars of Industry 4.0 (IoT and Big Data), to ensure proper implementation.
8
2.1.2 Internet of Things
Data extraction was considered as a difficult task mostly due to incapability to extract most of what was desired. To fill this gap, the urge of sensors has been a major role increasingly allowing more data available. With this kind of device, machines can harvest data regarding their physical operations and their neighbouring conditions that allow to understand how different situations unveil regarding machine behaviour (Coleman et al., 2017; Meissner et al., 2017). The data from the devices in question may vary from temperature, power consumption, vibration, amongst others, relying on the scenario of implementation and the weight added to each (Lee, Ardakani, Yang, & Bagheri, 2015). Consequently, the immense quantity of data generated through the sensors is streamed into servers to be properly processed, stored and analysed (Chesworth, 2018; Lee et al., 2015). The analysis is an important step allowing “to increase the knowledge about the use, reliability and efficiency of the equipment/process” (Ferreiro, Konde, Fernández, & Prado, 2016, p. 2), which was previously unavailable.
Impact of IoT can be considered as relevant perspective in terms of its adoption, more specifically in an industry, where it potentially generates “an economic impact of $1.2 trillion to $3.7 trillion per year.” (Manyika et al., 2015, p. 8). Companies gain multiple benefits from the implementation of this concept in their production lines, more specifically the creation of knowledge through pattern discovery. One example of this situation was presented by Lee et al. (2015) where considers the “hidden degradation or inefficiency patterns within machines or manufacturing processes can lead to informed and effective maintenance decisions which can avoid costly failures and unplanned downtime.” (Lee et al., 2015).
Considering implementation without providing a solid foundation risks the idea itself, which generates major holdbacks in its execution. In other words, the generated amount of data from this principle affects surrounding infrastructures and departments, which combined “with the affordability of bandwidth and storage, massive amount of data can be transmitted to give not only a full picture of assets in a single plant, but of an entire production network.” (Coleman et al., 2017, p. 4).
Regarding its application, in 1992 the price for a sensor was approximately 22 US dollars, however, the evolution led this price to lower to 1.40 US Dollars in 2014. In contrast, the usage of these types of equipment followed an inverse tendency, therefore, increasing the range of options available to cover the needs of the market. Table 1 shows the multiple options
9
of types of sensors available, depending on the type of data to extract. (Holdowsky, Mahto, Raynor, & Cotteleer, 2014).
Table 1 - Sensor types (Holdowsky et al., 2014)
Sensor type Sensor description
Acoustic Acoustic sensors measure sound levels and convert that information into digital or analogue data signals.
Biosensors Biosensors detect various biological elements such as organisms, tissues, cells, enzymes, antibodies, and nucleic acids.
Chemical
Chemical sensors measure the concentration of chemicals in a system. When subjected to a mix of chemicals, chemical sensors are typically selected for a target type of chemical (for example, a CO2 sensor senses only carbon dioxide).
Flow
Flow sensors detect the rate of fluid flow. They measure the volume (mass flow) or rate (flow velocity) of fluid that has passed through a system in a given period of time.
Force Force sensors detect whether a physical force is applied and whether the magnitude of the force is beyond a threshold.
Humidity
Humidity sensors detect humidity (amount of water vapour) in the air or a mass. Humidity levels can be measured in various ways: absolute humidity, relative humidity, mass ratio, and so on.
Light Light sensors detect the presence of light (visible or invisible). Occupancy
and Motion
Occupancy sensors detect the presence of people and animals in a surveillance area, while motion sensors detect movement of people and objects. The difference between the two is that occupancy sensors generate a signal even when a person is stationary, while a motion sensor does not.
Position
A position sensor measures the position of an object; the position measurement can be either in absolute terms (absolute position sensor) or in relative terms (displacement sensor). Position sensors can be linear, angular, or multi-axis.
Pressure Pressure sensors are related to force sensors and measure the force applied by liquids or gases. The pressure is measured in terms of force per unit area.
Radiation Radiation sensors detect radiations in the environment. Radiation can be sensed by scintillating or ionization detection.
Temperature
Temperature sensors measure the amount of heat or cold that is present in a system. They can be broad of two types: contact and non-contact. Contact temperature sensors need to be in physical contact with the object being sensed. Non-contact sensors do not need physical contact, as they measure temperature through convection and radiation.
Velocity and acceleration
Velocity (speed of motion) sensors may be linear or angular, indicating how fast an object moves along a straight line or how fast it rotates. Acceleration sensors measure changes in velocity.
An example of a company that correctly implemented IoT to the purpose of improving operations was Rolls-Royce. Besides producing high-end luxurious vehicles, Rolls-Royce is well known worldwide regarding its aeroplane engines and propulsion systems. This company
10
implemented Big Data in three major areas of operations: design, manufacture and after-sales support, yet after-sales support is the one to be highlighted regarding operations. Its engines and propulsion systems were inbuilt with numerous sensors with the main goal to gather data concerning multiple aspects of the product’s performance. In case any change is registered then it is reported in loco to engineers so that a decision can be made. This introduction of IoT to the company allowed Rolls-Royce to offer a new service model to clients called “Total Care”. Basically, provides support to customers per hour of use of its engines (Marr, 2016).
As expected, the harvest and storage of these mass amounts of data introduce the last key component, Big Data. The relation between IoT and Big Data is easily perceivable since in industry the second one is a consequence of the first.
2.1.3 Big Data
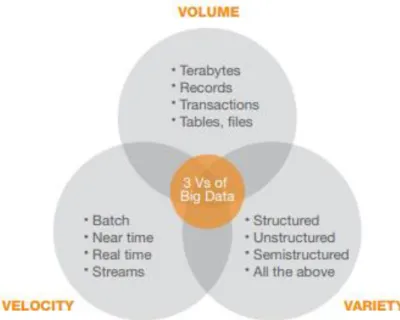
The huge amount of data generated on a daily basis led to the creation of the popular term in current days, Big Data. But the question remains, what is Big Data? Like the other concepts, this one has multiple definitions. Kimball and Ross (2013) consider that “Big data is structured, semi-structured, unstructured, and raw data in many different formats” (Kimball & Ross, 2013, p. 527). According to Manyika et al. (2011) “Big data refers to datasets whose size is beyond the ability of typical database software tools to capture, store, manage and analyse” (Manyika et al., 2011, p. 1). For the purpose of this dissertation and to simplify the diversity of definitions, Big Data shall be defined as provided by Kimball and Ross. But what size must a dataset be in order to be considered as Big Data? The answer is very subjective since there is no specific size defined and most part is not possible to be analysed via SQL (Kimball & Ross, 2013). Hence Manyika’s statement where “we don’t define big data in terms of being larger than a certain number of terabytes” (Manyika et al., 2011, p. 1). Just like technology keeps progressing over time, the same principle is applied to the definition of Big Data (Lau et al., 2016). Most of the definitions give an enormous focus regarding the size of data. Of course, volume is an important attribute, yet it’s not the only one, velocity and variety are also important to the definition (Russom, 2011). Based on this, big data can be characterized in three V’s: (1) Volume, (2) Velocity and (3) Variety, as shown in Figure 1.
11
Figure 1 - The three V's of Big Data (Russom, 2011)
The first attribute, (1) Volume, refers to the magnitude of data, since “most people define big data in terabytes – sometimes in petabytes” (Russom, 2011, p. 6), but big data can also be defined by counting records, tables, files or even time. Yet, a big volume for a business might not be as big at all in another domain. Defining a specific value for volume in general in big data is not possible, so the rule to have in consideration should be a “rule of thumb” where “when the size of data grows to the extent such that current technologies find it difficult to cope with the storage, retrieval, analysis, and use of the data, we can consider such a volume to be cast as big” (Lau et al., 2016). For example, Wal-Mart was estimated to produce 2.5 petabytes of data in every hour of functioning (Lau et al., 2016).
Data itself can be generated in numerous ways. Traditional analytics methods are formulated to be executed in structured or semi-structured data. Currently, we cannot count with only these two types of data. That is where big data makes the difference regarding (2)
Variety, with the capability to analyse the same types plus unstructured data. Lau et al. (2016)
defines variety as “the inherent heterogeneities of the structures, formats and sources of data.”(Lau et al., 2016). For example, User Generated Contents (UGC), like videos, images and audios that are usually seen in social media websites are unstructured data. In 2016 over twenty billion UGC had been uploaded to Instagram. This amount of content that is unstructured can be a huge difficulty for traditional methods to store and analyse (Manyika et al., 2011)
The term (3) Velocity regards “the rate at which data are produced and yet the speed at which data should be retrieved and analysed by a big data analytics system” (Lau et al., 2016). It can also be referred to as “the frequency of data generation or the frequency of data
12
delivery”(Russom, 2011, p. 7). From the three V’s, velocity is the one that most relates to IoT, since the wide use of smartphones and gadgets with inbuilt sensors led to the increasing rate of data generated. On a basis it is not only associated with IoT, but traditional businesses are also still able to produce huge amounts of data at an incredible rate, such as Wal-Mart (Manyika et al., 2011).
Although, the three V approach is fairly structured nowadays, there are several authors that consider that two more V’s should be applied to Big Data, which are: Veracity and Value. The term Veracity translates to “varying quality and validity of data among a sheer volume of data items“ (Lau et al., 2016). Whatever is the business data quality being a major concern. The term Value is defined as “the relatively low value density of a sheer volume of data“ (Lau et al., 2016). Having enormous quantities of data is useless if it can’t provide proper knowledge of the business. For instance, a huge volume of user log data in electronic commerce website has very low business value itself. Without a proper analysis of the data available, valuable information cannot be obtained, therefore companies should always take into consideration this factor (Manyika et al., 2011).
In conclusion, with the introduction of CPS and IoT in the industry, the amount, variety and speed of data generated heightened into new boundaries. However, methodologies and practices must be implemented to extract viable knowledge from data itself, since “the act of data collection alone does not offer advantages. Instead, to make use of the data and generate additional value, it is important to analyse and process the data in real-time and separate unimportant and important information.” (Meissner et al., 2017, p. 166). Multiple cases have been reported in research studies for the joint implementation of Big Data and IoT. One solid example of this application was performed in Fédération Internationale de l’Automobile (FIA) Formula 1, a worldwide competition where speed is imperative. In Formula 1, telemetry is used to stream live data from the car to the engineers in the pitlane. It is used by all teams with sole purpose of improving performance on track. Lotus implemented Big Data to the analysis of telemetry since the team was “collecting and analysing a lot of data. We’re not talking gigabits or terabytes but petabytes.” (Marr, 2016, p. 46).
2.2
Predictive Maintenance
With the amount of data generated, companies must be able to extract viable knowledge. Multiple sectors gain crucial support from these analyses, in particular, maintenance. Maintenance consists of restoring a machine or system into their Original Equipment
13
Effectiveness (OEE) or the desired status (Park, Moon, Do, & Bae, 2016). Nevertheless, times changed, and maintenance strategies became more complex and increasingly relevant (Fluke Corporation, 2005). According to Efthymiou et al. (2012) “manufacturing systems maintenance is becoming increasingly important, since in many industrial plants, the maintenance costs often exceed 30% of the operating costs and in the context of manufacturing systems lifecycle, maintenance and support, account for as much as 60 to 75% of total lifecycle costs” (Efthymiou et al., 2012, p. 221). When considering these values in terms of budget for companies, maintenance methodologies are taken under special consideration. With the analysis of historical data presented in Table 2 that states the costs incurred for traditional maintenance in the United States of America (USA), it is possible to perceive an upwards trend (Fluke Corporation, 2005).
Table 2 - Traditional Maintenance costs in USA
Year Maintenance costs ($)
1981 600 Billion $
1991 800 Billion $
2000 1.2 Trillion $
Coleman et al. (2017) state that “poor maintenance strategies can reduce a plant’s overall productive capacity between 5 and 20%.” (Colemen, Damodaran, ChandramoulinMahesh, & Deuel, 2017, p. 2). Companies resorting to traditional methodologies, such as reactive maintenance or planned maintenance, enter a limbo. On one side of this limbo, they choose to achieve best possible up-time available, disregarding machine life. On the other side, they can address possible scenarios before they happen, therefore not attaining the maximum durability of parts (Qinming, Ming, Chen, Wenyuan, & Chunming, 2018). Each side beholds different advantages and disadvantages, which justify the decision taken by each company. Table 3 shows the differences between these two types of maintenance.
14
Table 3 - Reactive maintenance vs planned maintenance (Colemen et al., 2017)
Benefits Challenges
Reactive maintenance
• Maximum utilization of tooling or machine components.
• Potentially greater damage to the machine;
• Unplanned downtime; • Higher maintenance costs.
Planned Maintenance
• Less likelihood of broken machinery;
• Less unplanned downtime; • More cost-effective than
reactive.
• Increased replacement costs over time;
• Need for additional spare parts inventory;
• Increased planned downtime.
Currently, with spreading of technological instruments to generate and send data, brought by IoT, industry decided to introduce to its methodologies comprehensive maintenance service. The reason for this bold action relies on the fact that users want to ensure high effectiveness and diminish downtimes, which could proportionate considerable losses to their business (Ferreiro et al., 2016; Fluke Corporation, 2005). The re-emergence of predictive maintenance is due to the fact that “only recently have technologies become both seemingly capable and inexpensive enough to make PdM widely accessible.” (Colemen et al., 2017, p. 7). Although PM suffered multiple mutations regarding its definition throughout its lifespan, it is important to clarify its meaning. For Sakib and Wuest (2018) PM aims “to measure and record physical parameters continuously for analysing and comparing data to make maintenance decisions.” (Sakib & Wuest, 2018, p. 268). In other words, and for the purpose of this dissertation PM consists in a maintenance methodology with the sole purpose of knowing in advance actions that can be taken in order to prevent likely scenarios, where machine down-time is expected, and therefore maintaining the desired OEE (Colemen et al., 2017; Fluke Corporation, 2005). Yet, PM doesn’t solely consist of predicting possible scenarios based on historical data. According to many authors, the direct monitoring is also an important part, since the implementation of this “philosophy” can aid companies to optimize total plant operation (Fluke Corporation, 2005; Park et al., 2016; Sakib & Wuest, 2018).
The implementation of PM allows to reach a common ground between the Reactive and Planned Maintenance, obtaining the advantages of both while not compromising the integrity of the assets with possible down-time due to malfunction. Regarding its advantages, from literature analysis, it is possible to state several factors to which companies may take advantage, upon the correct implementation of this methodology, as follows (Colemen et al., 2017; Fluke Corporation, 2005):
15 • Increased useful life (33-60%);
• The decrease in maintenance expenditures (10-15%); • Increase in sustainable capacity (15-40%);
• Reduce the time required to plan maintenance (20-50%); • Increase equipment uptime (10-20%);
• Reduce overall maintenance costs by (5-10%).
The implementation of this methodology can be executed through either standard software provided by third-parties (IBM, SAP, Siemens and Microsoft), or though the development of custom software in-house. As expected, divergencies oppose these two types of application, price being one of with high relevance. This sole factor directly affects the status-quo of the SME’s and Multi National Enterprises (MNE). Therefore opting for custom solutions developed within the company can outdraw further benefits, since the methodology is being implemented thoroughly with the sole purpose of achieving the enterprise goals.
Several companies have implemented PM methodologies in their assets/machines. Trenitalia, an Italian train company, due to incidents that occurred planned to integrate predictive maintenance in their locomotives detected that over 1600 locomotives had to be removed from service because of malfunction. Taking into consideration the number involved, delays were expected since a huge portion of actives were being placed to maintenance. To understand and prevent this type of situation, the company placed sensors to control several parameters in almost 1500 locomotives. All the data generated in service was then transferred into the private cloud server for future analysis. The information gathered allowed the company to “decrease downtime by 5-8 per cent and reduce its annual maintenance spend of $1.3 billion by an estimated 8-10% , saving about $100 million per year.” (Colemen et al., 2017, p. 11). Consequently, with the correct usage of sensors, this company managed to implement a new methodology, resorting to state of the art components while decreasing costs, which allowed to provide a better service output to their clients (Colemen et al., 2017).
2.3
Data Mining
With the evolution of the current markets, sustainable competitive advantages can no longer be applied which leads companies to desire a decrease of costs while maintaining productivity levels (Kampker et al., 2018; Park et al., 2016). Currently, “engineers and scientists are frequently working to develop models, methods and features to minimize costs, optimize production and increase reliability.” (Sakib & Wuest, 2018, p. 268). The reason behind this
16
need, to further develop solutions, mostly stands out due to the fact companies need improved decision support systems, that can extract useful knowledge from all the data available (Hänel & Felden, 2017). Through the usage of sensors, companies were able to gather important data regarding their operations, unfortunately, “the act of data collection alone does not offer advantages.” (Meissner et al., 2017, p. 166). To generate value to a company, data must be harvested, processed and analysed through data mining techniques, which allows to attain “the right information at the right time” (Park et al., 2016, p. 625).
The data mining practices allow the capability to extract information from data which can range from associations, patterns or tendencies that would remain hidden in data without proper analysis. In specific cases, with the usage of classification algorithms and historical data, this practice allows the prediction of future occurrences, such as possible failures or events (Pham & Afify, 2005). With industry 4.0 and PM it is possible to further understand machine operation and status, via the analysis of control parameters, gathered by sensors and log activity automatically generated throughout daily-basis operations (Hänel & Felden, 2017; Meissner et al., 2017).
Multiple sectors of industry are investing in data mining techniques to extract important information, such as Selective Laser Melting (SLM), machine tool linear axes, injection moulding, amongst others. Even though the application can vary into multiple scenarios, it is not possible to state the amount of data that must be generated to perform data mining techniques and obtain viable results. Nevertheless, the time-span associated with the use cases is greater than two years (Park et al., 2016; Schmidt & Wang, 2018; Uhlmann, Pontes, Geisert, & Hohwieler, 2018).
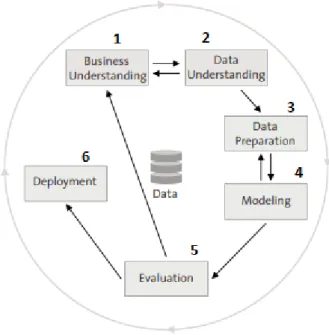
The evolution of this field allowed to generate frameworks to create a common basis to explore data. These elements allow to better understand how to approach specific problems and provide an overall guide of how to implement data mining methodologies from ground-up. A known framework in this area is the Cross-Industry Standard Process for Data Mining (CRISP-DM) that is divided into six steps, as it can be seen in Figure 2 (Jenke, 2018).
17
Figure 2 - CRISP-DM Model (Jenke, 2018)
The first step, (1) Business Understanding, regards the contextualization of the project. Its goal is to understand the background in which the data is going to be used. All relevant analysis regarding the surrounding aspects of the project is analysed in this step, such as the goals of implementation, the success criteria and the gathering of business knowledge which can aid in the overall project (Jenke, 2018).
The previous step and (2) Data Understanding are heavily linked since in this second one data is obtained, and initial analysis is performed. These analyses may lead the user to retract to Business Understanding to clarify features or details which were uncovered. This iteration allows the opportunity to generate a clear view of the project, data and goals (Jenke, 2018).
The (3) Data Preparation regards the setup of the datasets where the methodologies and procedures can vary according to the type of needs. Datasets must contain useful and rich data to extract the best results from the models, since they are the sole input for the machine learning methods. The increment of quality can be performed with the removal of outliers and poisonous samples of data, therefore reinforcing the structures of the dataset (Jenke, 2018).
Once the datasets are prepared, follows the (4) Modeling phase. This step regards the usage of the content generated in Data Preparation, where the start point regards a choice of models, with “usually, more than one method is available” (Jenke, 2018, p. 72). The choice for more than one model relies on the fact that each model fits differently in the same dataset, resulting in different outcomes. Furthermore, since certain models may have certain necessities,
18
an iteration is generated, which allows the user to regress to the data preparation step and adapt the dataset to the model’s needs. Regarding the algorithms to use in data analysis, the choice may vary between several supervised machine learning algorithms, such as Neural Network (NN), Decision Trees (DT), Bayesian Networks (BT), Support Vector Machine (SVM), amongst others. To identify which type of method is most appropriate to the use case in question, it is necessary to perfectly understand the dataset and the objectives. Inadequate data or variables may result in incorrect or inadequate results. Consequently, misinformation is generated, which does not uphold any support for the process of decision making (Jenke, 2018; Schmidt & Wang, 2018). Table 4 presents some of most commonly known algorithms and their features.
19
Table 4 - Features of common algorithms (Lee et al., 2014)
Algorithm Usage Advantage Disadvantage
NN
- Simulate the structures and functions of neural networks;
- Can learn the knowledge by modelling complex relationships between inputs and outputs and find patterns in data.
- For complex systems which involve non-linear behaviour and unstable processes; - Adaptive system. - No standard method to determine the structure of the network; - Requires enough computational resources. DT - Make a decision or classify data item by starting at the root node of the tree and following the assertions down until reaching a terminal node (leaf of tree);
- A special form of a rule set, characterized by a hierarchical organization of rules.
- Good visualization, easy interpretation and quick analysis ability for decision making.
- Need high-level experience and knowledge to formulate the tree structure.
SVM
- To project feature space into a higher dimensional space by a kernel function; - To find an optimized separation hyperplane in the projected space to maximize the decision boundary.
- Achieves better decision accuracy in special cases because of the maximized decision boundary.
- Efficient for a large dataset and real-time analysis.
- No standard method to choose the kernel function which is the key process for SVM;
BN
- A directed acyclic graph tool to present the structure of conditional
interdependency relations and probability
distributions between variables in one domain system;
- Reduces the number of parameters to learn a domain structure by marginalizing conditional probability distributions; - Visualizes the
dependency links between each pair of variables.
- Leaning an unknown structure can be complex and costly; - Relies on a certain amount of prior knowledge of the domain.
By understanding the model that best fits the dataset in question, the following step is
(5) Evaluation, which regards the validation of the model in terms of the business needs and
criteria established in the first step. Once these are validated, then the model is approved and deployed. Furthermore, this step also links to Business Understanding, in the possibility that criteria were not created accordingly, since “too often, false assumptions require going back to step 1 and to revise the business understanding.” (Jenke, 2018, p. 72).
20
Finally, the last step in this framework is (6) Deployment. In this final procedure, the artefact developed is transmuted from a confined setup into a normal operation scenario. Its usage may vary according the needs of the user which can range from simple dashboards to wide enterprise tracking of data operations (Jenke, 2018).
21
3 Case Studies
The main goal of this chapter is to illustrate the application of predictive maintenance in Industry 4.0 scenarios through the study of five case studies in different areas of industry. Taking in consideration the goal of this dissertation, this analysis will serve as an input for the development of a PM model. Being industry sectors closed fields where the competitive advantages can easily be attained by competitors, attaining information is of increased difficulty since companines tend to maintain a close loop of data. Therefore, the content analysed in this chapter was obtained from published and reviewed papers, in which the author did not have direct contribution to the development. The content analysed in this chapter derives from the following use cases:
• Case A: “Intelligent pattern recognition of a SLM machine process and sensor data” from Eckart Uhlmann, Rodrigo Pastl Pontes, Abdelhakim Laghmouchi and André Bergmann;
• Case B: “The prediction and diagnosis of wind turbine faults” from Andrew Kusiak and Wenyan Li;
• Case C: “Data analysis and feature selection for predictive maintenance: A case study in the metallurgic industry” from Marta Fernandes, Alda Canito, Verónica Bolón-Canedo, Luís Conceição, Isabel Praça and Goreti Marreiros;
• Case D: “Improving rail network velocity: A machine learning approach to predictive maintenance” from Hongfei Li, Dhaivat Parikh, Qing He, Buyue Qian, Zhiguo Li, Dongping Fang and Arun Hampapur;
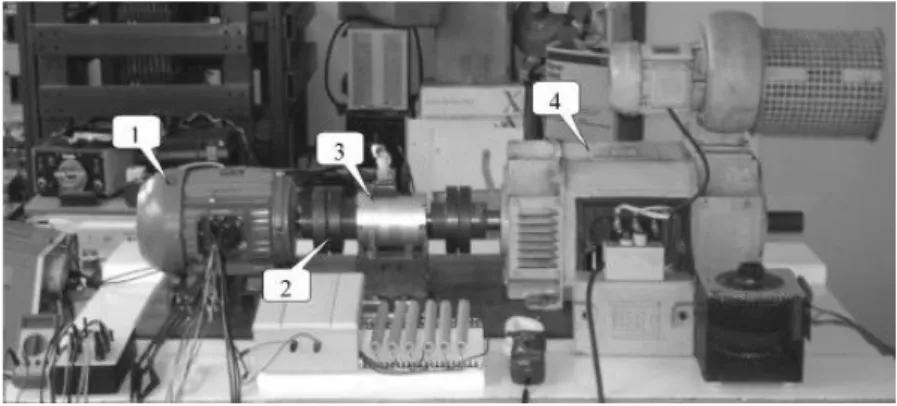
• Case E: “Fault Detection in induction motors based on artificial intelligence” from Vinicius Augusto Diniz Silva and Robson Pederiva.
3.1
Case A - Pattern Recognition in an SLM machine
SLM machines are known due to their capability to use high power lasers to fuse metal powder. These machines perform under the basis of additive manufacturing, otherwise known as stacking layer by layer to achieve the desired product which allows to build workpieces using multiple layers (Uhlmann, Pontes, Laghmouchi, & Bergmann, 2017).Several researchers have already addressed problems and concerns in terms of assessing data generated by these types of machines since previous analysis showed that manual
22
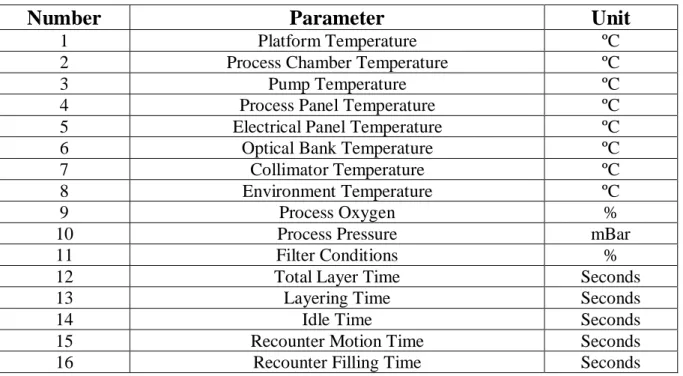
verifications do not provide the desired output. Disregarding the fact that they can be executed, it does not provide an optimistic ratio in terms of results/time wasted. With the published article the authors aimed to understand them if it was possible to identify patterns in the data from this type of machine and if it was possible to assess the condition of the machine based in control parameters. Through the usage of a CMT (Condition Monitoring Tool) developed by Fraunhofer IPK, the goal was to use the results to predict the behaviour of the machine. Consequently, this could allow to boosting performance measures, therefore, improving the reliability of the components and quality of the output. For this specific case, a total of 16 parameters were monitored. Table 5 displays the parameters and its units. All these regard operations of the machine with substantial influence on either the layer quality or the time to manufacture (Uhlmann et al., 2017).
Table 5 - Monitored parameters for SLM machine (Uhlmann et al., 2017)
Number
Parameter
Unit
1 Platform Temperature ºC
2 Process Chamber Temperature ºC
3 Pump Temperature ºC
4 Process Panel Temperature ºC
5 Electrical Panel Temperature ºC
6 Optical Bank Temperature ºC
7 Collimator Temperature ºC
8 Environment Temperature ºC
9 Process Oxygen %
10 Process Pressure mBar
11 Filter Conditions %
12 Total Layer Time Seconds
13 Layering Time Seconds
14 Idle Time Seconds
15 Recounter Motion Time Seconds
16 Recounter Filling Time Seconds
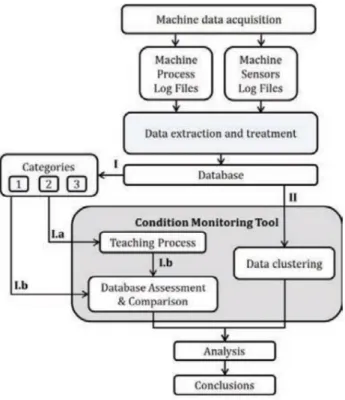
Taking into consideration the issues to be tackled, the authors decided to perform the methodology shown in Figure 3. The process starts with data acquisition from the two distinct sources, the machine’s log files and sensors installed. This is followed with process and treatment of data prior to its integration in a database in order to consolidate data integrity and shape for consequent analysis. From the integration a split is performed, where two analysis are conducted: Pattern classification (I) and Data Clustering (II).
23
Figure 3 - Methodology (Uhlmann et al., 2017)
In terms of Pattern Classification (I), the machine output was classified into three categories: “Finished perfectly”, “Finished with errors” and “Not finished”. Taking into consideration these categories, a dataset was generated, which contained a total of 90 manufacturing processes of the three categories from a total of 271 originally stored in the database. With this dataset four algorithms were tested with different input parameters to the categories Finished Perfectly and Not Finished: Nearest Neighbour, Naïve Bayes (NB), NN and SVM. The parameters that attained the best results were Process Oxygen (over 75%) and Idle Time (over 90%). Bearing in mind that three categories were available, the authors decided to obtain the average of the algorithms results for the two most suitable variables across the three categories. This resulted in the selection of idle time as the most adequate variable with Bayes Classifier and SVM as the most appropriate algorithms (around 60%).
Data Clustering (II) was used by the authors with the goal of understanding the number
of categories to input into the algorithms. By using K-means, it was possible to identify on average 3.5 categories, which is very close to the number of categories defined by the authors in the dataset.
Through the analysis conducted and the methodology executed by the authors (Figure 3), it is possible to conclude that the usage of categorization allows to understand how each feature directly relates into the prediction of machine’s output type. Since machine output can
24
vary, it is understandable that the authors deem worthy of understanding the most viable option for the available scenarios, therefore attaining a lower result.
3.2
Case B - Wind Turbine Prediction
With the need to search for new solutions in terms of harvesting and generating new sources of energy, interest started to grow regarding wind power solutions, more specifically, wind farms, since this solution allows countries to meet the targets of carbon emission. Yet, multiple problems arise for countries and companies that are managing this equipment once they are installed. Since wind turbines are in remote locations and access is difficult, maintenance operations increase difficulty due to their complexity, therefore, transmuting the cost of a bearing from $5000 to $250000 with the addition of no power being generated during the operation. All this leads to an increase in priority to attain condition monitoring tools.
To provide a solution for the prediction of faults in wind turbines, the authors proposed a methodology to access faults in a three-level system:
• Level 1 – Predict the occurrence of a status/fault; • Level 2 – Determine the category of the status/fault; • Level 3 – Predict the specific fault.
The case study combines data from four turbines in a time-span of three months from two sources: SCADA data and the fault data. The first dataset type contains approximately 25000 records and 60 variables for each turbine. Below follows an example of the variables that were grouped into four categories:
• Wind-related variables – wind speed, wind direction, wind intensity and turbulence; • Energy-related variables – power output, blade pitch angle, generator torque, rotor;
speed;
• Vibration related variables – drive train acceleration and tower acceleration; • Temperature related variables – bearing temperature, nacelle interior temperature.
The fault dataset contains approximately 7000 occurrences with over 350 different status codes. The authors consider a fault as a “status that with a certain probability results in a severe consequence to the wind turbine system” (Kusiak & Li, 2011, p. 17). Nevertheless, faults with No error may not lead to any damage. Table 6 shows examples of status codes:
25
Table 6 - Status Codes (Kusiak & Li, 2011)
Status Code Status Text Category
1 Program start PLC 2 2 No Errors 4 3 Manual Stop 4 4 Remote Stop 4 5 Remote Start 4 6 System OK 4 9 Under-Voltage 4
21 Cable Twisting left 4
25 No speed reduction with primary braking 1 28 No speed reduction with a secondary braking 1
The first step performed was the treatment and cleansing of data, such as removing duplicates and incorrect values which led to decrease in quantity of occurrences and status codes. Taking into consideration the vast diversity of fault codes, the authors categorized the fault type into four values in terms of impact on the wind turbine where “categories 1,2 and 3 might adversely impact the wind turbine system and its components. But the status codes in category 4 are not likely” (Kusiak & Li, 2011, p. 19). To integrate both datasets, the same process was performed in the SCADA dataset by establishing status code and categories.
From this point, the following step was to generate a model to predict in a three-layer system, as stated previously in this sub-chapter, with n×5 minutes in advance where “n is the number of timestamps in advance of the status/fault.” (Kusiak & Li, 2011, p. 20). Therefore, for each level of prediction, the authors generated a training dataset with two-thirds of occurrences to train the model and a test dataset with the remaining ratio. The model used is available in Figure 4 which features the variables used for each layer of prediction, wind speed and power output. In terms of algorithms, the authors chose a wide range, differing between layers:
• Level 1 – NN, SVM, Boosting Tree Algorithm (BTA) and Neural Network Ensemble (NNE);
• Level 2 – NN, Standard Classification and Regression Tree (CART), BTA and SVM; • Level 3 – NN, NNE, BTA and SVM.