Braz. J. of Develop.,Curitiba, v. 6, n. 6, p. 39506-39518 jun. 2020. ISSN 2525-8761
Mobile terrestrial lidar data to detect traffic sign and light pole
Dados de laser terrestre móvel para detectar placas de sinalização e postes de
iluminação
DOI:10.34117/ bjdv6n6-479
Recebimento dos originais: 12/05/2020 Aceitação para publicação:22/06/2020
Elizabete Bugalski de Andrade Peixoto
Mestre em Ciências Geodésicas - UFPR Instituição: Universidade Federal do Paraná
Endereço: Av. Cel. Francisco H. dos Santos, 100 - Jardim das Américas, Curitiba - PR, 81530-000 E-mail: [email protected]
Jorge Antonio Silva Centeno
Doutorado em Geodésia - Universitat Karlsruhe Instituição: Universidade Federal do Paraná
Endereço: Av. Cel. Francisco H. dos Santos, 100 - Jardim das Américas, Curitiba - PR, 81530-000 E-mail: [email protected]
ABSTRACT
This paper introduces a method for detecting and classifying vertical objects from a mobile terrestrial laser scanner point cloud. The paper concentrates on the classification of the top of the poles, where shields or lamps are installed. First, the variance-covariance matrix of each segmented object is computed. Then the eigenvalues and eigenvector of this matrix are derived. The 3D coordinates of each point are then transformed using the principal components transform in order to compute new features in this new space. In the second step the distribution of the three eigenvalues of the different classes in the eigenvalues space is analysed. Is it deduced that similar objects align in this space, allowing proposing a classification rule based on the distance to the lines. An experiment was performed to verify the approach performance. In the classification of different objects, the global accuracy reached 75%. When the classification was more general, separating just flat from three-dimensional objects the accuracy reached 94%. From the obtained results it can be concluded that the proposed method is feasible and allows separating objects according to its shape.
Keywords: Mobile mapping, point cloud processing, pole mapping RESUMO
Este documento apresenta um método para detectar e classificar objetos verticais a partir de uma nuvem de pontos do scanner laser terrestre móvel. O artigo concentra-se na classificação do topo dos postes, onde são instalados placas ou lâmpadas. Primeiro, a matriz de variância-covariância de cada objeto segmentado é calculada. Então os autovalores e os autovetores dessa matriz são derivados. As coordenadas 3D de cada ponto são transformadas usando a transformação de componentes principais para computar novas características nesse novo espaço. Na segunda etapa, analisa-se a distribuição dos três autovalores das diferentes classes no espaço de autovalores. É deduzido que objetos similares se alinham neste espaço, permitindo propor uma regra de
Braz. J. of Develop.,Curitiba, v. 6, n. 6, p. 39506-39518 jun. 2020. ISSN 2525-8761
classificação baseada na distância para as linhas. Um experimento foi realizado para verificar o desempenho da abordagem. Na classificação de objetos diferentes, a precisão global atingiu 75%. Quando a classificação era mais geral, separando apenas objetos planos e tridimensionais, a precisão chegou a 94%. A partir dos resultados obtidos pode-se concluir que o método proposto é viável e permite separar objetos de acordo com sua forma.
Palavras-chave: Mapeamento móvel, processamento de nuvem de pontos, mapeamento de postes.
1 INTRODUCTION
To support the FIFA World Cup in Brazil-2014, a great effort was invested towards improving urban infrastructure in the Brazilian cities. One of the aims was to improve the road network. At that point, it was stated that there was not enough information about the exiting urban infrastructure along the streets. One of the main concerns was to map existing poles and distinguish between their uses. In order to study the problem and develop a possible solution, a pilot study was executed within a University Campus, aiming at mapping and classifying poles using only LiDAR point cloud from mobile mapping survey. This paper describes part of the results, concentrating on the classification of pole tops.
Pole detection methods have similarity with methods aimed at detecting trees, vertical elements of the landscape. Some works, such as Yu et al. (2015) or Yokohama et al. (2013) are examples of point clouds processing for detection of poles with terrestrial LiDAR. In a broader sense, pole detection and classification methods are also included in the more general detection of urban furniture problem and is discussed in works like Li et al (2016), Fukano and Masuda (2015) or El-Halawany (2013).
As the problem is to detect and classify urban furniture, pole detection methods usually begin with the classification of ground points, which enables computing a normalized representation that stores the height of the objects above the ground. The methods of terrain filtering from aerial LiDAR can be applied for this purpose. When dealing with mobile terrestrial scanner data, alternative solutions were proposed to extract the bare soil, as for example in Ibrahim and Lichti (2012), who propose segmenting the point cloud into two main segments: ground and non-ground by analyzing the local density of the point cloud. It is assumed that points on the ground are in regions of lower density and therefore the number of points inside a sphere of defined radius is counted. A more complex approach is described in Denis et al. (2010), who propose an algorithm based on region growing, taking as seed the point with minimal height of each scanned line.
From this point up, the pole detection techniques vary. Among the best known are the slicing techniques and those based on the detection of cylinders, as described in Huang and You (2005).
Braz. J. of Develop.,Curitiba, v. 6, n. 6, p. 39506-39518 jun. 2020. ISSN 2525-8761
Slicing consists in defining a surface parallel to the ground, at a height specified by the user. This method, also described in Luo and Wang (2005), assumes that the poles are vertical structures and will intercept this virtual surface. To improve the method, several surfaces are produced at different heights.
Assuming that poles are cylinders, some methods aim at detecting circular structures in the point loud. For example, Press and Austin (2004) propose to apply the Hough transform to identify the points belonging to a circle. Another way to model the section of the poles would be applying RANSAC method for detecting circular structures, as described in Bolles and Fischler (1981).
Pole classification is a more complex task, because it deals with 3D object classification from an irregular point cloud. To obtain a description of relevant features in a point cloud, Weinmann et al. (2013) propose the analysis of a local neighborhood. As described by Jutzi and Gross (2009) the local point cloud allows deriving the 3D covariance matrix, which describes the point dispersion within the region. From the eigenvalues (λ1, λ2, λ3) and eigenvectors of this matrix,
descriptors can be computed to describe the shape of the scanned object. Weinmann et al. (2013) propose to use the measures of as descriptors to identify linear, planar and volumetric structures three measures (Equations 1-3):
This concept was also applied in a study of pole and trees classification, introduced by Ordoñez et al (2017). After testing several variables related to the geometric characteristics of vertical objects, they concluded that three descriptors derived from the eigenvalues are useful:
x2 is useful to discriminate flat elements; x3 distinguishes narrow objects and x4 discriminates between volumetric and flatter objects.
A different approach is described in Rodríguez-Cuenca et al (2015). They propose the use of a classification scheme based on the Mahalanobis distance. First the point cloud is segmented and vertical clusters (pillars) are detected using voxels. Then, the Reed and Xiaoli Yu (1990) method
Braz. J. of Develop.,Curitiba, v. 6, n. 6, p. 39506-39518 jun. 2020. ISSN 2525-8761
(based on the Mahalanobis distance) is applied to detect pillars that represent a vertical urban element.
A more complex classification method is introduced in Fukano and Masuda (2015). After the pole-like objects are detected, the Fukano and Masuda method divides the point cloud in spatially more simple parts, First the pole is separated, then the remaining points are analyzed and its verified if a planar structure can be fitted using RANSAC. If it is necessary, the process is repeated searching for other elements. In a second step, the point cloud is classified using the following variables: Sizes of the bounding box; Eigenvalues; Ratios of eigenvalues: Numbers of subsets (elements); Distances between elements and the Ratios of edge directions.
In the present study, the solution is based on the Principal Components Transform, as proposed by Weinmann et al. (2013) and Ordoñez et al (2017). The eigenvalues also analyzed to classify the tops of poles and identify the kind of object that is installed there. In the proposed approach, the original three-dimensional eigenvalues space is reduced to a bidimensional representation. This simplification affects the formulation of the above-mentioned variables. It is observed that the objects trend to align in this two-dimensional feature space and therefore a second difference in relation to the solutions described in the literature is the classification approach. In this paper, lines are used as the clusters of each class and the classification approach is based on the distance to lines.
2 METHODS
The method uses a 3D cloud points measured by a Mobile Terrestrial Laser System. The overall steps are (a) data capture; (b) point cloud computation; (c) pole detection and (d) pole classification. This paper focuses in the last step.
2.1 POLE DETECTION
To start the extraction process, the points on the ground were classified using the Classify Hard Surface tool and used to compute the height of the points above the ground. The point cloud was projected on the horizontal plane, using a grid as basic structure. The grid size was established according to the relation between the spatial resolution of the point cloud and the expected diameter of the poles. The idea is that, if many points fall on a pole or another vertical structure, they will be projected on the same cell of the grid. So, the number of points on each cell was computed and stored as grid value. In the next step, the grid values were separated according to the concentration of points (point density), enabling to identify vertical structures. The obtained regions were labelled
Braz. J. of Develop.,Curitiba, v. 6, n. 6, p. 39506-39518 jun. 2020. ISSN 2525-8761
using the connected components algorithm. In the next step, the pole is segmented according to the diameter variation and the top of the pole is obtained.
2.2 TOP ANALYSIS
After the top is separated a reduced point cloud is available. It is assumed that the point set contains just points of the pole, although, in some cases, the top may be mixed with other objects like vegetation. Such cases will not be treated here. From the point cloud, the involving parallelepiped is computed, to estimate the size of the object.
The principal components analysis is applied to derive new features, as proposed by Kukko et al. (2009) or Briese and Pfeifer (2008). Considering a set of 3D coordinates, the dispersion of the points in relation to the three axes (x1 x2 x3) is given by the variance-covariance matrix (C). The
variance-covariance matrix is real, positive, semi-definite, and therefore its eigenvalues are always greater than or equal to zero. The eigenvalues are the scalars that satisfy equation 7.
det (C- λI) = (7)
The principal components are computed from the eigenvectors associated to the eigenvalues of C and provide the directions of the main axis of the point cloud. The relative significance of each axis is provided by the relative size of the associated eigenvalue:
The result is a new three-dimensional system, parallel to the main directions of the dispersion of the top of the pole, as displayed on Figure 1.
Figure 1. The eigenvectors of the point cloud of a shield.
Braz. J. of Develop.,Curitiba, v. 6, n. 6, p. 39506-39518 jun. 2020. ISSN 2525-8761
Having computed the eigenvectors, the principal components transform can be applied according to equation (8) to obtain the transformed point cloud.
Where:
X: (x1 x2 x3) are the original coordinates
Y: (y1 y2 y3) are the transformed coordinates
EVE is a 3x3 matrix where each column stores an eigenvector.
The normalized eigenvalues (I) can be used instead of the original values, according to equation 10, in order to avoid scale problems (El-Halawany, 2013). This relationship formulates the equation of a plane in the three-dimensional space, a property that can be used to simplify the analysis.
Ii+ I2+ I3 =1 (10)
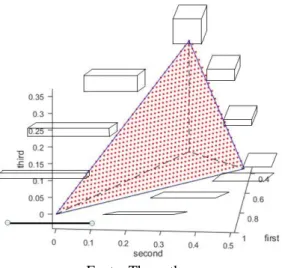
Figure 2 displays the plane described in Equation (10). It is noticeable that the use of two variables derived from the eigenvalues is enough to describe the shape, without considering the size of the objects.
Figure 2 – Three-dimensional representation of the plane described in Equation 9.
Fonte: The author
Many poles hold flat objects, like shields, that can be identified by its shape or size. Therefore, the transformed point cloud was projected on the plane formed by the first principal components, obtaining a 2D representation of the object that allowed computing shape parameters
Braz. J. of Develop.,Curitiba, v. 6, n. 6, p. 39506-39518 jun. 2020. ISSN 2525-8761
as Area and Perimeter of the object. So, it is also possible to compute a shape index Equation (11), the Gravelius compactness index, commonly used to describe the shape of a basin according to Anwar (2011), being k a constant (k=1/(2 π1/2.).
3 ANALYSIS
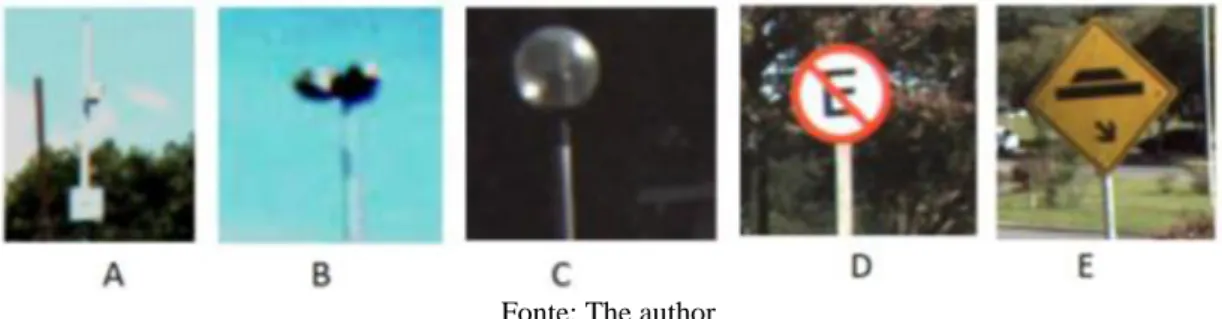
Five different objects were considered in the classification step. They are displayed on Figure 3. (A) Lamp A; (B) Lamp B; (C) Lamp C; (D) Round shield; (E) Square shield. The third class of lamps consists of a glass ball and therefore it is difficult to model from the point cloud, because of its transparency.
Figure 3. Types of objects the top of the poles: (A) Lamp A; (B) Lamp B; (C) Lamp C; (D) Round Shield; (E) Square Shield.
Fonte: The author
The classification method follows three steps. As there is one spherical class of lamps (glass balls), the sphericity index was applied to separate it from the rest. Although this task looks simple, but isn´t. The fact that the object is transparent reduces the number of reflected points and may affect the classification.
In the second step, a classification model based on the linearity of the distribution of the classes on the normalized eigenvalues space is used to separate different lamps and shields. This model is described in the following paragraphs. Finally, as there are shields, flat, but with different shape, the shape of the shields is classified using the Gravelius index.
Figure 4 displays the plot of the three normalized eigenvalues of all the objects. It is noticeable that the points build up a plane in the three-dimensional space because they obey the relation: Ii+ I2+ I3 =1. This fact suggests that there is strong correlation between the eigenvalues and
therefore the information can be represented using just two of them or projecting the points on this plane. In this three-dimensional space, objects with similar shape properties trend to align in the
Braz. J. of Develop.,Curitiba, v. 6, n. 6, p. 39506-39518 jun. 2020. ISSN 2525-8761
eigenvalues space. Flat shields, the black points, are located on the base of the cloud, where the value of the third eigenvalue λ3 is small, almost zero.
Figure 4. Scatter of selected classes: black –flat objects; blue lamps; red – glass balls.
Fonte: The author
As the minor variation corresponds to the smallest eigenvalue, the point distribution can also be displayed in a plane, as shown in Figure 4.
Figure 4. Bidimensional Scatter of selected classes: black –flat objects; blue lamps class A; red – glass balls.
Fonte: The author
3.1 CLASSIFICATION
Observing the distribution of the classes in the bidimensional space, it was proposed to adjust the equation of a line for each class. Therefore, the parameters of the line (a, b and c in equation 12) were computed for each class.
Braz. J. of Develop.,Curitiba, v. 6, n. 6, p. 39506-39518 jun. 2020. ISSN 2525-8761
Finally, a classification scheme was proposed in which the distance of the point to each line was used as discriminant function. That means that the classification rule was:
with:
4 EXPERIMENT
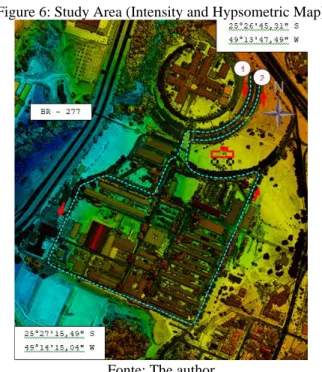
The data used in this study were captured using the Pegasus One Mobile System. The system computes the trajectory based on the onboard GNSS and IMU and then enables computing a point cloud also with intensity information. The test area is located within the campus of the Federal University of Paraná, in the municipality of Curitiba, Brazil. The mobile scanner took two hours to survey 2.3 linear kilometers. Figure 3 displays the path of the survey. The area was scanned at a speed of 30 km/h. The mean density of points for the study area was 2,400 points per m2 and was consider enough to detail the poles and shields.
Figure 6: Study Area (Intensity and Hypsometric Map)
Fonte: The author
After the pole detection step, a sub point cloud was separated for each pole. Figure 7 displays an example of a pole with a glass ball lamp on its top. As the lamp is covered with a ball glass, fewer points were collected in this case, because of the high transmittance of the glass.
Braz. J. of Develop.,Curitiba, v. 6, n. 6, p. 39506-39518 jun. 2020. ISSN 2525-8761
Figure 7: Example of a scanned object. Black = pole; red = top (glass ball lamp)
Fonte: The author
5 RESULTS
The method was applied to a set of 167 poles with different objects on the top. Five classes of objects were considered for the experiments: (A) Lamp A; (B) Lamps B; (C) Lamp C; (D) Round Shield; (E) Square Shield. The computed parameters for each line (Equation 10) are displayed on Table 1. The value of b is -1 for each line.
Table 1. Parameters of the lines of each class.
Object A B C D E
a 0.257 0.113 100.00 0.066 0.059
c -0.419 0.041 -0.329 0.0162 -0.024
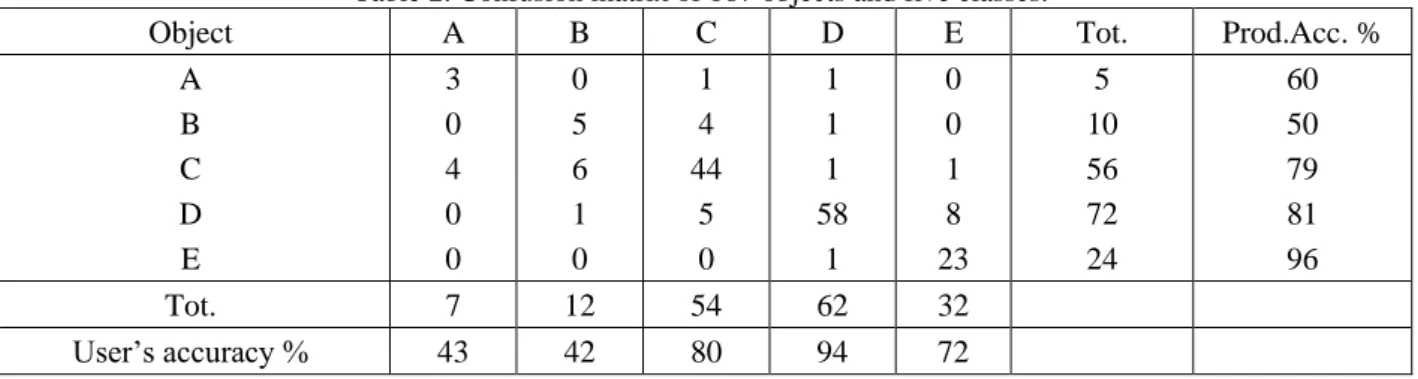
The result of the classification of a total of 167 objects is summarized in the confusion matrix presented in Table 2.
Table 2. Confusion matrix of 167 objects and five classes.
Object A B C D E Tot. Prod.Acc. %
A 3 0 1 1 0 5 60 B 0 5 4 1 0 10 50 C 4 6 44 1 1 56 79 D 0 1 5 58 8 72 81 E 0 0 0 1 23 24 96 Tot. 7 12 54 62 32 User’s accuracy % 43 42 80 94 72
The overall accuracy of the classification is 75%. Analyzing the user’s accuracy, it is visible that the flat objects were classified with more success, while the first two kinds of lamps present lower values and high confusion. Although the glass balls are transparent and not fully covered by
Braz. J. of Develop.,Curitiba, v. 6, n. 6, p. 39506-39518 jun. 2020. ISSN 2525-8761
the survey, the fact that this object has more volume contributes to the success of its classification. Nevertheless, this class is more mixed with all the others.
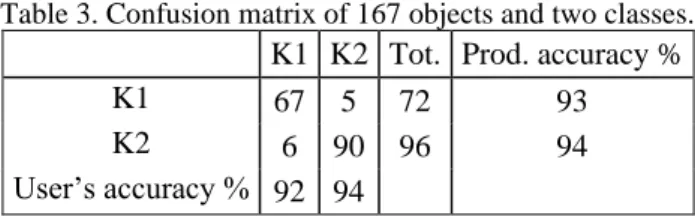
Reducing the analysis to just two groups, flat (K1) and three-dimensional (K2) objects means to consider just the sphericity index (Equation 3). The result of this classification is better, as displayed on Table 3, with global accuracy of 93%. It shows that the eigenvalues can be used to separate flat and volumetric objects on the top of poles with relative high accuracy.
Table 3. Confusion matrix of 167 objects and two classes. K1 K2 Tot. Prod. accuracy %
K1 67 5 72 93
K2 6 90 96 94
User’s accuracy % 92 94
6 CONCLUSIONS
In this paper, a method for feature extraction and three dimensional objects classification was introduced, as a solution to the classification of poles with different uses. Concentrating on the relationship between eigenvalues of the covariance matrix derived from the position of the points in the point cloud, a classification rule was proposed. It uses lines in the bidimensional space of the two larger eigenvalues. From the obtained results, it can be concluded that the use of lines, instead of centers for each class has advantages in the classification step, considering that objects with the same shape trend to align in the eigenvalues space. The disadvantage remains with the high sensitivity of the eigenvalues to the point distribution. The outliers and different densities make it difficult to describe the shape of the objects. For future research, it would be expected to apply the approach with other data set and search for better alternatives to estimate the spread of each class in the eigenvalues space.
ACKNOWLEDGEMENTS
The authors would like to thank ESTEIO Engenharia e Levantamentos for allowing the use of the data.
REFERENCES
Denis, E.; Burck R.; Baillard, C. (2010). Towards road modelling from terrestrial laser points. In: Paparoditis N., Pierrot-Deseilligny M., Mallet C., Tournaire O. (Eds), IAPRS, Vol. XXXVIII, Part 3A – Saint-Mandé, France, September 1-3, 2010.
Braz. J. of Develop.,Curitiba, v. 6, n. 6, p. 39506-39518 jun. 2020. ISSN 2525-8761
El-Halawany, S. (2013). Detection of Road Furniture from Mobile Terrestrial Laser ScanningPoint Clouds, Ph.D. thesis, Department of Geomatics Engineering,University of Calgary, Canada.
Fischler, M.A. and Boller, R. C. B., 1981. Random sample consensus: a paradigm for model fitting with applications to image analysis and automated cartography. Communication of the ACM 24 (6), pp.381–395.
Fukano, K. and Masuda, H., 2015. Detection and Classification of Pole-Like Objects from Mobile Mapping Data. ISPRS Annals of Photogrammetry, Remote Sensing and Spatial Information
Sciences, 1, pp. 57-64.
Huang, J. and You, S., 2005. Pole-like object detection and classification from urban point clouds.
IEEE International Conference on Robotics and Automation (ICRA), pp. 1-7.
Ibrahim, S. and Lichti, D. (2012). Curb-based street floor extraction from mobile terrestrial LiDAR point cloud. International Archives of the Photogrammetry, Remote Sensing and Spatial
Information Sciences, Volume XXXIX-B5, 2012. XXII ISPRS Congress, 25 August – 01
September 2012, Melbourne, Australia.
Jutzi, B. and Gross, H., 2009. Nearest neighbour classification on laser point clouds to gain object structures from buildings. The International Archives of the Photogrammetry, Remote Sensing and
Spatial Information Sciences, Vol. XXXVIII, Part 1-4-7/W5.
Li, F.; Elberink, O.; Vosselman, G. (2016). Pole-like street furniture decomposition in mobile laser scanning data. ISPRS Annals of the Photogrammetry, Remote Sensing and Spatial Information
Sciences, Volume III-3, 2016. XXIII ISPRS Congress, 12–19 July 2016, Prague, Czech Republic.
Luo D. and Wang Y., 2008, Rapid extracting pillars by slicing point clouds, International Archives
of the Photogrammetry Remote Sensing, vol.36-8, pp.71-75.
Ordóñez,C., Cabo, C. and Sanz-Ablanedo, E., 2017. Automatic detection and classification of pole-like objects for urban cartography using mobile LASER scanning data. Sensors, 17, 1465; pp 1-10.
Braz. J. of Develop.,Curitiba, v. 6, n. 6, p. 39506-39518 jun. 2020. ISSN 2525-8761
Press P. and Austin, D. (2004). Approaches to pole detection using ranged laser data. Proceedings
of Australasian Conference on Robotics and Automation, Citeseer. pp.1–8.
Reed, I.S.; Yu, X. (1990). Adaptive multiple-band CFAR detection of an optical pattern with unknown spectral distribution. IEEE Trans. Acoust. Speech Signal Process. 1990, 38, 1760–1770.
Rodríguez-Cuenca, B.; García-Cortés, S.; Ordóñez, C.; Alonso, M. C. (2015). Automatic Detection and Classification of Pole-Like Objects in Urban Point Cloud Data Using an Anomaly Detection Algorithm. Remote Sens. 2015, 7, 12680-12703.
Weinmann, M, Jutzi, B. and Mallet, C., 2013. Feature relevance assessment for the semantic interpretation of 3d point cloud data. ISPRS Annals of the Photogrammetry, Remote Sensing and
Spatial Information Sciences, Volume II-5/W2, 2013 ISPRS Workshop Laser Scanning 2013, 11 –
13 November 2013, Antalya, Turkey.
Yokoyama, H., Date, H., Kanai, S. and Takeda, H., 2013. Detection and classification of pole-like objects from mobile laser scanning data of urban environments. International Journal of CAD/CAM Vol. 13, No. 2, pp. 31–40.
Yu, Y., Li, J., Guan, H., Wang, C. and Yu, J., 2015. Semiautomated extraction of street light poles from mobile LiDAR point-clouds. IEEE Transactions On Geoscience And Remote Sensing, Vol. 53, No. 3, pp. 1374–1386.