RBRH, Porto Alegre, v. 23, e2, 2018 Scientific/Technical Article
http://dx.doi.org/10.1590/2318-0331.0318170121
Assessment of the potentiometric drawdown in the Guarani Aquifer System in
Bauru/SP by a model of analytical elements
Avaliação do rebaixamento potenciométrico no Sistema Aquífero Guarani em Bauru/SP usando um modelo de elementos analíticos
Vinicius Ferreira Boico1,2, Edson Wendland2 and José Anderson do Nascimento Batista3
1Université Laval, Québec, QC, Canadá 2Universidade de São Paulo, São Carlos, SP, Brazil 3Universidade Estadual de Campinas, Campinas, SP, Brazil
E-mails: [email protected] (VFB), [email protected] (EW), [email protected] (JANB)
Received: January 08, 2017 - Revised: April 20, 2017 - Accepted: November 15, 2017
ABSTRACT
The recent drought events and the population growth in São Paulo State (Brazil) have caused many municipalities to increase the groundwater exploitation of the Guarani Aquifer System (GAS) for the public water supply. In Bauru City/SP, the extraction of water from this Aquifer is expected to increase from 3699 m3/h (2014) to 4465 m3/h (2034). However, its long-term overexploitation
may compromise the amount of available groundwater. The Analytic Element Method was used for groundwater flow modeling at steady-state, which includes the regional flow, the water withdrawal from wells and the main local geological conditions. The hydraulic
gradient 0.82 m/km was estimated in the GAS in Bauru City. The potentiometric drawdown in the GAS in Bauru was estimated as 50 m since the beginning of the groundwater exploitation. The drawdown for the groundwater pumping scenario in 2014 is higher than 15 m in Piratininga and Agudos and lower than 10 m in further cities. The expected drawdown for the scenario of 2034 can reach 15 m in comparison with the scenario of 2014, in the North of Bauru City, where the future wells will be located.
Keywords: Hydrogeology and groundwater; Analytic element method; Water resources management; Guarani Aquifer System.
RESUMO
Os eventos de escassez hídrica observados nos últimos anos e o aumento populacional no Estado de São Paulo têm conduzido à maior explotação de água subterrânea do Sistema Aquífero Guarani (SAG) para abastecimento público. Somente no município de Bauru/SP, está previsto um aumento da vazão de água extraída deste Aquífero de 3699 m3/h (2014) para 4465 m3/h (2034). Entretanto, a
superexplotação em longo prazo do Aquífero pode comprometer a quantidade de água disponível. O Método dos Elementos Analíticos foi utilizado para a modelagem do escoamento em regime permanente, considerando o escoamento regional, a extração de água por poços em Bauru/SP e os principais condicionantes geológicos locais. Observou-se que o gradiente hidráulico do SAG na cidade de Bauru era de aproximadamente 0,82 m/km. O rebaixamento potenciométrico no SAG em Bauru foi estimado em 50 m desde o início da explotação de água por poços. O rebaixamento estimado para as cidades vizinhas sob o cenário de extração de água do SAG em 2014, com relação ao cenário inicial (sem poços), é superior a 15 m em Piratininga e Agudos e inferior a 10 m nas cidades mais afastadas. Espera-se que o rebaixamento adicional devido ao cenário de 2034 com relação ao cenário de 2014 seja de até 15 m ao norte da cidade de Bauru, onde os novos poços estão sendo perfurados.
INTRODUCTION
The Southeastern Region of Brazil, which has approximately 85 million inhabitants, experienced extreme events of drought in the years 2013 and 2014 (ESCOBAR, 2015), when low precipitation levels were registered. The amount of surface water is highly vulnerable to climate changes during the year, therefore, the groundwater resources of the Guarani Aquifer System (GAS) are an interesting alternative for the maintenance and increase of the water exploitation. GAS is the second largest aquifer in the world with 1.1 million km2 of occurrence area (OAS, 2009).
It is a sandstone aquifer located in the southern region of South America, in Brazil, Paraguay, Argentina and Uruguay. It has been referred to as a hydrostratigraphic unit composed of Botucatu and Piramboia Formations (CAVICCHIA, 2007; GUANABARA, 2011; MELO; WENDLAND; GUANABARA, 2015; RABELO; WENDLAND, 2009, 2010).
Bauru City (Figure 1) is located in the State of São Paulo and overlies the GAS. It has a population of approximately 370,000 inhabitants (IBGE, 2016), who consume water supplied by the Department of Water and Wastewater (Departamento de Água e Esgoto – DAE, in Portuguese). Around 60% of the water supply in Bauru are groundwater pumped from the Guarani Aquifer System and, in a lower amount, from the Bauru Aquifer System (HIDROSAN, 2014). Studies have confirmed the lack of hydraulic connections between those aquifers (C3 CONSULTORIA, 2015; SILVA; CHANG, 2010), and GAS can be considered a
confined aquifer in Bauru City. However, its thickness, which is
on average 250 m in Bauru City, reduces in the south-western direction, until Piratininga City, where it appears 75% thinner (PAULA E SILVA; CHANG; CAETANO-CHANG, 2003; SILVA, 2009; C3 CONSULTORIA, 2015).
According to the projections of the Water Master Plan of Bauru, the population of that City will likely increase by 110,000 inhabitants from 2014 to 2034 (HIDROSAN, 2014). Consequently, the withdrawal of groundwater from GAS can increase from 3699 m3/h to 4465 m3/h in that period, through
the perforation of new wells. However, the increase in water exploitation causes the drawdown of potentiometric levels, which interferes with the pumping conditions of operating wells.
The knowledge of the groundwater flow in the GAS in
past and present conditions and simulations of future scenarios can provide useful information for a sustainable management of pumping rates of wells. In this study, the Analytic Element Method (AEM) was used for the computational modeling of the
groundwater flow. The method is based on the linear superposition and states linear flow systems are solved by elementary flow
responses (STRACK, 1989). Its implementation requires no domain discretization and is particularly useful for applications on a regional scale (BAKKER et al., 1999; BATISTA; WENDLAND; SCHULZ, 2012; HAITJEMA, 1995). Furthermore, its use is practical for an
accurate scientific investigation focused on physical phenomena
(WENDLAND; ALENCAR; STRACK, 2009; ALENCAR; WENDLAND, 2013).
The GAS potentiometric drawdown in Bauru City and its surrounding areas was analyzed for supporting the decision-making process of public agencies regarding groundwater exploitation. The perforation of new wells by the Department of Water and Wastewater will be considered, according to the guidelines of the Water Master Plan of Bauru (HIDROSAN, 2014). Equipotential and drawdown maps were designed for different years and pumping rate scenarios.
MATERIAL AND METHODS
The following procedure describes the methodology used for the development of the computational model: i) data collection from
public agencies and papers; ii) elaboration of simplified hypotheses;
iii) implementation of equations by the AEM; iv) implementation of the model in MATLAB (MATHWORKS, 2011); v) model calibration and sensitivity analysis; vi) simulation of past, current and future scenarios and vii) design of equipotential and streamline maps through an open source Geographic Information System. All UTM coordinates from the images are provided in the reference datum WGS84, 22K zone.
Study area
The study area corresponds to Bauru City (UTM coordinates: 700000 m E, 7540000 m N) and its surrounding cities (Figure 1) and comprehends 10404 km2. The total population of the cities
included is over 870000. (IBGE, 2010). All the cities in Figure 1 are in the GAS occurrence area.
The main reasons for the focus on the area include i) interest of the Department of Water and Wastewater of Bauru in understanding the impact of the installation of new wells in the Guarani Aquifer System in the City; ii) the recent and available study of the hydrogeological characteristics in the Bauru City region (C3 CONSULTORIA, 2015) and iii) the new directives for the water supply in the 2014 to 2034 period, established by the Water Master Plan of Bauru (HIDROSAN, 2014).
The geology of Bauru City is composed mainly of the Formations Terezina and Piramboia from Triassic, Botucatu from Jurassic, and Serra Geral, Araçatuba, Adamantina and Marília from Creataceous (from the bottom to the top) (PAULA E SILVA; CHANG; CAETANO-CHANG, 2003). The last three
correspond to the Bauru Group. The Bauru Aquifer System (BAS) is composed of Marília and Adamantina Formations
and mostly unconfined in the City, while the Guarani Aquifer
System is composed of Botucatu and Piramboia Formations
and mostly confined. Paula e Silva and Cavaguti (1992) and Silva (2009) identified the inexistence of the Serra Geral Formation (a low permeable basaltic rock) in the southwestern region of Bauru (also called structural window), consequently, BAS can be directly superimposed on GAS. However, according to Silva and Chang (2010), the groundwater of those aquifers is not connected, probably due to the clayey layer at the bottom of the Bauru Group (Figure 2). C3 Consultoria (2015) agrees on the lack of hydraulic connections between the two aquifers, caused by the action of Araçatuba Formation as an aquitard. Moreover, they have different hydrogeochemical characteristics and the potentiometric surface of BAS is 40 to 160 m higher than that of GAS (SILVA; CHANG, 2010; C3 CONSULTORIA, 2015). On the other hand, the overexploitation of GAS increases the probability of occurrence of such a connection in wells with
structural problems, where the water can flow through one aquifer
to another. Silva (2009) and C3 Consultoria (2015) also stated the GAS thickness increased in the Northeast (around 350 m) and reduced in the Southwest (around 60 m), near Piratininga City. A similar thickness variation was observed by Paula e Silva and Cavaguti (1992; 1994) (Figure 2).
Until January 2015, 26 public wells had pumped water from GAS at an average 140 m3/h rate per well and 47 private
wells were operating at a rate lower than 25 m3/h (DAEE,
2015), except for the two Frigorífico Mondeli’s wells (72 m3/h).
The public, private and future public wells designed for Bauru City are shown in Figure 3.
Simplified hypothesis for the computational model
and parameters
The conceptual model is a set of hypotheses that simplify
the groundwater flow system. A simplified system is required for the
application of the AEM, once a detailed system description increase substantially the mathematical complexity and computational time and detailed hydrogeological data are rarely available. The hypotheses
defined are: i) the aquifer is confined, with no recharge or discharge
areas and the only groundwater input in the system is the regional
flow; ii) the aquifer is homogeneous and isotropic, therefore, the hydraulic conductivity (K) is uniform; iii) the steady-state flow has been reached; iv) the aquifer is infinite; v) the only pumping
wells that extract water from GAS are those drilled in Bauru City (Figure 3); vi) the aquifer in a 7 km radius circle area centered in Piratininga City (south-western of Bauru City) is 75% thinner than the regional aquifer thickness average, according to geological information from Paula e Silva and Cavaguti (1992), Silva (2009) and C3 Consultoria (2015).
GAS is represented as a hydrostratigraphic unit composed of Botucatu and Piramboia Formations and limited by Passa Dois Group at the lower boundary and Serra Geral Formation or Araçatuba Formation at the upper boundary. The sketch of the hydrogeological system (Figure 4) consists of the uniform
regional flow Q0 (Figure 4a) and the cylindrical inhomogeneity of radium R and thickness H+ (Figure 4b) considered in the
computational model.
The hydraulic conductivity was estimated by K=T/H’, where T is transmissivity and H’ is thickness. The thickness of
the aquifer at each well position was obtained by the stratigraphic
profile of public wells in Bauru. A 250 m average thickness was
estimated in a previous modeling of the Guarani Aquifer System in Bauru City (WATERLOO BRASIL, 2001).
Discharge vector of the uniform flow
The hydraulic gradient of the regional flow was determined by the natural levels of 13 first wells installed in Bauru City, between
1973 and 1985 (registers from DAEE, 2015). The groundwater pumping from a well was assumed to exert a minimal effect on the static level of the others in that period. Therefore, the initial potentiometric surface was estimated as a plan:
( )
f x, y Ax By C= − + (1)
where f(x,y) is the static piezometric head (m) observed in the well at a coordinate position (x,y) and A and B are the hydraulic gradients in the x and y directions, respectively. The discharge
vector of the uniform flow in the x (Qx0) and y (Qy0) directions and the regional direction (Q0) in m2/s are:
x0
Q KH
x
∂φ = −
∂ (2)
y0
Q KH
y
∂φ = −
∂ (3)
2 2
0 x0 y0
Q = Q +Q (4)
where K is the hydraulic coefficient (m/s) and H is the GAS thickness (m). Flow direction α is obtained by:
y0
x0 Q arctg
Q
α =
(5)
The reference point is a known and constant head used in the calculation of the constant value in the governing equations.
The location of the reference point was defined 28 km from the study area, where the hydraulic head is assumed not to be influenced
by the groundwater exploitation in Bauru City.
Analytical solution
The flow was assumed mainly horizontal, as a result of
the Dupuit-Forchheimer approximation, for the application of the Analytic Element Method. It is generally valid for regional aquifers, whose thickness is narrow in relation to their extension (DE LANGE, 1996). The specific discharge in the x direction
is defined as:
x
q K
x
∂φ = −
∂ (6)
In case of confined flow regime, the saturated thickness of the aquifer (h) is equal to the aquifer’s thickness (H). Otherwise, for unconfined flow, h is equal to the hydraulic head minus the
reference level (h= φ −b). The discharge potential is defined in
function of the hydraulic head for confined (and semi-confined) and unconfined aquifers (STRACK, 2003), i.e.:
( ) 1 2
KH b KH ; b H 2
Φ = φ − − φ − ≥ (7)
( )
1
K b ²; b H 2
Φ = φ − φ − < (8)
The head is higher than 1KH2
2 in regions where the aquifer is confined and lower where the aquifer is unconfined.
The analytic elements can be formulated in a complex
plane, where any point is defined by a complex variable z, which complex conjugate is defined as z, where
z= +x iy ; z= −x iy; i= −1 (9)
The discharge potential and streamlines are combined in a complex potential Ω( )z as:
( )z ( )z ( )z i
Ω = Φ + Ψ (10)
where the real part represents the discharge potential Φ and the imaginary part Ψ represents the streamline. In irrotational
and divergence-free flow (neither infiltration nor extraction), or harmonic flow, both potential and streamlines are orthogonal and
related by Cauchy-Riemann equations (STRACK, 2015). Each analytical element is a solution of Laplace equation:
2 2
2 2 0
x y
∂ Ω ∂ Ω+ =
∂ ∂ (11)
Given this linear equation, the solutions for the discharge potential can be added or subtracted for the derivation of a new solution (principle of superposition).
In this study, the analytic solution for two-dimensional
flow through circular inhomogeneity in the hydraulic conductivity
is used. The local coordinate system is defined as (BARNES;
JANKOVIĆ, 1999):
c z z Z
R
−
= (12)
where z is the location in global coordinates and Z= +X iY is the
same location specified in local coordinates. The boundary of the
circular inhomogeneity is given by:
i
Z=e ; 0θ ≤ θ < π2 (13)
The complex potential inside (Z<1) and outside (Z≥1) a circular inhomogeneity is given by (BARNES; JANKOVIĆ, 1999)
( )
( )
( )
n n n 0
c c c
n n n 1
a Z ; Z 1
Z Z Z i
a Z ; Z 1
∞ = ∞ − = <
Ω = Φ + Ψ =
− ≥ ∑ ∑ (14)
where a0 is real and all other an are complex. The complex
potential for the other elements, except inhomogeneity, is defined
by (BARNES; JANKOVIĆ, 1999):
( ) ( ) ( )
c Z c Z c Z i
≠ ≠ ≠
Ω = Φ + Ψ (15)
Therefore, the total complex potential is given by
( )Z c( )Z ≠c( )Z
Ω = Ω + Ω (16)
where Ω≠c( )Z and Ψc( )Z are continuous across the boundary of the circular inhomogeneity (there is no intersection between
the inhomogeneity and the other elements). The infinite sum
of Equation 14 in its truncated form results in (BARNES;
JANKOVIĆ, 1999):
( )
( )
( )
N 1 n n n 0
c c c
N 1 n n n 1
a Z ; Z 1
Z Z Z i
a Z ; Z 1
− = − − = <
Ω = Φ + Ψ =
− ≥ ∑ ∑ (17)
where 2N 1− is the number of degrees of freedom of coefficients
n
a . Barnes and Janković (1999) used the minimum square approach
for the calculation of coefficients, where M control points are
selected on the boundary of the circular inhomogeneity:
m
i m
Z =eθ ; m=0,1,…, M 1− (18)
and θ = πm 2 m / M are Fourier frequencies. Although Strack (1989) used M=2N 1− , Barnes and Janković (1999) recommend the use of higher M values for higher accuracy in the computed
coefficients (e. g. N 10= and M=50). In this study, N=20 and M=50 were used.
The equations of coefficients an are (BARNES; JANKOVIĆ, 1999):
( )
M 1
0 c m
m 0
K K 1
a K M + − ≠ = −
= Φ θ
∑
(19)
( )
M 1
n
n c m m
m 0
K K 1
a 2 Z
M K K + − − ≠ + = −
= Φ θ
+
∑
(20) n=1, 2…N
RESULTS AND DISCUSSIONS
Model parameters
Both discharge vector and water flow direction were calculated from the water level of wells drilled in the 1970’s and 1980’s (Figure 4a). The regional flow was assumed constant from 1973 to 2034, therefore, the hydraulic gradients were estimated
as ∂φ ∂ =/ x 5.7 10⋅ −4 m/m and 4
/ y 5.9 10−
∂φ ∂ = − ⋅ m/m, which
correspond to terms A and B in Equation 1. Term C, calculated by a linear polynomial interpolation, is equal to 465.9 m. In the
flow direction, the hydraulic gradient is 8.2∙10-4 m/m (0.82 m/km),
i.e., slightly lower than the gradients estimated from regional equipotential maps developed by Araújo, França and Potter (1999) (1.2 m/km) and Rocha et al. (2006) and LEBAC (2008) (1 m/km), probably due to the approximations in the equipotential delineation.
The discharge of the uniform regional flow was calculated with
the values of hydraulic conductivity and thickness of the GAS
(7.6∙10-6 m2/s). The regional flow direction in the GAS calculated
in the Bauru City is shown in Figure 5.
The parameters considered in the model are: thickness of the aquifer (H = 250 m), thickness of the aquifer in the inhomogeneity (H+ = 60m), uniform flow (
0
Q = 7.6.10-6 m2/s), hydraulic conductivity (shown in the calibration section), inhomogeneity radius (R = 7000 m), UTM coordinates of the center of the inhomogeneity (690000 m E, 7522500 m N); aquifer base elevation (b = 180 m AMSL), hydraulic head at the reference point (φ0 = 498.5 m) and UTM coordinates at the reference point (732000 m E, 7500000 m N). b was estimated by the mean of top elevations of GAS minus H. The information about the geological
stratification in each well was obtained from DAEE (2015).
Calibration
Calibration was performed by manual parameters adjustment for the achievement of calculated heads that approximate mean error and error standard deviation to zero and Pearson correlation to one. The static levels were measured right after the perforation of the wells. Once the pumping starts, the water level in the well
is dynamic and cannot represent the steady-state flow considered
in the simulations. Therefore, past conditions of the groundwater exploitation were simulated for the reproduction of groundwater
flow when the data were obtained. After successive simulations,
the 3.7.10-5 m/s hydraulic conductivity resulted in the best fit
(2.9.10-5 m/s), C3 Consultoria (2015) (3.8.10-5 m/s) and Waterloo
Brasil (2001) (4.0.10-5 m/s).
A sensitivity test was conducted manually through the change of each parameter at once (Q0, K, H or direction of the
regional flow) at a specific rate and analysis of the variation of
errors between calculated and observed heads. Results indicate higher sensitivity of hydraulic heads to changes in hydraulic conductivity than other parameters.
Potentiometry of GAS in Bauru city
Once the computational code had been implemented in
MATLAB, the complex potential for each defined point of the
domain was calculated. The equipotential (Φ) and streamlines (Ψ) were calculated from the real and imaginary part of the complex potential, respectively. The equipotential lines are perpendicular to the streamlines, according to Cauchy-Riemann conditions, as Figure 5. Regional groundwater flow direction in the Guarani Aquifer System calculated in Bauru City. Recharge areas of GAS are represented in blue.
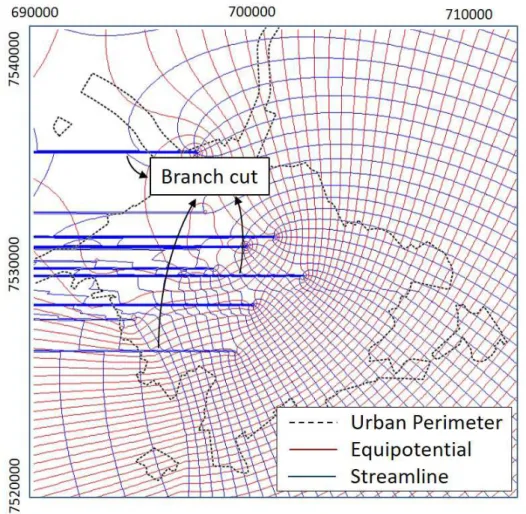
Figure 7. Equipotential and streamlines in the study area generated after the implementation of the computational code in MATLAB for the pumping conditions in 1988, at steady-state.
shown in Figure 7. Horizontal lines from each well have no physical meaning; they are called branch cuts and represent discontinuities
of the flow due to the groundwater extraction by wells. Changes
in the equipotential and streamlines are observed in the Southwest because of the circular inhomogeneity.
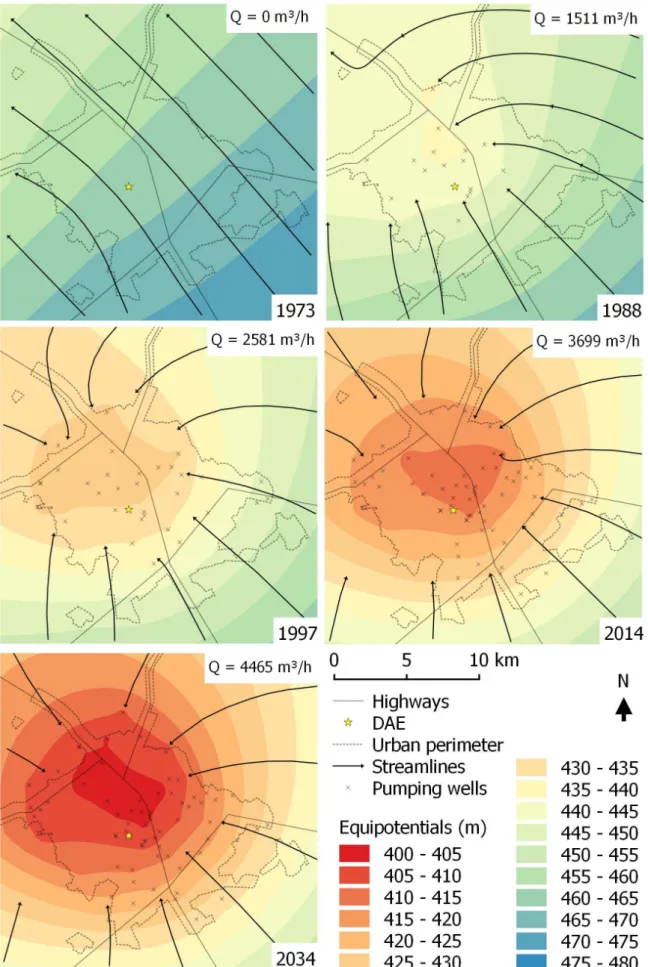
Figure 8 shows the potentiometric levels and streamlines prior to the exploration of GAS in Bauru City (1973). The streamlines
represent the flow direction in GAS. They are deformed in the
southwestern region because of the cylindrical inhomogeneity. Figure 8 also displays the potentiometric maps of GAS with pumping rates of years 1988 (1511 m3/h), 1997 (2581 m3/h),
2014 (3699 m3/h) and the future scenario of 2014 (4465 m3/h),
at steady-state flow. The groundwater flow was modified and directed to the city center. The drawdown at steady-state flow
after the groundwater exploitation of GAS in 1988 and 2014 reached 20 and 50 m, respectively. For the scenario of 2014, the
public wells operating under confined conditions are localized
in the North, Northeast and East of the City (see red marks in Figure 3). In the other regions, the wells operate under unconfined conditions, which suggest the hydraulic gradient in GAS has been changed due to the groundwater exploitation.
Regarding the exploitation conditions in 2034, the drawdowns can reach 55 to 60 m in the center of the City, in comparison to the initial condition (with no wells). From 2014 to 2034, approximately 10 m of drawdown are expected in the center and 15 m in the North, where most future wells are located.
Regional flow
The same conceptual model, governing equations, hydrogeological parameters and wells of the local model were
considered for the modeling of the regional groundwater flow
in GAS in Bauru City and its surrounding region. The drawdown caused by long-term groundwater pumping from GAS can propagates far away from the wells in Bauru City and reaches neighboring cities. The cities of Piratininga and Agudos are the most affected with a drawdown higher than 15 m for the pumping scenario of 2014. The capture zone (Figure 9) indicates
the area where the groundwater flow contributes to the pumping water from the wells in Bauru City, in 2014, at steady-state flow
CONCLUSIONS
The groundwater flow of the Guarani Aquifer System was
modeled by the Analytic Element Method for different scenarios
at steady-state flow. Estimated equipotential and streamlines were
generated with the annual average pumping rates of the wells. The methodology was suitable for the estimation of the
hydraulic gradient in the flow direction (0.82 m/km), the hydraulic
conductivity (3.7.10-5 m/s) and the mean thickness (250 m) of
GAS in Bauru City. The initial GAS groundwater regional flow
was estimated to be directed to the Northwest and progressively directed to the center of Bauru City due to the water exploitation by wells. The drawdowns estimated under the groundwater pumping
rates in 2014 at steady-state can reach 50 m and the flow regime in GAS is mainly unconfined, except for the northeastern region
of Bauru City. From 2014 to 2034, additional drawdowns of up to 15 m are expected in the North of the City, where the future wells will be located.
The growing exploitation of the GAS increases the size of the capture zone and can include many cities far from the groundwater extraction area in Bauru City. The drawdown in Piratininga and Agudos was simulated to be higher than 15 m, which emphasizes the regional aspect of the management of groundwater resources and the necessity of regional modeling studies for a better understanding of the hydrogeological processes of Guarani Aquifer System.
Modeling studies with the Analytical Element Method can be developed in other occurrence areas of Guarani Aquifer
System, and are specially useful where detailed information of the hydrogeological features is not available. However, local analysis should be done carefully, due to the model limitation on representing
the aquifer’s properties, such as heterogeneity and anisotropy.
This methodology approach provides valuable information for decision-making concerning groundwater resources management for large aquifers at long-term.
ACKNOWLEDGEMENTS
This study was supported by the National Council for
Scientific and Technological Development (CNPq – Conselho Nacional de Desenvolvimento Científico e Tecnológico), grant
number 131035/2015-0.
REFERENCES
ALENCAR, M. F.; WENDLAND, E. C. Método de elementos analíticos: uma alternativa para a modelagem de escoamento subterrâneo. Águas Subterrâneas, v. 27, p. 110-124, 2013. Available from: <http://aguassubterraneas.abas.org/asubterraneas/article/ view/21457/17706>. Access on: 8 jan. 2017.
aquifer system, USA. Hydrogeology Journal, v. 7, n. 3, p. 317-336, 1999. http://dx.doi.org/10.1007/s100400050205.
BAKKER, M.; ANDERSON, E. I.; OLSTHOORN, T. N.; STRACK, O. D. L. Regional groundwater modeling of the Yucca Mountain site using analytic elements. Journal of Hydrology, v. 226, n. 3-4, p. 167-178, 1999. http://dx.doi.org/10.1016/S0022-1694(99)00149-3.
BARNES, R.; JANKOVIĆ, I. Two-dimensional flow through large numbers of circular inhomogeneities. Journal of Hydrology, v. 226, n. 3-4, p. 204-210, 1999. http://dx.doi.org/10.1016/S0022-1694(99)00142-0.
BATISTA, J. A. N.; WENDLAND, E.; SCHULZ, H. E. Analytic element modelling for strip aquifers. Hydrological Processes, v. 26, n. 8, p. 1254-1262, 2012. http://dx.doi.org/10.1002/hyp.8222.
C3 CONSULTORIA. Diagnóstico hidrogeológico e a elaboração de propostas para a gestão dos recursos hídricos subterrâneos no município de Bauru/SP. Bauru: C3 Consultoria, 2015.
CAVICCHIA, M. E. Numerical model for groudwater management in the Ribeirão Preto pilot projet area. 2007. 170 f. Dissertação (Mestrado em Engenharia Civil) - Universidade de São Paulo, São Carlos, 2007. Available from: <http://www.teses.usp.br/ teses/disponiveis/18/18138/tde-09122007-192413/publico/ MarceloCavicchia.pdf>. Access on: 8 jan. 2017.
DEPARTAMENTO DE ÁGUAS E ENERGIA ELÉTRICA – DAEE. Relatórios dos poços de abastecimento público do município de Bauru. Araraquara: DAEE, 2015.
ESCOBAR, H. Water security: drought triggers alarms in
Brazil’s biggest metropolis. Science, v. 347, n. 6224, p. 812, 2015. PMid:25700493. http://dx.doi.org/10.1126/science.347.6224.812.
GUANABARA, R. C. Modelo transiente de fluxo em área de afloramento do sistema Aquífero Guarani. São Carlos: Universidade de São Paulo, 2011.
HAITJEMA, H. M. Analytic element modeling of groundwater flow. analytic
element modeling of groundwater flow. San Diego: Academic Press, 1995. http://dx.doi.org/10.1016/B978-012316550-3/50005-2.
HIDROSAN. Plano diretor de água de Bauru. Bauru: HIDROSAN, 2014.
INSTITUTO BRASILEIRO DE GEOGRAFIA E ESTATÍSTICA – IBGE. Cidades: infográficos: São Paulo: Bauru: dados gerais. Rio de Janeiro: IBGE, 2010. Available from: <http://www.cidades.ibge. gov.br/painel/painel.php?lang=&codmun=350600&search=sao-paulo%7Cbauru%7Cinfograficos:-dados-gerais-do-municipio>.
Access on: 15 oct. 2014.
INSTITUTO BRASILEIRO DE GEOGRAFIA E ESTATÍSTICA – IBGE. Cidades: São Paulo: Bauru. Rio de Janeiro: IBGE, 2016. Available from: <http://www.cidades.ibge.gov.br/xtras/perfil.
php?lang=&codmun=350600&search=%7C%7Cinfogr%E1fic os:-informa%E7%F5es-completas>. Access on: 2 july 2017.
LABORATÓRIO DE ESTUDOS DE BACIAS – LEBAC. Advances on Guarani Aquifer system knowledge. Rio Claro: LEBAC, 2008.
LANGE, W. J. Groundwater modeling of large domains with analytic elements. Delft: Delft University of Technology, 1996. Available from: <http://library.wur.nl/WebQuery/hydrotheek/lang/926962>.
Access on: 2 july 2017.
MATHWORKS. Matlab. [s.l.]: The MathWorks, 2011.
MELO, D. C. D.; WENDLAND, E.; GUANABARA, R. C. Estimate of groundwater recharge based on water balance in the unsaturated soil zone. Revista Brasileira de Ciência do Solo, v. 39, n. 5, p. 1336-1343, 2015. http://dx.doi.org/10.1590/01000683 rbcs20140740.
ORGANIZATION OF AMERICAN STATES – OAS. Guarani aquifer: strategic action program. Bogotá: OAS. 2009.
PAULA E SILVA, F.; CAVAGUTI, N. Gestão dos recursos hídricos subterrâneos na cidade de Bauru - SP, face às características hidrogeológicas especiais da região. In: CONGRESSO BRASILEIRO DE ÁGUAS SUBTERRÂNEAS, 7., 1992, Belo Horizonte. Anais… São Paulo: ABAS, 1992.
PAULA E SILVA, F.; CAVAGUTI, N. Nova caracterização estratigráfica e tectônica do Mesozóico na Cidade de Bauru - SP. Revista Geociências, v. 13, p. 81-99, 1994.
PAULA E SILVA, F.; CHANG, H. K.; CAETANO-CHANG, M. R. Perfis de referência do Grupo Bauru (k) no Estado de São Paulo. Geociências, v. 22, p. 21-32, 2003.
RABELO, J. L.; WENDLAND, E. Assessment of groundwater recharge and water fluxes of the Guarani Aquifer System, Brazil. Hydrogeology Journal, v. 17, n. 7, p. 1733-1748, 2009. http://dx.doi. org/10.1007/s10040-009-0462-y.
RABELO, J. L.; WENDLAND, E. Estudo da interação rio-aquífero no sistema Jacaré-Tietê. In: CONGRESSO BRASILEIRO DE ÁGUAS SUBTERRÂNEAS, 16.; ENCONTRO NACIONAL DE PERFURADORES DE POÇOS, 17., 2010, São Luís. Anais… São Paulo: ABAS, 2010. p. 1-15.
ROCHA, G.; FERNANDES, A. J.; MANCUSO, M. A.; CAMPOS, J. E.; ARMANDO, T.; ODA, G. H.; PAULON, N. Mapa de águas subterrâneas do Estado de São Paulo. In: CONGRESSO BRASILEIRO DE ÁGUAS SUBTERRÂNEAS, 14., 2006, Natal. Anais… São Paulo: ABAS, 2006. p. 1-20.
SILVA, S. R.; CHANG, H. K. Hidroquímica dos sistema aquíferos Bauru e Guarani ma região metropolitana de Bauru. Águas Subterrâneas, v. 24, n. 1, p. 69-84, 2010.
STRACK, O. D. L. (1989). Groundwater mechanics. Englewood Cliffs: Prentice-Hall.
STRACK, O. D. L. Theory and applications of the Analytic Element Method. Reviews of Geophysics, v. 41, n. 2, p. 1005, 2003. http://dx.doi.org/10.1029/2002RG000111.
STRACK, O. D. L. Applied groundwater mechanics. Minnesota: [s.n.], 2015.
WATERLOO BRASIL. Modelagem matemática de fluxo das águas subterrâneas. Bauru: Waterloo Brasil, 2001.
WENDLAND, E.; ALENCAR, M. F.; STRACK, O. D. L. Teoria e aplicações do Método de Elementos Analíticos. Revista Brasileira de Recursos Hídricos, v. 14, n. 3, p. 5-15, 2009. http://dx.doi. org/10.21168/rbrh.v14n3.p5-15.
Authors contributions
Vinicius Ferreira Boico: Main author of the work, defended this work for his master degree.
Edson Wendland: Advisor of the master degree dissertation that originated this work.