Printed version ISSN 0001-3765 / Online version ISSN 1678-2690 http://dx.doi.org/10.1590/0001-3765201720160065
www.scielo.br/aabc
Applicability of geomechanical classifications for estimation
of strength properties in Brazilian rock masses
TATIANA B. SANTOS, MILENE S. LANA, ALLAN E.M. SANTOS and LARISSA R.C. SILVEIRA
Departamento de Engenharia de Minas, Universidade Federal de Ouro Preto, Rua Diogo Vasconcelos, 122, 35400-000 Ouro Preto, MG, Brazil
Manuscript received on February 11, 2016; accepted for publication on December 5, 2016
ABSTRACT
Many authors have been proposed several correlation equations between geomechanical classifications and strength parameters. However, these correlation equations have been based in rock masses with different
characteristics when compared to Brazilian rock masses. This paper aims to study the applicability of
the geomechanical classifications to obtain strength parameters of three Brazilian rock masses. Four classification systems have been used; the Rock Mass Rating (RMR), the Rock Mass Quality (Q), the
Geological Strength Index (GSI) and the Rock Mass Index (RMi). A strong rock mass and two soft rock
masses with different degrees of weathering located in the cities of Ouro Preto and Mariana, Brazil;
were selected for the study. Correlation equations were used to estimate the strength properties of these rock masses. However, such correlations do not always provide compatible results with the rock mass
behavior. For the calibration of the strength values obtained through the use of classification systems,
stability analyses of failures in these rock masses have been done. After calibration of these parameters, the applicability of the various correlation equations found in the literature have been discussed. According to the results presented in this paper, some of these equations are not suitable for the studied rock masses. Key words: geomechanical classifications, rock slopes, stability analyses, strength properties of rock masses.
Correspondence to: Tatiana Barreto dos Santos E-mail: [email protected]
INTRODUCTION
Rock masses are made of intact rocks and discontinuities. In order to quantify the quality of rock masses, several authors have proposed geomechanical classifications systems, like the
RMR (Bieniawski 1989), the Q system (Barton
et al. 1974), the GSI (Hoek 1994) and the RMi (Palmström 1995). They are important tools, widely
used by geotechnical engineers for estimation of
rock mass and discontinuity properties. Knowledge
of these strength properties is essential to predict
failures in urban, roadway and mining slopes.
Besides the geomechanical classifications,
stability analysis is also a good tool for estimating
mechanical properties of rock masses. Through this
analyses, it is possible to reproduce the conditions
at the time of failure, once the factor of safety (FS
Stability analysis methods have been thoroughly researched. They present reliable results and generally represent what really occurs in rock masses. However, they depend on strength properties of rock masses. The knowledge of strength properties by in situ tests is highly
relevant, but difficulties associated with sampling
and execution of them precludes their use, leading to the employment of indirect methods, like the
geomechanical classifications.
Many authors have been proposed several
correlation equations between the classifications
and strength parameters. They are presented in this paper. However, these correlation equations
have been proposed for rock masses with different
characteristics when compared to Brazilian rock masses. This paper aims to study the applicability of the geomechanical classifications to obtain strength parameters of three Brazilian rock masses.
Three rock slopes were selected in the cities of Ouro Preto and Mariana in Minas Gerais province, Brazil. Geological and geotechnical survey and
geomechanical classification of the rock masses
were carried out. Strength parameters of these rock masses were estimated based on geomechanical
classifications. The stability analyses of failures
were used for calibration of the rock mass parameters given by correlation equations. Rock
masses with different lithologies and characteristics
were selected for this study in order to test the
applicability of the geomechanical classifications to obtain strength properties in different cases.
MATERIALS AND METHODS
GEOLOGICAL AND GEOTECHNICAL SURVEY
The geological and geotechnical surveys were done in two slopes excavated in schists and in a hill consisted of quartzite. They were performed
basically in two stages. In the first stage, study of the
geological context and observation of petrographic features on hand samples have been done.
Geological maps of the area, on a scale of 1:25000, were used in this study. In the second stage the geotechnical survey of the discontinuities has been carried out. In this stage, survey of the spacing, persistence, opening, roughness and weathering were made in outcrops with easy access. Spacing and opening were measured with tapes. Persistence was estimated through observations in the outcrops. Roughness was estimated based on the roughness
profiles proposed by Barton (1978). Weathering
was estimated based on a table proposed by ISRM (1981), witch correlates de degree of weathering with the characteristics of the rock mass.
INTACT ROCK STRENGTH
Three types of tests to measure the intact rock strength were done: point load test, geological hammer test and Schmidt rebound test. Samples yielded by drills were not available in the sites, precluding the execution of uniaxial compression tests.
Point load tests were performed as recommended by ISRM (2007). Samples were cut parallel and perpendicular to the foliation. The load value at the time of the failure (P) and the distance between the two conical platens (De) were taken. The point load index (Is) and the point load index adjusted for samples with 50 mm (Is(50)) were obtained from equations (1) and (2). Equations (3) and (4), proposed by Singh and Singh (1993) and Basu and Kamran (2010), were used to estimate the
uniaxial compressive strength (σc) from point load
test in quartzites and schists, respectively.
2
e P Is
D
= (1)
( )
0.45
50
50
e
D
Is = ×Is
(2)
( )50
11.103. 37.659
c Is
σ = + (4)
In case of the schists, the sampling of rock mass to perform the strength tests was possible. However, in case of the quartzite the sampling was not possible due to the high strength of the rock. Therefore, rock samples which have been located at the toe of the slope were used.
Geological hammer tests were performed as usual. Rock masses tested with geological
hammer were classified as R0 (very soft rocks) to
R6 (extremely strong rocks), according to ISRM (1981).
Schmidt rebound tests were performed according to ASTM (2001). Schmidt hammer type N was used. For a good result it is necessary to find a fresh rock outcrop, sand the surface and apply the Schmidt hammer perpendicularly to the sanded surface. The tests were performed at regular intervals considering a scanline along the outcrop. Then, the equation (5), proposed by Shalabi et al. (2007), was chosen for estimating the uniaxial compressive strength in schists. Equation (6), proposed by Aydin and Basu (2005), was needed to
find values through.
σc=3.201RL– 46.59 (5)
3.3673 1.064
N L
R
R = − (6)
Where:
σc is the uniaxial compressive strength;
RL is the rebound value obtained by Schmidt
hammer type L;
RN is the rebound value obtained by Schmidt hammer type N.
Equations for estimating the uniaxial
compressive strength for quartzite have not been found in the literature. Equations for other lithology types have not yielded coherent results.
APPLICATION OF THE GEOMECHANICAL CLASSIFICATION SYSTEMS
RMR, Q, GSI and RMi systems were applied
to the studied slopes. Since the geomechanical
classifications were used to estimate the strength
parameters of the studied rock masses, the basic
RMR and the basic Q index were used. This is recommended by the authors of the classification systems. Basic RMR is based on five parameters,
which are the uniaxial compressive strength,
RQD, spacing, condition of discontinuities and the
maximum value for groundwater parameter. The system proposed by Bieniawski (1989) is the most used geomechanical classification in the world.
Basic Q index was proposed by Barton et al. (1974) and it is based on the follow parameters: RQD,
joint set number (Jn), joint roughness number (Jr) and joint alteration number (Ja). GSI is based on a visual assessment of the characteristics of rock mass. The structure and the quality of the surface of the rock mass are evaluated.
Although the RMi system has not been widely used, it seems to be based on field straightforward parameters and it was used in this paper. It is calculated by the product of the uniaxial compressive strength of intact rock and a reduction factor of strength (jointing parameter,
JP) that represents the effects of discontinuities on
the strength of rock masses. JP is a combination of block size, measured in terms of its volume (Vb), and the joint condition factor (Jc). JP is equal to 1 when the rock is intact and equal to 0 when the rock is completely fractured.
APPLICATION OF THE CORRELATION EQUATIONS
TO ESTIMATE STRENGTH PARAMETERS IN ROCK MASSES
There are many correlation equations between
classification systems and mechanical parameters
of cohesion and friction angle for rock masses, according to RMR values. They are presented in Table I.
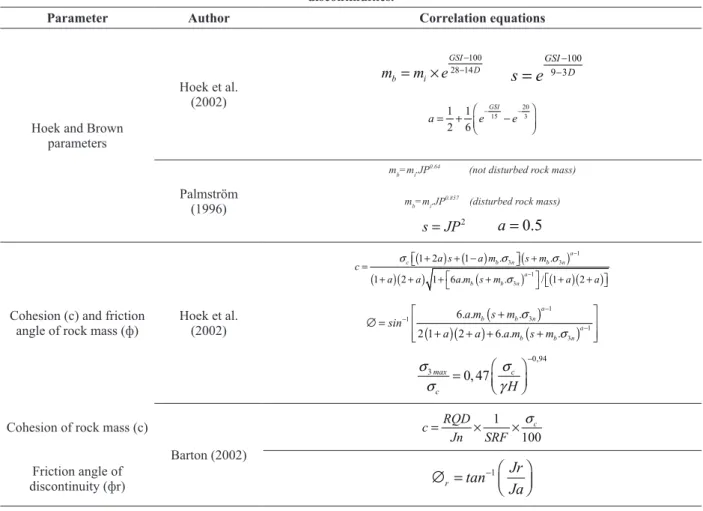
Many other authors have proposed correlation equations between geomechanical classification systems and strength properties of rock masses. The most commonly used equations were applied in this study. They are shown in Table II.
APPLICATION OF THE BARTON-BANDIS CRITERION
A criterion for determining discontinuity shear strength was proposed by Barton and Bandis (1982), to take into account the roughness of discontinuities. This criterion was used in one of the studied slopes because it yielded reliable results comparing to other criteria. It is presented in Equation (7).
10
tan log r
JCS JRC
τ σ
σ
= + ∅
(7)
Where:
JRC is the joint roughness coefficient; JCS is the joint wall compressive strength; фr is the residual friction angle.
In this study, JRC was obtained by an abacus proposed by Barton and Bandis (1982), which relates the amplitude of discontinuity to the length of its measured profile. JCS is the joint wall compressive strength, which was obtained through RMi.
STABILITY ANALYSES FOR CALIBRATION OF STRENGTH PARAMETERS
Stability analyses were used in this study to calibrate the strength parameters obtained from the geomechanical classifications. Rocscience software were used in these analyses. Deterministic stability analyses were performed. The selection of the software for stability analyses was made based on failures that had already occurred in the studied rock masses. The software used, with their
characteristics and applications, were presented below.
Slide v. 6.0: Slide is a 2D slope stability program for evaluating the safety factor or probability of failure, of circular or non-circular failure surfaces in soil or rock slopes. Slide is very simple to use, and yet complex models can be created and analyzed quickly and easily. External loading, groundwater and support can all be modeled in a variety of ways (Rocscience Inc. 2010).
Swedge v. 6.0: Swedge is a quick, interactive and simple to use analysis tool for evaluating the geometry and stability of surface wedges in rock
slopes. Wedges are defined by two (or three)
intersecting discontinuity planes, the slope surface and an optional tension crack (Rocscience Inc. 2006).
RocTopple v. 1.0: RocTopple is an interactive software tool for performing toppling analysis and support design of rock slopes. The analysis is based on the popular limit equilibrium block toppling method of Goodman and Bray first published in a paper, Toppling of Rock Slopes, in 1976 (Rocscience Inc. 2014).
All the software used in this study are based on limit equilibrium analysis and solutions proposed by experts, that published their methodologies in the literature.
RESULTS
CHARACTERIZATION OF THE STUDIED ROCK MASSES
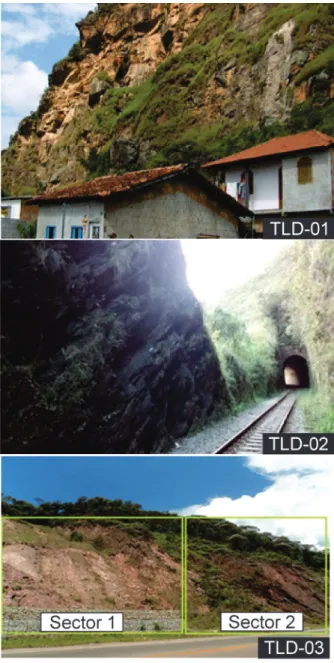
The first slope (TLD-01) studied is located in Cabanas neighborhood, Mariana city. The region is an irregular settlement. Rock block falls are a common occurrence in this site. The entire slope is 275 meters in length and has variable height. Its geographical coordinates are 20° 24’ 2.15” and
43° 25’6.68” W. An outcrop which is 30 meters in
accessibility and the ease to perform data survey.
The TLD-01 slope can be seen in Figure 1, which shows the high vulnerability situation of residences
below it.
The outcrop of TLD-01 was split in five
sectors, for taking into account the different
geomechanical behavior observed when data from
geotechnical survey were analyzed.
The second slope (TLD-02) is located on the
railway which connects the cities of Ouro Preto and
Mariana. It is 9 meters high, with a dip of 89° and
geographical coordinates of 20°23’ 34.8” S 43°29’
58.3” W. This rock mass has apparently regular
quality and high degree of fracturing. Rock blocks
forming a stepped base can be seen, although
toppling failure was not identified in this site.
Maybe toppling failure has been occurred during
the slope excavation due to blasting. The TLD-02
slope is shown in Figure 1.
The third slope (TLD-03) studied is located
on the Inconfidentes’s highway near the km 88.
The slope was split in two sectors, since they have
different geomechanical characteristics. Sector 1
has high degree of fracturing and weathering, 100
meters in length, two benches of approximately 15
and 20 meters in length and a berm of 2 meters
wide. Sector 2 presents low degree of weathering
and fracturing. TLD-03 slope is shown in Figure 1.
GEOLOGICAL AND GEOTECHNICAL DATA
The geological and geotechnical data were
surveyed as described in the methodology. Average
values for each parameter evaluated in field were
considered. Table III shows the geological and
geotechnical data for the three slopes studied and
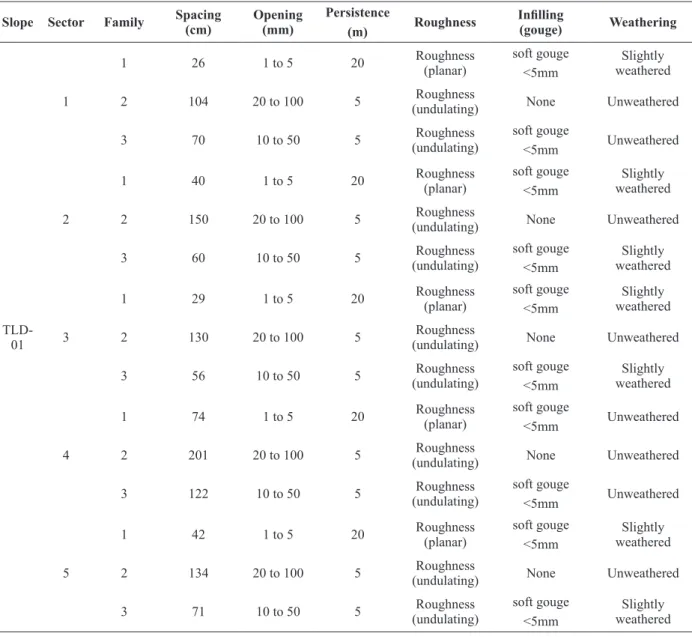
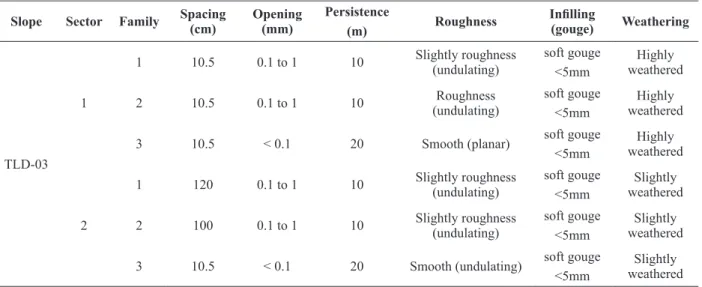
Tables IV, V and VI show the characteristics of the
discontinuities for TLD-01, TLD-02 and TLD-03, respectively.
Figure 1 - Studied slopes.
TABLE I
Correlation between RMR classes and strength parameters of rock masses (Bieniawski 1989).
RMR class I II III IV V
Cohesion
(KPa) >400 300-400
200-300 100-200 <100
Friction
TABLE II
Correlation equations between geomechanical classifications and mechanical properties of rock masses and discontinuities.
Parameter Author Correlation equations
Hoek and Brown parameters
Hoek et al. (2002) 100 28 14 GSI D b i
m m e
− − = × 100 9 3 GSI D
s
e
− −=
20 15 3 1 1 2 6 GSI a= + e− −e−
Palmström (1996)
mb=mi.JP0.64
(not disturbed rock mass)
mb=mi.JP 0.857
(disturbed rock mass)
2
s=JP a=0.5
Cohesion (c) and friction
angle of rock mass (ф) Hoek et al. (2002)
( ) ( ) ( ) ( )( ) ( ) ( )( ) 1 3 3 1 3
1 2 1 . .
1 2 1 6 . . / 1 2 a
c b n b n
a b b n
a s a m s m
c
a a a m s m a a
σ σ σ
σ − − + + − + = + + + + + + ( ) ( )( ) ( ) 1 3 1 1 3
6. . .
2 1 2 6. . .
a
b b n
a
b b n
a m s m sin
a a a m s m σ σ − − − + ∅ = + + + + 0,94 3 0, 47 max c c H σ σ σ γ − =
Cohesion of rock mass (c)
Barton (2002) 1 100 c RQD c Jn SRF σ = × ×
Friction angle of
discontinuity (фr) r 1
Jr tan Ja − ∅ =
Where, mb is a reduced value of the material constant mi; s and are a constants for the rock mass; JP is the joint parameter obtained
by RMi; σc is the uniaxial compressive strength of the intact rock; γ is the unit weight; H is the height of the slope and σ3n is defined
by expression: 3max c σ
σ and SRF (stress reduction factor) = 1.
TABLE III
Geological and geotechnical data for the three studied slopes.
Slope Mineralogy Petrography Slope
(Dip/Dip direction)
Discontinuities (Dip/Dip direction) Family 1 Family 2 Family 3
TLD-01 Quartz, biotite,
muscovite Quartzite 82/137 22/324 62/221 59/159
TLD-02 Quartz, chlorite, muscovite
Quartz-chlorite-muscovite-schist 88/259 37/195 46/139 49/042
TLD-03 Quartz, chlorite, muscovite
TABLE IV
Characteristics of the discontinuities of the TLD-01.
Slope Sector Family Spacing (cm) Opening (mm) Persistence
(m) Roughness Infilling (gouge) Weathering
TLD-01
1
1 26 1 to 5 20 Roughness
(planar)
soft gouge <5mm
Slightly weathered
2 104 20 to 100 5 Roughness
(undulating) None Unweathered
3 70 10 to 50 5 Roughness
(undulating)
soft gouge
<5mm Unweathered
2
1 40 1 to 5 20 Roughness
(planar)
soft gouge <5mm
Slightly weathered
2 150 20 to 100 5 Roughness
(undulating) None Unweathered
3 60 10 to 50 5 Roughness
(undulating)
soft gouge <5mm
Slightly weathered
3
1 29 1 to 5 20 Roughness
(planar)
soft gouge <5mm
Slightly weathered
2 130 20 to 100 5 Roughness
(undulating) None Unweathered
3 56 10 to 50 5 Roughness
(undulating)
soft gouge <5mm
Slightly weathered
4
1 74 1 to 5 20 Roughness
(planar)
soft gouge
<5mm Unweathered
2 201 20 to 100 5 Roughness
(undulating) None Unweathered
3 122 10 to 50 5 Roughness
(undulating)
soft gouge
<5mm Unweathered
5
1 42 1 to 5 20 Roughness
(planar)
soft gouge <5mm
Slightly weathered
2 134 20 to 100 5 Roughness
(undulating) None Unweathered
3 71 10 to 50 5 Roughness
(undulating)
soft gouge <5mm
Slightly weathered
TABLE V
Characteristics of the discontinuities of the TLD-02.
Slope Sector Family Spacing (cm)
Opening (mm)
Persistence
(m) Roughness
Infilling
(gouge) Weathering
TLD-02
-1 25 < 0.1 15 Smooth
(undulating)
soft gouge <5mm
Slightly weathered
2 42 0.1 to 1 10
Slightly roughness (undulating)
soft gouge <5mm
Slightly weathered
3 38 0.1 to 1 10
Slightly roughness (undulating)
STRENGTH TESTS IN INTACT ROCK
Three types of strength tests were made to obtain the uniaxial compressive strength. In case of the point load and Schmidt rebound tests, correlation equations were used to obtain the uniaxial compressive strength, according to the lithology. Table VII shows the uniaxial compressive strength obtained for TLD-01, TLD-02 and TLD-03.
The same value of point load test in TLD-01 was considered because loosen blocks available at the site were used for the tests. The samples were prepared using these blocks, according to the recommendations of ISRM (2007).
GEOMECHANICAL CLASSIFICATIONS
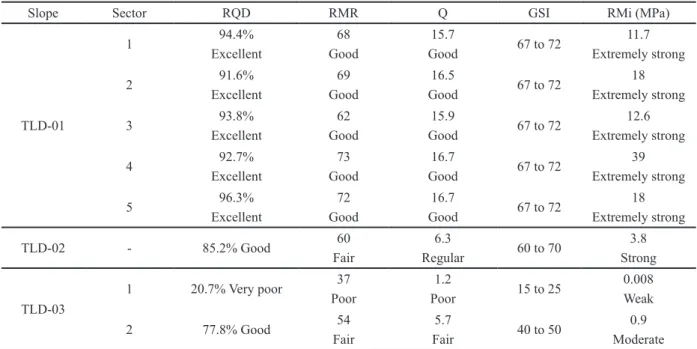
Rock masses are classified according to RQD, RMR, Q, GSI and RMi. In case of the RQD, it was
obtained using equation proposed by Palmström (1982). In other classifications systems, the discontinuity in the worst condition was used to obtain the indices. The results are shown in Table VIII.
MECHANICAL PROPERTIES OF ROCK MASSES
There are several correlation equations between the geomechanical classifications and strength
TABLE VI
Characteristics of the discontinuities of the TLD-03.
Slope Sector Family Spacing (cm) Opening (mm) Persistence
(m) Roughness Infilling (gouge) Weathering
TLD-03 1
1 10.5 0.1 to 1 10 Slightly roughness
(undulating)
soft gouge <5mm
Highly weathered
2 10.5 0.1 to 1 10 Roughness
(undulating)
soft gouge <5mm
Highly weathered
3 10.5 < 0.1 20 Smooth (planar) soft gouge
<5mm
Highly weathered
2
1 120 0.1 to 1 10 Slightly roughness
(undulating)
soft gouge <5mm
Slightly weathered
2 100 0.1 to 1 10 Slightly roughness
(undulating)
soft gouge <5mm
Slightly weathered
3 10.5 < 0.1 20 Smooth (undulating) soft gouge <5mm
Slightly weathered
TABLE VII
Uniaxial compressive strength obtained for 01, TLD-02 and TLD-03.
Slope Sector
Point load test
Geological hammer test
Schmidt hammer
test
TLD-01 1
90.16 MPa
50 to 100MPa
-2 100 to 250 MPa
3 50 to 100MPa
4 100 to 250 MPa
5 100 to 250 MPa
TLD-02 - 38.39
MPa 25 to 50 MPa
27.01 MPa
TLD-03
1 - 1 to 5 MPa 24.88
MPa
2 - 5 to 25 MPa 33.92
MPa
properties of the rock masses, as discussed before. The values obtained by these correlation equations
are shown in Table IX.
BARTON AND BANDIS CRITERION
The parameters of the Barton and Bandis criterion were obtained for the toppling discontinuity
(family 3) and the basal discontinuity (family 1) of
the TLD-02. JRC is 12, for both families. JCS was
obtained by RMi and it corresponds to the uniaxial
TABLE IX Strength parameters.
Slope Sector
Cohesion and friction angle of the rock mass by Bieniawski (1989)
Cohesion of the rock
mass by Barton (2002)
Discontinuity friction angle by Barton
(2002)
Parameters of the Hoek and Brown criterion by Hoek et
al. (2002)
Parameters of the Hoek and Brown criterion by
Palmström (1996)
TLD-01 1
300 to 400 MPa 35º to 45º
9.4 MPa
56º (family 1) 72º (family 2) 72º (family 3)
mb = 6.85 s = 0.036 a = 0.501 c = 2.548 MPa
ф = 64º
mb = 5.42 s = 0.0169
a = 0.5 c = 1.4 MPa
ф = 61º
2 13.2 MPa
56º (family 1) 72º (family 2) 72º (family 3)
mb = 5.93 s = 0.0225
a = 0.5 c = 2.0 MPa
ф = 63º
3 9.6 MPa
56º (family 1) 72º (family 2) 72º (family 3)
mb = 5.68 s = 0.0196
a = 0.5 c = 1.5 MPa
ф = 62º
4 16.7 MPa
63º (family 1) 72º (family 2) 72º (family 3)
mb = 8.45 s = 0.0676
a = 0.5 c = 4.2 MPa
ф = 64º
5 13.3 MPa
56º (family 1) 72º (family 2) 72º (family 3)
mb = 5.93 s = 0.0225
a = 0.5 c = 2.0 MPa
ф = 63º
TABLE VIII
Geomechanical classification of the TLD-01, TLD-02 and TLD-03.
Slope Sector RQD RMR Q GSI RMi (MPa)
TLD-01 1 94.4% Excellent 68 Good 15.7
Good 67 to 72
11.7 Extremely strong 2 91.6% Excellent 69 Good 16.5
Good 67 to 72
18 Extremely strong 3 93.8% Excellent 62 Good 15.9
Good 67 to 72
12.6 Extremely strong 4 92.7% Excellent 73 Good 16.7
Good 67 to 72
39 Extremely strong 5 96.3% Excellent 72 Good 16.7
Good 67 to 72
18 Extremely strong
TLD-02 - 85.2% Good 60
Fair
6.3
Regular 60 to 70
3.8 Strong
TLD-03
1 20.7% Very poor 37
Poor
1.2
Poor 15 to 25
0.008
Weak
2 77.8% Good 54
Fair
5.7
Fair 40 to 50
Slope Sector
Cohesion and friction angle of the rock mass by Bieniawski (1989)
Cohesion of the rock
mass by Barton (2002)
Discontinuity friction angle by Barton
(2002)
Parameters of the Hoek and Brown criterion by Hoek et
al. (2002)
Parameters of the Hoek and Brown criterion by
Palmström (1996)
TLD-02 1 200 to 300 KPa
25º to 35º 25.5MPa
35º (family 1) 45º (family 2) 45º (family 3)
mb = 3.43 s = 0.02 a = 0.502 c = 0.482 MPa
ф = 60º
mb = 3.41 s = 0.02
a = 0.5 c = 0.483 MPa
ф = 59º
TLD-03
1 100 to 200 KPa
15º to 25º 0.05 MPa
37º (family 1) 47º (family 2) 26º (family 3)
mb = 0.689 s = 0.000137
a = 0.544 c = 0.129 MPa
ф = 43º
mb = 1.33 s = 0.001 a = 0.5 c = 0.215 MPa
ф = 49º
2 200 to 300 KPa
25º to 35º 0.086 MPa
45º (family 1) 45º (family 2) 34º (family 3)
mb = 1.683 s = 0.002 a = 0.508 c = 0.189 MPa
ф = 56º
mb = 2.59 s = 0.008 a = 0.5 c = 0.322 MPa
ф = 58º
TABLE IX (continuation)
3.8 MPa. The roughness angle of discontinuities was measured in the field. The friction angle of the discontinuities was estimated through the equation proposed by Barton (2002). To obtain the residual friction angle of discontinuities in Barton and Bandis criterion, the roughness angle was subtracted from the friction angle. The results were 27º and 33º for family 1 and 3, respectively.
STABILITY ANALYSES
Calibration of the strength parameters obtained from the correlation equations was done by stability analyses of failures observed in slopes. TLD-02 presents block toppling occurrence, probably during the railway construction. Actually the slope
is stable, according to observations in the field.
TLD-03 presents two types of failures. In sector 1 an approximate circular failure was observed and in sector 2 a wedge failure was noticeable.
Mohr-Coulomb and Barton and Bandis criteria were used in the analysis of the TLD-02. In case of the Mohr-Coulomb criterion, the value used
for the cohesion is zero, since infilling material
is absent or has very small thickness. The friction angle of the toppling discontinuity is 45º and for the basal discontinuity it is 35º. These values were obtained through the equation proposed by Barton (2002), see Table IX. The stability analysis using Mohr-Coulomb criterion returned incompatible
values for the safety factor; they were below 1.
However, the analysis using the Barton and Bandis criterion returned an acceptable result. Factor of
safety obtained was 1.754 with 50% of water; that
condition was considered representative for this slope. The analysis was made using RocTopple software v.1 from Rocsience Inc. (2014). Table X shows the geometric data of the slope and Figure 2 shows the stability analysis results.
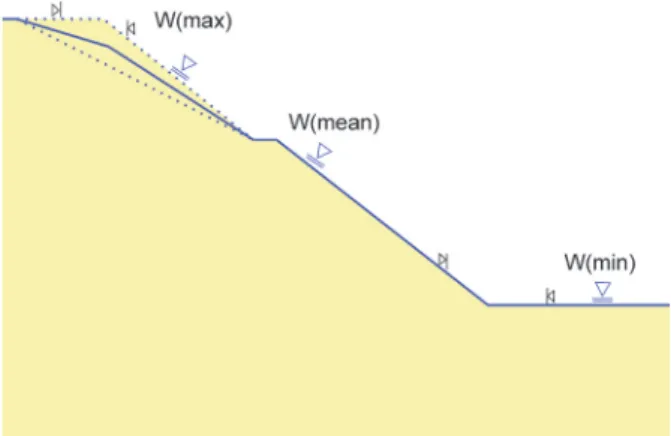
For analysis of the circular failure in the sector 1 of the TLD-03 slope, Slide v.6 from Rocscience Inc. (2010) was used. Sensitivity analyses were made to determine the position of the water table at the time of the failure. The minimum and
maximum positions of water tables were defined
TABLE X
Geometric data of the slope failure.
Slope Toppling joint
Height 5.0 meters Spacing 0.44 meters
Dip 88° Dip 48°
Inclination of the top
plan
0° Overall base inclination
47° - 67° (range for variation)
based on the knowledge that the failure occurred in a very raining period. Figure 3 shows the geometry
of the slope and the locations of minimum (Wmin =
0), maximum (Wmax = 1) and medium (Wmean) water table, generated by Slide.
The strength criterion of Hoek and Brown was used for the analysis. The strength parameters were obtained through GSI and RMi, see Table IX. The analysis considering the strength values obtained by GSI yielded conservative results comparing to the analysis using the RMi strength estimates (Figure 4). A factor of safety equal 1 was obtained
for Wmin in case of GSI and equal 1 for Wmax in case of RMi. Both situations are related to high degrees of saturation.
The values of the cohesion and friction angle of the rock mass obtained from correlation with the parameters of the Hoek-Brown criterion returned an incompatible factor of safety value equal 4.3 and 7.2, using GSI and RMi, respectively.
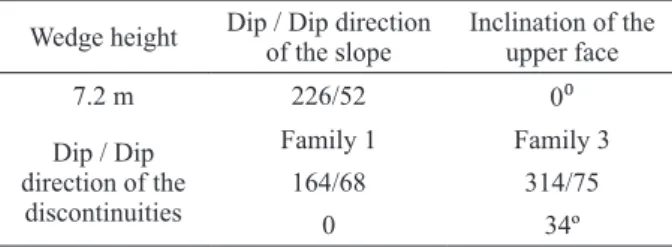
In case of the stability analysis of the wedge
failure in sector 2 of the TLD-03 slope, Swedge
v.6 software from Rocscience Inc. (2006) was
used. Table XI shows the geometric data of the
slope and discontinuities, measured in failure
surface.
The strength criterion used was the Mohr-Coulomb. Cohesion was considered null because
filling material is absent and friction angle equal
to 34, obtained through the equation suggested
Figure 2 - Stability analysis in RocTopple.
Figure 3 - Geometry of the slope and locations of minimum
(Wmin), maximum (Wmax) and medium (Wmean) water
tables.
TABLE XI
Geometric data of the slope and discontinuities.
Wedge height Dip / Dip direction
of the slope
Inclination of the upper face
7.2 m 226/52 0⁰
Dip / Dip direction of the discontinuities
Family 1 Family 3
164/68 314/75
0 34º
by Barton (2002), see Table IX. The percentage of saturation varied until a safety factor of 1 was obtained. This occurred when the saturation reached 100%. Figure 5 shows the analysis result and the wedge geometry.
DISCUSSION
The degree of weathering is a huge obstacle in the geotechnical survey. Visibility of discontinuities
is hampered by weathering; it happened during field survey in the sector 1 of the TLD-03 slope. In
the TLD-01 geological structures are more clearly
defined, facilitating the data survey.
The point load test proved to be applicable in TLD-01 and TLD-02 slopes and provided uniaxial compressive strength values within the range obtained through the geological hammer test. The Schmidt hammer test provided values with relatively large deviation from the average values. These values do not fall in the ranges suggested by
the geological hammer test; they were very high.
Therefore, it can be concluded the use of Schmidt hammer should be avoided in soft rocks. Geological
hammer test proved to be a simple and effective
method for estimating the uniaxial compressive strength.
The RQD depends of the scanline direction and the cutoff considered. Since the RQD is an index used in most of geomechanical classification systems, such as RMR and Q, uncertainties can be
introduced in evaluation of rock mass quality.
RMR, GSI and Q systems proved to be easier to
apply in the rock masses. Especially the GSI system,
which considers only two visual characteristics of the rock masses, the structure and the nature of the discontinuity surfaces. Among the geomechanical
classification systems, the RMi is more reliable,
once description of discontinuity parameters at the
field permits an objective evaluation of them. All the geomechanical classifications showed that the rock mass of TLD-03 is different from other
rock masses studied. This is noticeable especially in sector 1, where the weathering degree is very high.
As expected, the RMi is the classification which
best caught the differences between the sectors considered, even in TLD-01, as demonstrated by
the value in sector 4, which is significant higher
than the others. Another advantage of RMi is the fact that it has a clear physical meaning, as it represents the compressive strength of the rock mass. It could be seen that the compressive strength of the rock mass of sector 1, TLD-03, is many times smaller compared to the other rock masses studied. In case of sector 2, TLD-03, the difference in strength compared to TLD-02 and TLD-03 is clear. Moreover, the compressive strength of quartzite in TLD-01 is somewhat higher than the schists in other slopes.
of the rock mass in TLD-03, sector 1. Cohesion and friction angle obtained through correlation equations with the Hoek and Brown criterion were
not compatible, because maximum σ3 (Table II) leaded to unreasonable values of shear strength of the rock mass. The introduction of slope height
in σ3 equation yielded illogical values of cohesion and friction angle, precluding the use of Mohr-Coulomb criterion.
Estimates of the rock mass strength by Hoek and Brown criterion provided by GSI yielded better results for the stability analysis of the circular failure in sector 1 of TLD-03 slope than the ones yielded by RMi (Figure 5), because the safety factor for some analyses with high degree of saturation using RMi was 1.3.
Table I, proposed by Bieniawski (1989), which correlates classes of the RMR with cohesion and friction angle of the rock masses, provided realistic values. However, the equation proposed by Barton (2002) for cohesion of the rock masses provided illogical results.
The equation for estimating the friction angle of discontinuities, proposed by Barton (2002), generated very high values in TLD-01 and TLD-02, see Table VII. In this study the Barton and Bandis
criterion proved to be more effective for TLD-02,
as demonstrated by stability analysis results. In case of planar discontinuities, tilt tests may be a better alternative for estimating the friction angle of the discontinuity, instead of Barton proposal.
CONCLUSIONS
Geomechanical classifications are widely used to
obtain the mechanical properties of the rock masses. However, the subjectivity in geomechanical
classification systems could lead to propagation
of errors. This propagation of errors influences
the variability of the results of classifications. In
addition, correlation equations for determining
mechanical properties of rock masses could produce unreliable results.
In general, the use of the equations which provided the cohesion of the rock mass and friction angle of the discontinuity, proposed by Barton (2002) and the equations which related the cohesion and friction angle with the criterion of Hoek and Brown have not produced compatible results, as demonstrated in this paper.
As demonstrated in this paper, stability analyses continue to be an interesting way to calibrate strength parameters of rock masses and discontinuities.
ACKNOWLEDGMENTS
The authors acknowledge the Federal University of Ouro Preto, Programa de Pós-Graduação em Engenharia Mineral (PPGEM) and Coordenação de Aperfeiçoamento de Pessoal de Nível Superior (CAPES) for the support of this study.
REFERENCES
ASTM - AMERICAN SOCIETY FOR TESTING AND MATERIALS. 2001. Standard test method for determination of rock hardness by rebound hammer method. ASTM Stand, 2001, 5 p.
AYDIN A AND BASU A. 2005. The Schmidt hammer in rock material characterization. Eng Geol 81(1): 1-14.
BARTON N. 1978. Suggested methods for the quantitative description of discontinuities in rock messes. Int J Rock Mech Min Sci 15(6): 319-368.
BARTON N. 2002. Some new Q value correlations to assist in
site characterization and tunnel design. Int J Rock Mech Min Sci 39(2): 185-216.
BARTON N AND BANDIS S. 1982. Effects of Block Size on the Shear Behavior of Jointed Rock. In: Proceedings of 23rd US Symposium of Rock Mechanics, Berkeley, California, p. 739-760.
BARTON N, LIEN R AND LUNDE J. 1974. Engineering classification of rock masses for the design of rock support. Rock Mechanics 6(4): 189-236.
BIENIAWSKI ZT. 1989. Engineering rock mass
classifications: a complete manual for engineers and geologists in mining, civil, and petroleum engineering.
New York: J Wiley & Sons, New York, USA, 271 p. GOODMAN RE AND BRAY JW. 1976. Toppling of
rock slopes. In: American Society of Civil Engineers. Proceedings of the specialty conference rock engineering for foundations and slopes, Boulder, Colorado, p. 201-234. GRIMSTAD E AND BARTON N. 1993. Updating the
Q-system for NMT. In: Norwegian Concrete Association.
Proceedingf of Int. Symp. on Sprayed Concrete, Fagernes, Oslo, 22 p.
HOEK E. 1994. Strength of rock and rock masses. ISRM News Journal 2(2): 4-16.
HOEK E AND BRAY J. 1981. Rock Slope Engineering. Inst. Mining and Metallurgy, London.
HOEK E, CARRANZA-TORRES E AND CORKUM B. 2002. Hoek-Brown failure criterion – 2002 edition. Rocscience Publishing. https://www.rocscience.com/documents/hoek/ references/H2002.pdf. Accessed 11 July 2015.
ISRM. 1981. Rock Characterization Testing and Monitoring. New York: Oxford, 211 p.
ISRM. 2007. The complete ISRM suggested methods for rock characterization, testing and monitoring: 1974-2006. R.
Ulusay & J.A. Hudson, Ankara.
PALMSTRÖM A. 1982. The volumetric joint count - a useful and simple measure of the degree of jointing. In:
Proceedings of IV Int. Congress IAEG, New Delhi, p. 221-228.
PALMSTRÖM A. 1995. RMi - a rock mass characterization system for rock engineering purposes. PhD Thesis, Oslo University, 400 p.
PALMSTRÖM A. 1996. Characterizing rock masses by the RMi for use in practical rock engineering, part 2: Some practical applications of the rock mass index (RMi). Tunnelling and Underground Space Technology 11(3): 287-303.
ROCSIENCE INC. 2006. Swedge Version 6.0 - 3D Surface
Wedge Analysis for Slopes. www.rocscience.com,
Toronto, Ontario, Canada.
ROCSIENCE INC. 2010. Slide Version 6.0 - 2D Limit Equilibrium Slope Stability Analysis. www.rocscience. com, Toronto, Ontario, Canada.
ROCSIENCE INC. 2014. RocTopple Version 1.0 - Toppling Analysis of Rock Slopes. www.rocscience.com, Toronto, Ontario, Canada.
SHALABI IF, CORDING EJ AND AL-HATTAMLEH OH. 2007. Estimation of rock engineering properties using hardness tests. Eng Geol 90(3): 138-147.