www.nat-hazards-earth-syst-sci.net/9/1763/2009/ © Author(s) 2009. This work is distributed under the Creative Commons Attribution 3.0 License.
and Earth
System Sciences
Methodology to evaluate rock slope stability under seismic
conditions at Sol`a de Santa Coloma, Andorra
O. Mavrouli1, J. Corominas1, and J. Wartman2
1Department of Geotechnical Engineering and Geosciences, UPC, Barcelona, Spain
2Department of Civil, Architectural, and Environmental Engineering, Drexel University, Philadelphia, USA
Received: 31 January 2009 – Revised: 18 September 2009 – Accepted: 21 September 2009 – Published: 5 November 2009
Abstract. An analytical methodology is presented to evalu-ate rock slope stability under seismic conditions by consider-ing the geomechanical and topographic properties of a slope. The objective is to locate potential rockfall source areas and evaluate their susceptibility in terms of probability of failure. For this purpose, the slope face of a study area is discretized into cells having homogenous aspect, slope angle, rock prop-erties and joint set orientations. A pseudostatic limit equilib-rium analysis is performed for each cell, whereby the desta-bilizing effect of an earthquake is represented by a horizontal force. The value of this force is calculated by linear interpo-lation between the peak horizontal ground acceleration PGA at the base and the top of the slope. The ground acceleration at the top of the slope is increased by 50% to account for to-pographic amplification. The uncertainty associated with the joint dip is taken into account using the Monte Carlo method. The proposed methodology was applied to a study site with moderate seismicity in Sol`a de Santa Coloma, located in the Principality of Andorra. The results of the analysis are con-sistent with the spatial distribution of historical rockfalls that have occurred since 1997. Moreover, the results indicate that for the studied area, 1) the most important factor controlling the rockfall susceptibility of the slope is water pressure in joints and 2) earthquake shaking with PGA of≤0.16 g will cause a significant increase in rockfall activity only if water levels in joints are greater than 50% of the joint height.
1 Introduction
Earthquake-induced rockfalls comprise a considerable frac-tion of landslides worldwide, posing a significant threat to humans, infrastructure and property. This has motivated their
Correspondence to:O. Mavrouli ([email protected])
investigation and has led to the development of methodolo-gies for the evaluation of the seismic susceptibility of rock slopes. The effects of earthquakes on rock slopes strongly depend on local conditions of the rock mass. Thus when evaluating the susceptibility of a slope to seismically induced rockfalls, it is necessary to consider specific geologic and topographic properties of the area as well as the respective seismic hazard.
Keefer (1993) developed an empirically based approach that has become one of the most widely used techniques for assessing seismic rockfall hazards. Keefer’s (1993) method-ology is based on geologic and topographic factors observed to be characteristic of large seismically induced rockfalls. The approach takes the form of a decision tree that relates local conditions of an area to seismically induced rockfall susceptibility. Critical factors associated with a high suscep-tibility to seismically induced rockfalls include (i) steep re-lief, (ii) intense weathering, (iii) poor induration and (iv) the presence of open and closely spaced fissures. More specifi-cally, steep relief refers to slopes inclined 25◦
or more. In-tense weathering, which is indicative of the destruction of the original rock-bonding material, is a factor promoting rock detachment from the slope face. Poor induration refers to the low strength of bonding of particles in fresh, unweathered rock (unconfined compressive strength lower than 700 kPa). The decrease of stability due to open fissures is attributed to the lack of lateral support of the partially contained detached sheets, columns and blocks. An average joint spacing of a few centimeters or less is also associated with highly suscep-tible slopes, as is joint containing water. Based on data from 40 worldwide earthquakes, Keefer (1984) found that the min-imum earthquake intensity required to trigger rockfalls corre-sponded toML≈4.0. This local magnitude is approximately
As Keefer’s approach is empirical and qualitative, the ob-jective of this paper is to present an alternative analytical methodology that can be used for quantitative assessment of earthquake-induced rockfall susceptibility. The method-ology was developed to evaluate rock slope stability un-der seismic conditions in Sol`a de Santa Coloma, located in the Principality of Andorra (see Sect. 4.1). Application of Keefer’s (1993) decision tree indicates that Sol`a de Santa Coloma has a low to moderate susceptibility (depending on the absence or presence of water in the joints, respectively) to earthquake induced rockfalls. Using the newly proposed methodology, the effects of earthquakes rockfall susceptibil-ity is considered in quantitative terms and the results from both the empirical and analytical approaches are compared.
The methodology proposed here considers local geologic properties, topography, and expected levels of ground shak-ing. The methodology is based on a limit-equilibrium model that accounts for joint kinematics in the region of study. The slope face is highly discretized, thus permitting the identifi-cation of potentially dislodgeable rock masses. Uncertainty in the joint properties is accounted for by means of a Monte Carlo simulation procedure, with model output presented as a probability of failurePf under a given level of ground
shak-ing. Complementary conventional deterministic analysis is also performed, using the average joint dip from the unfa-vorable joint sets, and yielding results expressed as a safety factor. Past studies (e.g. Keefer, 1984; Khazai and Sitar, 2003; Sep´ulveda et al., 2005) have attributed high rockfall intensities to topographic effects, a phenomenon whereby to-pographic features, such as slopes and basins, can locally modify earthquake ground shaking (e.g. Geli et al., 1988). Accordingly, the proposed methodology includes provisions to account for topographic effects using an established sim-plified procedure. The methodology has been implemented with a Geographical Information System (GIS) platform us-ing ArcMap v. 9.2 by ESRI, which allowed for graphical rep-resentation of the potential rockfall sources and their associ-ated susceptibility. The following sections of this paper dis-cuss the effects of earthquakes on rock slopes and provide complete details of the proposed methodology and its appli-cation in Sol`a de Santa Coloma.
2 Earthquake effects on rock slopes
Earthquakes affect rock slopes in two distinct ways, each associated with different time scales. The most obvious of these is the immediate co-seismic detachment of rock from a slope face or the remobilization of previously detached rock masses. A second effect, which occurs over the longer time frames (months to years), involves the earthquake-induced opening of fissures and rock fracturing that may result in rock dislodgements in the future. The analytical method presented in this paper pertains only to the first of these two effects, the co-seismic detachment of rock masses.
The size and the geometry of potential failure masses in rock slopes are controlled by intersecting joint sets. Rock-falls can only occur when the rock mass formed by the in-tersecting joint planes is kinematically capable of detach-ment, regardless of the shaking forces acting to the mass. This criterion serves as the basis of the Markland (1972) test of potential instability. During an earthquake, kinematically permissible failure masses will dislodge when the shear re-sistance of the controlling joint surface(s) is exceeded due to shaking-induced inertial forces. Seismic loading is cyclic and transient and therefore its magnitude and direction are continuously changing with the earthquake. As a result, earthquake-induced inertial forces will alternate from stabi-lizing to destabistabi-lizing with respective cycles of motion dur-ing an earthquake. Moreover, these inertial forces may alter-natively increase and reduce normal stresses on joint planes, and thus the contribution of friction to the shear strength along the plane (Hack et al., 2007).
As noted, topography can locally modify earthquake ground shaking in slopes. Additionally, site effects, the one-dimensional amplification of earthquake ground motion, can also affect the dynamic response of soil and soft rock slopes in earthquakes (Ashford et al., 1997). Site amplification has been found to be less significant than the topographic effects for steep, well indurated rock (Sepuldeva et al., 2005). While topographic effects have shown to dramatically increase the amplitude of ground shaking near the crests of steep slopes (Bouchon and Barker, 1996), this same phenomenon can also result in de-amplification of ground motion at the toe of a slope (Boore, 1972). The main factors affecting this phe-nomenon are the slope inclination and the vertical distance from the crest of the slope (Geli et al., 1988). Additionally, the earthquake frequency content (Ashford and Sitar, 2002) and the approach direction of seismic waves are also impor-tant factors affecting topographic amplification (Anoosheh-poor and Brune, 1989).
3 Methodology for the evaluation of earthquake-induced rockfalls
The proposed analytical methodology was developed to in-dentify the location of potential earthquake-triggered rock slope instabilities and assign stability class categorizations in terms of probability of failurePf over local to
medium-range scale study areas (i.e. up to several km2). Failure is defined as the detachment of a rock mass from the slope face under given conditions.
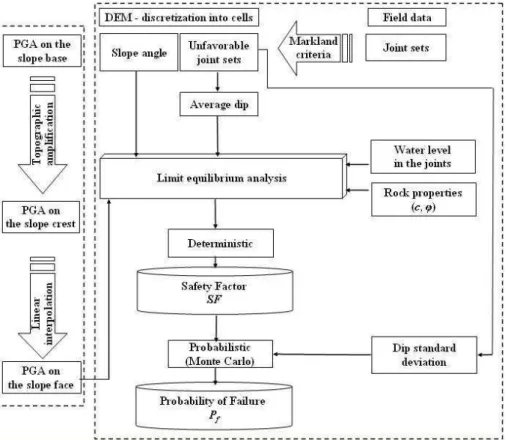
The proposed methodology involves the following steps (Fig. 1):
Fig. 1.Methodology for the evaluation of earthquake-induced rockfalls.
2. Calculation of the maximum slope angle and the aver-age aspect for each cell using the program ArcMap by ESRI.
3. Estimation of joint properties: average dip angle (ψp),
cohesion (c) and friction angle (φ) and evaluation of the unfavorable joint sets in each cell using the Mark-land (1972) criteria.
4. Estimation of local shaking intensity in terms of hori-zontal peak ground acceleration PGA.
5. Calculation of safety factor SF taking into account the cleft water pressures, joint properties and PGA on the slope face.
6. Evaluation of the probability of failurePf by
addition-ally incorporating the variability of the joint dip angle and using a Monte Carlo simulation.
The input data include the digital elevation model (DEM) of the area, as well as field data on the joint sets and the joint surface properties. The resolution of the DEM deter-mines the detailed representation of the local relief and thus the accuracy of the calculated slope angle and aspect. The use of a 5 m DEM at minimum scale of 1:5000 obtained by photogrammetry or laser scanner is recommended for the ap-plication of the methodology.
3.1 Unfavorable joint sets and properties
Field reconnaissance is required to obtain data on the princi-pal joint sets. Given the slope aspect, it is possible to identify unfavorable joints for each cell using the Markland (1972) criteria. These criteria define unfavorable joint sets based on three conditions (Hoek and Bray, 1981): (i) potential joint planes must intersect the slope face, (ii) potential joint planes must have a dip angle greater than the friction angle, and (iii) joint sets must have a maximum difference of 20◦
between their dip direction and the slope aspect.
Given the uncertainty in estimating the joint dip angle that could cause slope failure, an average dip value for each one of the unfavorable joint sets may be considered along with its standard deviation. Additionally, a more detailed statis-tical analysis of the joint data may be performed using joint densities obtained by a stereonet (Gokceoglu et al., 2000). Strength properties of the joint sets (candφ) were estimated based on typical values for similar rock types included in an experimental database compiled by Barton (1974) and Hoek and Bray (1981).
3.2 Local shaking intensity
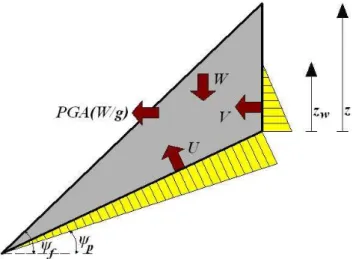
Fig. 2.Calculation of the PGA on the slope face PGAsf.
by a constant outward horizontal force applied through the centroid of each potential failure mass. Vertical shaking is often only a fraction of that in the horizontal direction, and has therefore been assumed to be neglected in the analysis. The pseudostatic forceFhorizwas computed as:
Fhoriz=PGA·(W/g), (1)
where:
PGA = peak horizontal ground acceleration acting on the potential failure mass,
W= the weight of the potential failure mass,
g= acceleration due to gravity.
The PGA along the rock slope is the intensity of base shak-ing PGAbmodified by site and topographic effects (Fig. 2).
The intensity of base shaking is a function of the defined seis-mic hazard level (e.g. return period) and may be estimated based on a site-specific seismic hazard analysis or from local seismic codes. A site response analysis may then be used to relate the PGAb to the free field ground motion behind the
crest PGA. This analysis may be based on simplified code standards, such as those in the International Building Code or Eurocode 8 (ENV 1998-5:1994), or alternatively, using a site-specific one-dimensional ground response analysis. The effects of topography are accounted for based on a simpli-fied procedure developed by Ashford and Sitar (2002). The procedure suggests that the ground motion of the free field behind the crest PGAff be increased by 50%. The PGA on
the slope face at the location of the cells PGAsf is obtained
by linear interpolation between the base and the crest as pre-scribed by Eurocode 8.
3.3 Safety factor
The stability of each cell can be investigated analytically for the input data using a conventional limit equilibrium formu-lation for planar and wedge failures as described by Hoek and Bray (1981) and Hoek (2007). In this paper, only plane failure is considered. The analysis is conducted using a fixed
Fig. 3. Limit equilibrium model for the stability analysis
(W= weight, c= cohesion, A= basal area of the block, U and
V= uplift water forces, ψp= dip angle of the joint, ψf= slope
angle, γw= unit weight of water, z= depth of the tension crack,
zw= depth of the water in the tension crack, φ= friction angle,
PGA = peak ground acceleration on the slope andg= acceleration
due to gravity.
average value of the joint dips that represents the potential sliding planes. The safety factor SF is calculated by Eqs. (2)– (7) for the two-dimensional rock mass shown in Fig. 3. SF=c·A+
W· cosψp−PGA/g·sinψp
−U−V·sinψp
·tanφ W· sinψp+PGA/g·cosψp+V·cosψp
, (2)
where
A=H−z
sinψp
, (3)
W=γr·H
2
2
1− z
H
2
·cotψp· cotψp·tanψf−1
, (4)
z=H· 1−cotψf·tanψp, (5)
U=γw·zw·A
2 , (6)
V=γw·z
2
w
2 , (7)
W= weight, c= cohesion, A= basal area of the block, U
and V = uplift water forces, ψp= dip angle of the joint,
ψf = slope angle,γw= unit weight of water,z= depth of the
tension crack, zw= depth of the water in the tension crack,
φ= friction angle, PGA = peak ground acceleration on the slope andg= acceleration due to gravity.
3.4 Probability of failure
result in variation of the maximum slope angle for each cell. There are also uncertainties for the geomechanical properties of the joint sets (ψp,candφ). Additionally, water pressure
in the joints is another variable factor as is the PGAsfapplied
to potential rockfalls masses on the slope face.
To address the uncertainties introduced into the analysis, a probabilistic analysis is proposed using Monte Carlo sim-ulation technique. For simplicity, in this work explicit treat-ment of uncertainty will be limited toψp when considering
that the potential for block detachment is based on kinemat-ics of the joint sets. However, the Monte Carlo simulation technique presented here can be extended to include uncer-tainties in other factors such as topography, seismic ground motion, water pressures, and shear strength of the joints. A normal distribution of the joint dip is assumed of each cell, with average value and standard deviation resulting from the dip of all unfavorable joints for the cell. The probability of failure may then be calculated as:
Pf=P[SF<1]. (8)
4 Application of analytical method at Sol`a de Santa Coloma, Andorra
4.1 The study area characteristics
The study area is a slope situated next to the urban area of Santa Coloma, in the Principality of Andorra, located in the East-Central Pyrenees. The area was selected for this study because it experiences a relatively high rate of rockfall ac-tivity and because a number of other studies have been per-formed in the slope in recent years (Copons, 2004; Copons et al., 2005; Corominas et al., 2005), thus allowing the anal-ysis results to be checked against previous studies for consis-tency. Two sites are investigated within the studies area, the Borrassica and the Forat Negre (Fig. 5a, b, and c).
The retreat of the Pleistocene glaciers about 20 000 years ago has resulted in a typical U-shape valley profile in the area. The subsequent occurrence of morphogenetic pro-cesses such as decompression and freeze-thaw for both sites has resulted in intense rockfall activity under non-seismic conditions. This is particularly apparent for the Forat Ne-gre (Fig. 5c). Lithology at the site consists mainly of gran-iodiorite. The values of c=0.20 MPa andφ=35◦
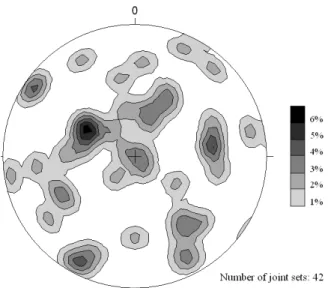
were se-lected as conservative estimates of joint strength in this ma-terial based on data presented by Barton (1974) and Hoek and Bray (1981). While the rock mass is relatively impervi-ous, joints close to the topographical surface may open pro-gressively due to stress release thus allowing the rainfall to infiltrate with a consequent increase in the cleft water pres-sures. Figure 4 summarizes the principal joint sets that were observed and measured by Comella (2003).
The seismicity of the area is related to its tectonic setting. The Pyrenean range results from the collision of the Eurasian and Iberian plates (Souriau and Pauchet, 1997). The eastern
Fig. 4. Schmidt stereogram of the principal joint sets at the study area (after Comella, 2003).
end of the range has been locally affected by Mediterranean tectonics, which features an Oligocene-Miocene northwest-southeast extension resulted in the Corsica-Sardinia drift and the opening of the Gulf of Lion. The principal fault systems in the area are the northwest-southeast trending Bigorre fault in the Central Pyrenees, and the northeast-southwest trending Tet and Tech faults in the Eastern Pyrenees, which control the Neogene to Quaternary deformation in this part of the range. The study area is located in a region of moderate seismic-ity. Historical records indicate that in 1373 a relatively large earthquake occurred in nearby Ribagorc¸a (Central Pyrenees), resulting in estimated Modified Mercalli intensities of VIII to IX in the region (Olivera et al., 1994). More recently, a series of seismic events occurring in 1973 caused Modi-fied Mercalli levels V to VI shaking intensities in the region (Susagna and Goula, 1999). All these seismic events were felt at the study areas of Borrassica and Forat Negre. For this study we adopted the results of a comprehensive prob-abilistic seismic hazard assessment (PSHA) of the Pyrenean region (including Andorra) by Secanell et al. (2008) to de-fine the local shaking intensities corresponding to an earth-quake having a return period of 475 years. This return period, which is equivalent to an event having 10% probability of be-ing exceeded in 50 years, was selected to be commensurate with design seismic risk levels specified in most contempo-rary building codes. Seismic hazard maps developed by Se-canell et al. (2008) as part of their PSHA indicate a bedrock median PGAbof 0.12 g for all of Andorra and consequently
for the study area.
(a)
(b)
(c)
Fig. 5.The Principality of Andorra(a), Sol`a de Santa Coloma(b)
and location of the Borrassica and Forat Negre sites within the Sol`a de Santa Coloma study area(c).
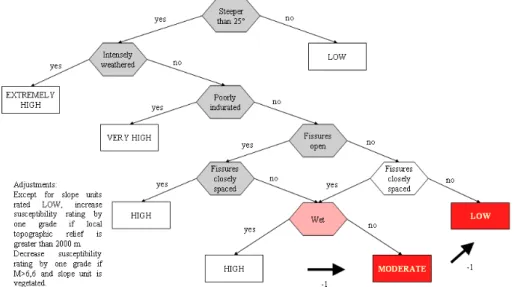
failure. However, for Andorra, and accordingly for Sol`a de Santa Coloma the assigned seismic intensity is VII according to the map of seismic zones of Catalonia for a return period of 500 years (Goula et al., 1997). Additionally, vegetation is also present. Therefore, according to Keefer’s approach, rockfall susceptibility is decreased by one grade and is low to
moderate. A review of the historical archives suggested that no significant rock failures occurred during the two strongest earthquakes over the last hundred years, the Boi earthquake of 1919 which resulted in local MMI shaking of V–VI, and the Viella earthquake of 1924 (Susagna and Goula, 1999). These historic observations corroborate with the susceptibil-ity criteria based on the Keefer (1993) procedure.
4.2 Application of the procedure and results
A 5 m contour DEM at a 1:5000 scale obtained by pho-togrammetry was used in this study. Field observations as well as terrain profiles of the DEM indicated an elevation of 1075 m at the slope base and 1325 m at the crest of the slope for both of the sites. The two study areas were dis-cretized into homogeneous cells with a 25 m elevation dif-ference between the lowest and the highest contour lines of each cell. A total of 97 cells have been defined as shown in Fig. 6. For each cell, the maximum slope angle and the aver-age aspect were calculated using ArcMap. The slope angles as well as the discretization of the cells are presented on the topographic map in Fig. 7. The maximum slope angle in the study area was 86◦
. It can be seen that the majority of the cells have slope angles greater than 70◦
and the investigated area fulfills the prerequisite of being steeper than 25◦
for the earthquake hazard evaluation on steep rocky slopes (Keefer, 1993).
Intact rock such as that at the study site often has shear wave velocities in the range of 800 m/s, the threshold beyond which site amplification is assumed to be negligible based on Eurocode 8. Accordingly, PGAff value was set equal to
the PGAb of 0.12 g. This acceleration was then increased
by 50% to obtain the PGAcr value of 0.18 g. The PGAsf
value of 0.16 g was computed by linear interpolation (aver-age altitude: 1075 m) between the PGA at the toe and crest of the slope. To test this simplified approach for accounting for topographic amplification, a series of two-dimensional dy-namic response analyses where performed using the finite-difference code FLAC (Itasca, 2005). Intact rock generally exhibits linear behavior over the range of strains typically en-countered during an earthquake (Schnabel et al., 1972) and therefore modeled as an elastic material with material prop-erties typical of those for intact igneous rocks (shear wave velocity=3000 m/s). The numerical model was subjected to seven recorded ground motions from events in California, USA and Italy, scaled to a PGA=0.12 g. While the full de-tails of finite difference analyses are beyond the scope of this paper, it is noted that the PGAsf values from the detailed
nu-merical simulation averaged 0.08 g, suggesting that the sim-plified procedure provides a conservative estimate of accel-eration along the slope face.
Fig. 6. Decision tree for susceptibility of rocky slopes to earthquake-induced failure (Keefer, 1984), and application to the Sol`a de Santa Coloma (grey: existing conditions on the study area, pink: occasionally existing condition, red: susceptibility level). The susceptibility grade is reduced by one grade (−1) forM>6.6 and vegetation presence.
Fig. 7. Distribution of the slope angle of cells in the study area (contour interval: 5 m).
Unfavorable joints for each cell were first determined us-ing the Markland (1972) criteria. The average joint dip and associated standard deviation were then calculated for the un-favorable joints of each cell. In order to assess the relative significance of seismicity on the rockfall hazard, paramet-ric analyses were performed for both non-seismic and seis-mic conditions, as well as for differing water pressures in the joints corresponding to joint water level of 0% (no wa-ter), 20%, 30%, 40%, 60% and 70%. For these combinations of parameters, corresponding values of the safety factor SF were obtained based on a conventional deterministic analy-sis. Following this analysis, the probability of failurePf was
then calculated considering the additional parameter of joint
Fig. 9.Probability of failurePf versus safety factor SF.
Table 1.Correlation of SF withPf by non linear regression
analysis.
Safety factor Probability of failure
SF Pf
0.90 0.54
1.00 0.50
1.10 0.44
1.30 0.36
inclination standard deviation (calculated for each cell as de-scribed earlier) with the aid of the Monte Carlo simulation software @Risk 5.0 (Palisade, 2007).
Figure 9 presents the computedPf as a function of SF for
the full range of the parametric analyses. The plot was used to aid the interpretation of the analyses results, and to define four general stability classes. The cells of class 1 are those having a minimum SF of a 1.3 and are considered very sta-ble. The value of SF=1.3 was selected based on its wide ac-ceptance in geotechnical engineering slope stability practice as a threshold defining adequate stability (e.g., Wyllie and Mah., 2004; Lorig and Varona, 2000; Singh et al., 2005). The cells of class 2 have a SF less than 1.3 and greater than 1.1 and are also stable. Class 3 describes the susceptibility level for those cells that have SF close to 1 (i.e., 0.90≤SF≤1.10), that given the inherent uncertainties of the detachment phe-nomenon, are considered to be at incipient failure. The final category, class 4, comprises the cells with a SF lower than 0.90, which are considered unstable. In this evaluation, the cells of classes 3 and 4 are considered source zones for po-tential rockfalls.
A non-linear regression analysis was performed to deter-mine thePf that corresponds to the defined SF thresholds.
Results from this analysis are as shown in Table 1.
According to the results presented in Fig. 9, SF=1 corre-sponds to a condition where there is a 50% chance of having a detachment of the rock mass. The same reference point has also been used by Vick (1994) as cited by Silva et al. (2008),
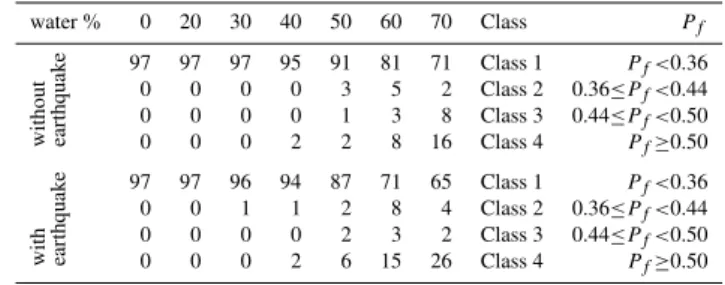
Table 2. Number of cells for each class and modeling conditions. Total number of cells in the study area is 97.
water % 0 20 30 40 50 60 70 Class Pf
without earthquak
e 97 97 97 95 91 81 71 Class 1 P
f<0.36
0 0 0 0 3 5 2 Class 2 0.36≤Pf<0.44
0 0 0 0 1 3 8 Class 3 0.44≤Pf<0.50
0 0 0 2 2 8 16 Class 4 Pf≥0.50
with earthquak
e 97 97 96 94 87 71 65 Class 1 P
f<0.36
0 0 1 1 2 8 4 Class 2 0.36≤Pf<0.44
0 0 0 0 2 3 2 Class 3 0.44≤Pf<0.50
0 0 0 2 6 15 26 Class 4 Pf≥0.50
based on the fact that normally distributed uncertainty for SF=1 givesPf=0.5. This is due to the fact that in addition
to the average dip value, discontinuities with dips inclined shallower than the average value are also considered in the Monte Carlo analysis. As a result, in many cases of SF>1, the probability of failurePf is considerable (i.e., SF=1.30
corresponding toPf=0.36).
Using these thresholds, the number of cells is further cal-culated for each class for various combinations of earthquake and water conditions (Table 2). It is noted that for conditions corresponding to no water and a water level of 20%, there are no instable rockfalls sources both with and without seis-mic effects. This implies that without significant water in the joints, an earthquake will not initiate a rockfall in the study area. For a water level 30% and no earthquake conditions, no rockfalls sources are indicated (susceptibility class 1), while for the same water lever (30%) and considering earthquake conditions, there is a single cell that has a susceptibility of class 2.
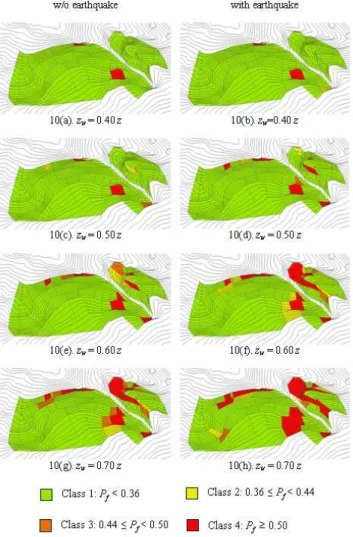
Figure 10 shows the potential for rockfalls with and with-out an earthquake using a color scale related to the range of
Pf values. The results are presented for joint water level
40% (the minimum level needed to trigger rockfalls), 50%, 60% and 70%. This implies that for the level of seismicity consider here and the assumed rock properties, an earthquake will not trigger significant rockfalls in the study area. Thus, the principal controlling factor appears to be the water pres-sure in the joints. For joint water levels greater than 50% a significant increase in rockfalls may be expected. Under these water level conditions, an earthquake will be expected to increase the number of potential source zones (e.g., for
zw=50%z, the number of rockfall sources increases from 3
Fig. 10.Rockfall source areas and their probability of failurePf.
4.3 Comparison of the results with historical rockfall data
The results of the methodology were evaluated in relation with their spatial accuracy using recently documented rock-fall events and comparing the location of these to the Pf
computed using the proposed methodology for the specific site locations. Given the scale of the map, the accuracy of the rockfall location is limited; nevertheless, it provides use-ful information on rockfall sources. Some of the historical rockfall events occurred after rainfalls, however the infor-mation on the infiltration due to these rainfalls is not suffi-cient. The most unfavorable water conditions (zw=70%z)
and non-seismic conditions are assumed. The location of the historical rockfall events with respect to the location of the cells in the investigated area is shown in Fig. 11. Historical data information was collected by Copons (2004), Copons et al. (2005) and Corominas et al. (2005). Because of the scale of the map (1:5000) the precision in positioning the rockfall points on it is limited. Due to this, it is not possible to further
Fig. 11. Historical rockfall events overlaid on the rockfall source map of the study area (from Fig. 10, column 1, row 4).
reduce the size of the rockfall points (dots) and to provide more accurate information. Moreover given that the sources are inaccessible, their positioning using GPS was not possi-ble. The points presented in Fig. 11 were determined follow-ing three steps:
i The rockfall source was localized on a photograph of the rock slope, taken vertically to the slope.
ii The source was positioned on an orthophoto image by the help of the photograph of step i.
iii The orthophoto image was overlaid with the topo-graphic map of the area using the program CADS that permits the localization of the source on the topographic map.
The sources were visible from a station vertical to the slope. So their position on the photos was an easy and di-rect step. The slope has many irregularities and small trees which are present on the photos as well as the orthophotos. There irregularities were used as reference points to position the sources on the orthophotos. The reference points have a distance of less than 10 m. As a result the positioning error on the topographic map is of the order of some meters.
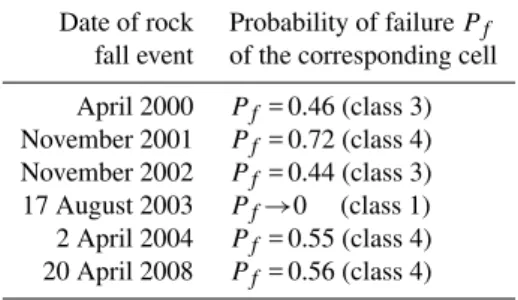
Table 3 summarizes thePf calculated using the proposed
methodology. It is noted that with one exception, all past rockfall events occurred in cells characterized as potential sources (i.e.,Pf≥0.4). The exception, the event of 17
Table 3. Probability of failurePf of cells with historical rockfall
events.
Date of rock Probability of failurePf
fall event of the corresponding cell
April 2000 Pf= 0.46 (class 3)
November 2001 Pf= 0.72 (class 4)
November 2002 Pf= 0.44 (class 3)
17 August 2003 Pf→0 (class 1)
2 April 2004 Pf= 0.55 (class 4)
20 April 2008 Pf= 0.56 (class 4)
5 Conclusions
A methodology was presented to evaluate rock slope stability under seismic conditions. It is a new procedure that accounts for geological, topographical and earthquake parameters and it provides quantitative results. Moreover, it is simple but still captures the most important factors and allows its application over large spatial scale within a GIS platform. A benefit of the proposed approach is that it provides information of the location of the source area and a quantification of the prob-ability that rockfalls will occur in the area given a level of seismic excitation and water pressure conditions.
The application of the procedure to Santa Coloma, in An-dorra, for both earthquake and non-seismic conditions, and a range of water levelzw in the joints (0, 20%, 30%, 40%,
60% and 70% of the vertical joint height) indicated that for low water level there are no unstable rockfall source areas, either with or without seismic acceleration, implying that for dry conditions, an earthquake of the adopted magnitude will not initiate a rockfall event in the study area. There-fore, the principal controlling factor appears to be water pres-sure in joints. For conditions corresponding to the height of the water in a vertical joint zw greater than 50%,
rock-falls are probable and it is only under these conditions that an earthquake will increase the number and the instability of potential sources. This amount of pore-water pressure is par-ticularly high for the study area and consequently the area can be generally characterized as having low susceptibility to earthquake-induced rockfalls. It is important to mention that this conclusion applies to the specific study area, which is of moderate seismicity. The effect of a high magnitude seismic event on the occurrence of rockfalls remains under investigation.
The comparison of the results of the methodology with re-cent rockfalls show good agreement, with the exception of a single event, which is located in a cell having a low prob-ability of failure. The failure of the methodology to predict this particular rockfall event is probably related to a localized steep zone in the cell area or presence of individual joints that may not share these properties (for instance, they might
be affected by processes leading to the decay of cohesion with time such as freeze-thaw processes, root wedging, etc.). These very local conditions are not adequately captured by the analysis.
Future investigation should include the realistic simulation of the variability of further factors (cohesionc, friction angle
φ, Peak Ground Acceleration PGA, water level in the joints
zw, etc.) so they may be included in the Monte Carlo
sim-ulation. Additional research should be made to check the sensitivity of the results using the proposed methodology to the precision of the DEM, the joint set measurements and the evaluation of the geomechanical properties. Also the inves-tigation of the distribution of the water level in the joints for various intensity rainfall events would improve the accuracy of the results. Finally, the application of the methodology to well documented similar case-studies of earthquake-induced rockfall events would also be useful for the evaluation of the method.
Acknowledgements. This work has been performed within the framework of the “Mountain Risks” Marie Curie Research Training Network, funded by the European Union (6th Framework Program) contract number MRTN-CT-2006-035798. Support for the third author was provided by the National Science Foundation under
grant CMS-0134370. The authors appreciate Patrick Strenk’s
assistance with the dynamic response analysis.
Edited by: K. Schellenberg Reviewed by: J. Coe and S. Miles
References
Anooshehpoor, A. and Brune, J. N.: Foam rubber modeling of topo-graphic and dam interaction effects at Pacoima dam, Geol. Soc. Am. Bull., 5, 1347–1360, 1989.
Ashford, S., Sitar, N., Lysmer, J., and Deng, N.: Topographic effects on the seismic response of steep slopes, Geol. Soc. Am. Bull., 87(3), 701–709, 1997.
Ashford, S. and Sitar, N.: Simplified method for evaluating seismic stability of steep slopes, J. Geotech. Geoenviron., 128(2), 119– 129, 2002.
Barton, N. R.: Review of the Shear Strength of Filled Discontinu-ities in Rock, Eng. Geol., Elsevier, 7, 287–322, 1974.
Boore, D. M.: A note on the effect of simple topography on seismic SH waves, Geol. Soc. Am. Bull., 62(1), 275–284, 1972. Bouchon, M. and Barker, J. S.: Seismic response of a hill: The
ex-ample of Tarzana, California, Seismol. Soc. Am. Bull., 86(1A), 66–72, 1996.
Comella, J.: Aplicaci´o de les classificacions geomec`aniques a l’avaluaci´o de la susceptibilitat dels massissos rocosos a pro-duir despreniments, Tesina, UPC Escola T`ecnica Superior d’Enginyers de Camins, Canals i Ports de Barcelona, Annex of results, 3–8, available at: http://upc.cbuc.cat/, 2003.
Copons, R., Vilaplana, J. M., Corominas, J., Altimir, J., and Amig´o, J.: Rockfall hazard management policy in urban areas: the An-dorran experience, in: Landslide Hazard and Risk, edited by: Glade, T., Anderson, M., and Crozier, M., John Wiley & Sons, Chichester, 675–698, 2005.
Corominas, J., Copons, R., Moya, J., Vilaplana, J. M., Altimir, J., and Amig´o, J.: Quantitative assessment of the residual risk in a rock fall protected area, Landslides, 2, 343–357, 2005.
ENV 1998-5:1994. Eurocode 8: Design of structures for earthquake resistance. Foundations, retaining structures and geotechnical as-pects, 16–19, 1998.
Geli, L., Bard, P. Y., and Jullien, B.: The effects of topography on earthquake ground motion: A review and new results, Geol. Soc. Am. Bull., 78(1), 42–63, 1988.
Gokceoglu, C. Sonmez, C. H., and Ercanoglu, M.: Discontinuity controlled probabilistic slope failure risk maps of the Altindag (settlement) region in Turkey, Eng. Geol., 55, 277–296, 2000. Goula, X., Susagna, T., Secanell, R., Fleta, J., and Roca, A.:
Seis-mic hazard assesment for Catalonia (Spain) Proceedings Second Congress on Regional Geological Cartography and Information Systems, Barcelona, 173–177, 1997.
Gruntal, G.: European Macroseismic scale 1998, Conseil de l, Eu-rope, Cahiers du Centre Europeen de Geodynamique et de Seis-mologie, edited by: Gruntal, G., Luxemburg, 15, 22–23, 1998. Hack, R., Alkema, D., Kruse, G., Leenders, N., and Lizu, L.:
In-fluence of earthquakes on the stability of slopes, Eng. Geol., 91, 4–15, 2007.
Hoek, E. T. and Bray, J. W.: Rock Slope Engineering, Institute of Mining and Metallurgy, 1981.
Hoek, E. T.: Practical Rock Engineering, available at: http://www. rocscience.com/hoek.2007, 2007.
Itasca Consulting Group: FLAC-Fast Lagrangian Analysis of Con-tinua, Version 5, User’s Manual, Itasca Consulting Group Inc., Minneapolis, USA, 2005.
Keefer, D. K.: Landslides caused by earthquakes, Geol. Soc. Am. Bull., 95, 406–421, 1984.
Keefer, D. K.: The susceptibility of rock slopes to earthquake-induced failure, Bulletin of the Association of Engineering Ge-ologists, 30, 353–361, 1993.
Khazai, B. and Sitar, N.: Evaluation of factors controlling
earthquake-induced landslides caused by Chi-Chi earthquake and comparison with the Northridge and Loma Prieta events, Eng. Geol., 8, 79–95, 2003.
Lorig, L. and Varona, P.: Practical Slope-Stability Analysis Us-ing Finite-Difference Codes. Slope Stability in Surface MinUs-ing, edited by: Hustrulid, W. A., McCarter, M. K., and Van Zyl, D. J. A., Littleton, SME, Colorado, USA, 12, 115–124, 2000. Markland, J. T.: A useful technique for estimating the stability of
rock slopes when the rigid wedge slide type of failure is ex-pected: Imperial College Rock Mechanics Research Reprints, 19, 10 pp., 1972.
Olivera, C., Riera, A., Lambert, J., Banda, E., and Alexandre, P.: Els terratr`emols de l’any 1373 al Pirineu: efectes a Espanya i Franc¸a [The earthquakes of 1373 in the Pyrenees: effects in Spain and France], edited by: Entitat Autonoma del Diari Oficial i de Pub-licacions, Catalunya, 220–221, 1994.
Palisade Corporation: @RISK for EXCEL, Version 5.0.0, 2007. Schnabel, P. B., Lysmer, J., and Seed, H. B.: SHAKE-A computer
program for equation response analysis of horizontally layered sites, University of California, Berkeley, USA, Rep. No. EERC, 72–12, 1972.
Secanell, R., Berti, D., Martin, C., Goula, X., Susagna, T., Tapia, M., Dominique, P., Carbon, D., and Fleta, J.: Probabilistic seis-mic hazard assessment of the Pyrenean region, J, Seismol,, 12, 323–341, 2008.
Sep´ulveda, S. A., Murphy, W., Jibson, R. W., and Petley, D. N.: Seismically induced rock slope failures resulting from topo-graphic amplification of strong ground motions: The case of Pa-coima Canyon, California, Eng. Geol., 80, 336–348, 2005. Silva, F., Lambe, W., and Marr, A.: Probability and Risk of Slope
Failure, J. Geotech. Geoenviron., 134(12), 1691–1699, 2008. Singh, V. K., Singh, J. K., and Kumar, A.: Geotechnical study for
optimizing the slope design of a deep open-pit mine, India, B. Eng. Geol. Environ., 64(3), 306 pp., 2005.
Souriau, A. and Pauchet, H.: A new synthesis of the Pyrenean seis-micity and its tectonic implications, Tectonophysics, 290, 221– 244, 1997.
Susagna, T. and Goula, X.: Catat`aleg de Sismicitat, Atlas S´ısmic de Catalunya, Institut Cartogr`afic de Catalunya, Vol. 1, 28 pp., 1999.
Vick, S. G.: “Geotechnical risk and reliability – From theory toprac-tice in dam safety”, Proc., Earth, Engineers, and Education – A. Symp. in Honor of Robert V. Whitman, MIT, Cambridge, MA, USA, 45–58, 1994.