UNIVERSIDADE DE LISBOA
FACULDADE DE CIÊNCIAS
DEPARTAMENTO DE ENGENHARIA GEOGRÁFICA, GEOFÍSICA E ENERGIA
Assessing climatic changes through environmental
magnetic analyses of three sedimentary columns of the
North Atlantic Ocean (between 29°N and 35°N)
Ana Isabel de Jesus Lopes
Dissertação
Mestrado em Ciências Geofísicas
Especialização em Geofísica Interna
Dissertação orientada pelo Prof. Doutor Pedro Manuel Fernandes Carvalho da Silva
e Prof. Doutor Carlos Alberto Leitão Pires
I would like to thank to my supervisor, Pedro Silva for the advices and reviews which greatly improved this work. Thanks for the guidance, incentive, enthusiasm and unending patience demonstrated.
To him I owe what I know about magnetism, not only by the teachings transmitted, but also for the opportunity to work in different fields, and for that I will be always grateful.
To professor Carlos Pires I thank for accepting co-supervise this thesis, for the spectral analyses and for the availability to clarify the questions that emerged. I also thank for his reviews which greatly improved this manuscript.
A special thank is devoted to Hana Grison for the hysteresis loops measurements of core C07 and for fruitful discussions.
To Teresa Drago, Vera Lopes and Conceição Freitas I thank for the help with grain size measurements and data analysis of core C07.
Carla Palma is acknowledged for allowing access to the radiocarbon ages of the three sedimentary columns, performed in the framework of her Ph.D. thesis.
An acknowledgment is also due to the Task Group for the Extension of the Continental Shelf (EMEPC), namely Pedro Madureira, Patrícia Conceição and Nuno Lourenço, who gratefully provided the samples for this work.
To my laboratory colleagues Susana Fernandes, Jorge Ponte and Marta Neres, I thank for the friendship, support and for the pleasant moments.
Finally, to my parents and my friends I thank for the affection, support, patience and for being always present when I need.
Abstract
This study is devoted to the evaluation of climatic changes over the past thousands of years recorded on sedimentary columns of the North Atlantic Ocean. For that were conducted detailed environmental magnetic analyses along three sedimentary columns (C02, C05 and C07) with 2.5 to 3.0 m of length. These analyses comprehended measurements of magnetic susceptibility, anhysteretic and isothermal remanent magnetizations and hysteresis loops. Low coercivity ferrimagnetic carriers, magnetite and/or maghemite, appear as the main magnetic carriers. Additionally and particularly in core C07, a significant contribution of high coercivity minerals is also retrieved at some sedimentary depths, must probably corresponding to an enrichment of hematite and/or goethite. Along the cores C02 and C07, coherent transitions between stable and rather variable intervals of magnetic susceptibility and grain size are well defined, revealing different environmental conditions.
Spectral analyses of magnetic parameters sensitive to the concentration and granulometry of main ferromagnetic carriers identified periodicities that are closely related to the Milankovitch orbital cycles when assumed sedimentation rates of 1 cm/kyr and 1.6 cm/kyr, for cores C02 (mostly) and C07, respectively. According to these sedimentation rates there is no close link between the variable/stable values of χ and grain size and the glacial/interglacial periods.
In both cores maxima of magnetic susceptibility and coarser magnetic carriers suggest the presence of ice-rafted debris (IRD) transported by icebergs during the Heinrich events, however complementary studies are necessary to confirm it. For the remaining core C05, low and quite stable values of magnetic susceptibility as well the absence the well defined intervals and 14C ages indicate that the core correspond to landslide.
Key-words:
Environmental magnetism; Atlantic Ocean Seamounts; climate changes; Glacial-Interglacial Periods; ice-rafted debris (IRD)
Resumo
Ao longo dos últimos milhões de anos, o clima tem oscilado entre períodos glaciares e interglaciares impulsionado por variações orbitais da Terra e modulado por mecanismos de feedback.
Dados paleoclimáticos sugerem que os períodos interglaciares começaram e acabaram de forma súbita, ao passo que os períodos glaciares terão resultado de uma série de eventos de arrefecimento menores, que culminaram nos períodos glaciares.
Apesar da escassez de informações para períodos anteriores a 300 mil anos, sabe-se que, ao contrário dos períodos interglaciares, que são caracterizados por condições climáticas relativamente estáveis, os períodos glaciares são marcados por mudanças climáticas abruptas.
O último período interglaciar, também chamado Eemiano, ter-se-á estendido desde aproximadamente há 130-140 mil até acerca de 110 mil anos. Durante este período, o clima da Terra assemelhar-se-ia em muito ao atual, sendo no entanto ligeiramente mais quente. No final deste ciclo, originou-se um período glacial que se estendeu até aproximadamente há 10 mil anos. Este último período glaciar foi marcado acentuadamente por flutuações rápidas e de curta duração, em que o clima variou entre períodos extremamente frios e outros mais quentes, conhecidos como eventos de Dansgaard-Oeschger.
Associados a estes, ocorreram também os eventos de Heinrich, que corresponderam a enormes descargas de icebergs no oceano Atlântico provenientes dos glaciares que cobriam a América do Norte (Laurentide Ice Sheet-LIS) e o Norte da Europa (Fennoscandinavian Ice Sheet). A ocorrência dos eventos de Heinrich encontra-se vastamente descrita na literatura, tendo sido atribuída a ocorrência destes eventos a cada 7-13 mil anos.
Estes fenómenos extremos tiveram importantes consequências no clima, um pouco por todo o mundo e alteraram profundamente a circulação oceânica global, havendo estudos que mostram a interrupção da formação da Água Profunda do Atlântico Norte (NADW) e da corrente termohalina.
Atualmente ainda não existe consenso sobre o que terá originado os eventos de Heinrich, mas o modelo mais aceite estabelece que durante o último período glaciar as camadas de gelo teriam crescido promovidas pelas baixas temperaturas, estando então assentes em solos congelados. No entanto, a partir de uma certa espessura de gelo ter-se-ia começado a gerar calor na base do glaciar, o qual teria contribuído para sua destabilização, resultando assim nos eventos de Heinrich.
As camadas de sedimentos depositadas no fundo oceânico durante estes fenómenos, chamadas de “Heinrich layers”, foram inicialmente identificadas em sedimentos marinhos entre as latitudes de 45º e 50ºN, mas desde então têm sido encontradas um pouco por todo o Atlântico Norte até à latitude de 37ºN, e distribuídas em longitude desde a América do Norte até à Península Ibérica.
As “Heinrich layers” são identificáveis pela sua abundância em ice-rafted debris (IRD) e carbonatos detríticos, mínimos de abundância de foraminíferos e picos de Neogloboquadrina pachyderma (sinistral). O estudo das suas propriedades magnéticas revelou aumentos da susceptibilidade magnética, denotando assim aumentos da concentração de minerais ferromagnéticos, bem como da sua granulometria. A mineralogia é essencialmente composta por (titano)magnetites, que se crê terem sido originadas em rochas vulcânicas presentes na zona de captação de sedimentos da LIS.
O estudo de propriedades magnéticas de sedimentos tem-se revelado extremamente muito útil não só na identificação das “Heinrich layers”, mas principalmente aplicado ao estudo de mudanças ambientais, embora se trate ainda de uma área relativamente recente. O princípio básico da utilização dos métodos magnéticos aplicado ao estudo das mudanças ambientais (tais como o clima), baseia-se no facto destas influenciarem o tipo e modo de transporte e deposição dos sedimentos, bem como reações diagenéticas. Desta forma, a partir de medições de susceptibilidade magnética, magnetizações anhisterética e isotérmica e dos parâmetros obtidos a partir das curvas de hysteresis é possível aceder a informações como a concentração, granulometria e tipo de portadores magnéticos presentes nos sedimentos e, desta forma inferir variações ambientais.
Assim, e de forma a avaliar as mudanças climáticas ocorridas no Oceano Atlântico ao longo dos últimos milhares de anos, detalhadas análises magnéticas foram conduzidas em três colunas
sedimentares (C02, C05 e C07) localizadas maioritariamente em montanhas submarinas entre as latitudes de 29ºN e 35ºN.
Estas análises compreenderam medições de susceptibilidade magnética, magnetização remanescente anhisterética e isotérmica e curvas de histereses.
Os principais portadores magnéticos correspondem a minerais ferrimagnéticos de baixa coercividade, como magnetite e/ou maghemite. Além disso, e particularmente no core C07, uma contribuição significativa de minerais de alta coercividade são também encontrados a certas profundidades, devendo-se provavelmente a um enriquecimento em hematite e/ou goethite.
A sedimentologia do core C07 mostra que este é muito heterogéneo, sendo constituído por argilas, siltes e areias. O conteúdo de argila e de areia encontra-se em oposição de fase e variam entre 6-38% e 8-66%, respectivamente. O conteúdo de areia acompanha o comportamento da granulometria média dos sedimentos.
Análises espectrais de parâmetros magnéticos sensíveis à concentração e granulometria dos minerais ferromagnéticos mostram periodicidades estritamente ligadas aos ciclos orbitais de Milankovitch, quando se assumem taxas de sedimentação de 1 cm/kyr e 1.6 cm/kyr, para os cores C02 e C07, respectivamente.
Em ambos os cores, valores máximos de susceptibilidade magnética e portadores magnéticos grosseiros sugerem a presença de ice-rafted debris (IRD) transportados pelos icebergs durante os eventos de Heinrich, porém mais estudos como estratigrafia isotópica e composição isotópica de Ca/Sr e Sr-Nd sejam necessários para o confirmar.
O outro core, C05 apresenta valores de susceptibilidade muito baixos e bastante estáveis bem como a ausência de intervalos bem definidos e idades de 14C indicam que o core deverá corresponder a um deslizamento de terras.
Palavras-chave:
Magnetismo ambiental; Montanhas submarinas do Atlântico Norte; alterações climáticas; Períodos Glaciares-Interglaciares; ice-rafted debris(IRD)
Contents
1. Introduction ...1
2. Theoretical background ...2
2.1 Marine sediments ...2
2.2 Variations in Earth’s Orbit ...3
2.3 Methods to characterize magnetic phases ...5
3. Methods and Sampling ...9
4. Results ... 11
4.1 Environmental magnetism analyses ... 11
4.2 Sedimentology of core C07... 19
4.3 Spectral analyses ... 20
5. Discussion ... 22
6. Conclusions ... 25
Assessing climatic changes through environmental magnetic analyses of three sedimentary columns of the North Atlantic Ocean (between 29ºN and 35ºN)
1. Introduction
Over the past million years, climate has changed between glacial and interglacial states driven by the Earth's orbital variations and modulated by feedback mechanisms. Superimposed on this glacial-interglacial trend abrupt climate changes at a millennial time-scale occurred in the last glacial cycle: Dansgaard-Oeschger (D-O) warming and cooling events (Dansgaard et al., 1992) and Heinrich events (HE) (Heinrich, 1988; Bond et al., 1992). Although rapid climate changes were identified during interglacials, they were less prominent than during glacial periods. However, only sporadic information is available for the instabilities punctuating the interglacial climate optima of the last 300 kyr, prior to the quite well documented present interglacial, the Holocene.
Despite the large number of studies conducted in order to understand the climate evolution and its causes, particularly during the last glacial period, our knowledge of what may have happened and how is still poor.
One particular case is the Heinrich events that happened during the coldest periods of the Dansgaard-Oeschger events, in six short phases approximately between 13 kyr and 70 kyr ago.
These events corresponded to large icebergs discharges into the northern Atlantic Ocean from the Laurentide and northern European ice sheets (Bond et al., 1992; Broecker et al., 1992). They caused severe changes in surface and deep-water currents (e.g. Bond et al., 1993; Cortijo et al., 1997; Kissel et al., 1998; Chapman et al., 2000) and in the worldwide climate (e.g. Grimm et al., 1993; Arz et al, 1998; Leuschner et al., 2000; Naughton et al., 2009). These extreme discharges episodes have been firstly documented in the Ruddiman belt from several North Atlantic deep-sea cores between 45º and 50° N (Ruddiman et al., 1977; Heinrich, 1988; Bond and Lotti, 1995). They were identified in marine sediments because they left peculiar layers rich in ice-rafted debris (IRD) and detrital carbonate concentration (Bond et al., 1992; Broecker et al., 1992; Grousset et al., 1993; Elliot et al., 1998) as well by minima in foraminifera abundance and synchronous peaks of N. pachyderma (s.) (Broecker et al., 1992; Bond et al., 1993; Bond and Lotti, 1995; Chapman et al., 2000). Moreover, these layers show a fairly enrichment of highly magnetic minerals of coarser granulometry (e.g. Robinson et al., 1995; Stoner et al., 1996, 2000). These coarse fraction intervals, representing the well known Heinrich layers, were also detected out of the Ruddiman belt i.e. north of 50°N (e.g. Elliot et al., 1998; Voelker et al., 1998) as well as below 40°N (e.g. Lebreiro et al.,1996; Naughton et al., 2009). However and up to now there are no clear evidences of these layers presence below 37°N (Baas et al., 1997; Abrantes et al., 1998) for the last glacial and preview climatic cycles.
The aim of this work is to access the climatic changes occurred in the North Atlantic Ocean between the latitudes of 29ºN and 35ºN over the last thousands of years.
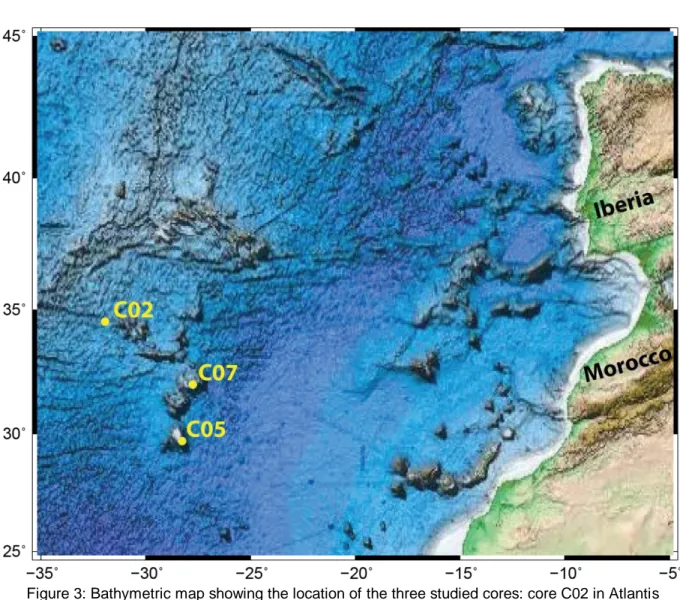
For this, we have conducted a detailed study of magnetic properties of three deep sea cores from Atlantis Seamount (C02: 34.5462ºN, 31.9310ºW), Great Meteor Tablemount (C05: 29.7034ºN, 28.2642ºW) and Cruiser Tablemount (C07: 32,024ºN; 27,746ºW) (Fig.3). Such analyses were complemented by spectral analyses using the multi-taper method (MTM) (Thomson, 1982; Percival and Walden, 1993), in order to coarsely access the temporal window.
Assessing climatic changes through environmental magnetic analyses of three sedimentary columns of the North Atlantic Ocean (between 29ºN and 35ºN)
2. Theoretical background
2.1 Marine sediments
Marine sediments are the main natural archive of information regarding past climate changes and oceanographic conditions, since they can provide a continuous depositional sequence encompassing large time intervals (e.g. Kissel et al., 1998; 1999; Cayre et al., 1999; MacManus et al., 1999; Elliot et al., 2002; Moreno et al., 2004; Rousse et al., 2006; Voelker et al., 2006; Jullien et al., 2007; Naughton et al., 2007; 2009).
Marine sedimentary deposits can be neritic or pelagic. Neritic sediments are deposited on shallow waters, mostly on continental shelves. These sediments are typically dominated by lithogenous deposits and are high-rate sedimentation sediments. Pelagic sediments, on the other hand, are low-rate sedimentation sediments deposited in deep ocean basins. According to the source they are classified as terrigenous, biogenic, authigenic, volcanogenic and cosmogenic.
Terrigenous sediments are originated on land from weathering of rocks and delivered to the oceans by rivers, wind and ice. The supply by rivers is typically limited to areas close to the land. Depending on the stratification of the water masses and the density of the material in suspension, some sediment may float for a short period of time on top of seawater or at mid-depth and reach the deep ocean basins, but the amount of sediment in these conditions is very low. Sediments transported by wind are aeolian dust, typically transported from deserts and continental interiors. Part of sediments transported by ice into marine environments is deposited within the limits of continental shelves when the ice melts, with sizes that range from boulders to clays. The remaining part is transported further away from the continent margins by icebergs. When the icebergs melt, the ice-rafted debris (IRD), i.e. the sediments accumulated in the base of the iceberg sink and accumulate on the seafloor. These sediments have a size distribution from coarse sands to clays. Biogenic sediments are formed by the skeletons of small marine organisms that live primarily in the water column and represent the main source of sediments in deep environments. As the living organisms die, they sink in the water column and are deposited on the seafloor. According to the composition of the shells, sediments formed are classified as carbonate ooze (e.g. foraminifera and coccoliths) and siliceous ooze (e.g. diatoms and radiolarians). Biogenic component in the ocean floor is controlled by ocean fertility, which controls the amount of biogenic particles produced in surface waters and by the water depth which affects the preservation of the particles as they settle to the ocean bottom. As the pressure increases and/or temperature decreases, calcium carbonate and silica become more soluble. At a certain depth known as carbonate compensation depth (~4000 m) and silica compensation depth (~6000 m), all carbonates and silica start to dissolve, and below these boundaries sediment is free of calcium carbonate and silica, respectively. Authigenic minerals are formed in situ in sediments and in the ocean floor, from the precipitation of minerals from the seawater, which may have diverse origins like hydrothermal activity or biogenically produced materials. Typical examples are iron oxides, manganese nodules, marine phosphates, heavy metals and glauconite. Volcanic sediments are resultant of volcanic eruptions and are brought into the oceans mostly by wind. As result, although they are in higher amounts close to volcanoes, they can be globally dispersed after big eruptions. Although ash layers can be useful for correlation and dating, in general they don’t keep any paleoclimatic signal. Cosmic particles are meteor debris and spherules, and represent a smaller fraction of the total of sediment in the oceans, being usually negligible.
Once deposited, sediments can be transported or reworked by bottom currents which can lead to the physical alteration of the sediment and the depositional signal. Other major problem affecting the depositional signal of the sediment is post-depositional diagenesis, which is driven by the bacterially degradation of organic matter.
Assessing climatic changes through environmental magnetic analyses of three sedimentary columns of the North Atlantic Ocean (between 29ºN and 35ºN)
2.2 Variations in Earth’s Orbit
The influence of the Earth’s orbit on climate has been known since the 19th
century when James Croll first advanced this hypothesis. However, only later in the 20th century the Siberian mathematician Milutin Milankovitch elaborated the theory and estimated the duration of these periods, known as Milankovitch cycles. These cycles correspond to three periodicities of the Earth’s orbit: eccentricity, obliquity and precession.
Eccentricity corresponds to the change in the shape of the Earth´s orbit around the Sun, varying from elliptical to almost circular and it is caused by the interaction of the Earth with the gravitational fields of the others planets in the solar system. It has two major cycles of ~413,000 years and ~100,000 years, and varies between values of about 0 (low eccentricity) and 0.05 (high eccentricity). As a consequence of the change in the distance between the Earth and the Sun, the amount of radiation arriving to the top of the atmosphere also changes. When the eccentricity is low, the insolation remains relatively constant along the year but when the eccentricity increases, the amount of energy that arrives to the top of the atmosphere is higher than normal at perihelion and lower than normal at aphelion.
Changes in obliquity of the Earth’s axis correspond to the variation of the angle of the Earth’s axial tilt with respect to the plane of the Earth’s orbit. This movement takes approximately 41,000 years to shift the tilt between 22.1º and 24.5º and back again. Changes in obliquity have an impact on seasonal contrasts. When the obliquity increases, summers in both hemispheres tend to receive more radiation from the Sun and winters less and vice-versa. However, the incoming radiation strongly depends on the latitudinal distribution. Therefore at high latitude the incoming radiation increases with increasing obliquity and at lower latitudes the insolation reduces. At high latitudes, cooler summers tend to favor the growth of the ice sheets by melting less snow and ice from the previous winter, which means that small tilt angles lead to more glaciations.
Precession corresponds to a wobbling motion of the spins axis of the Earth, with a period varying between 23,000 to 26,000 years. It is due to gravitational forces exerted by the Sun and the Moon on the Earth. This cycle leads to a gradual change in the exact position in the Earth’s orbit where the equinoxes and solstices occur, which strongly modulate the latitudinal and seasonal distribution of insolation.
These cycles of the Earth’s orbit can sometimes be recorded in paleoclimate data. Once the measurement of a variable which contribute to several cyclic phenomena, each one associated to a different frequency or period, will contain the overlapping of all these contributions, the different frequencies can be identified in the spectrum of the signal. The most common way to access this information is using spectral analysis, which allows checking for cyclic behavior within the time series. Using the Fourier transform, any time series of 2N elements equally spaced is decomposed into a sum of N harmonics of different amplitude.
The power spectrum can be estimated using the multi-taper method (MTM) (Thomson, 1982; Percival and Walden, 1993) as implemented in the SSA-MTM toolkit (Dettinger et al., 1995) and available in http://www.atmos.ucla.edu/tcd/ssa/. MTM attempts to reduce the variance and bias of spectral estimates by using a small set of tapers (orthogonal window filters multiplying the time series in order to avoid leakage), rather than the unique data taper or spectral window used by Blackman-Tukey methods. It is recommended to use a number K=3 of tapers in order to ensure a good compromise between the required frequency resolution for resolving distinct climate signals and the benefit of multiple spectral degrees of freedom. The spectrum is decomposed into a component called “harmonic” which corresponds to the significant component and a component called “reshaped” which corresponds to contribution that remains after the harmonic component is removed. The search for oscillation spells is obtained through application of the Singular Spectrum Analysis (SSA) (Ghil et al., 2002).
Assessing climatic changes through environmental magnetic analyses of three sedimentary columns of the North Atlantic Ocean (between 29ºN and 35ºN)
Figure 1: Scheme of the variation of the Milankovitch cycles: Eccentricity, Obliquity and Precession (Figure from Chamberlain and Dickey, 2007).
Assessing climatic changes through environmental magnetic analyses of three sedimentary columns of the North Atlantic Ocean (between 29ºN and 35ºN)
2.3 Methods to characterize magnetic phases
In environmental magnetism the study of magnetic properties is used to assess information about concentration, mineralogy and grain size in sediments, because they are controlled by the environmental processes. The most relevant measurements are magnetic susceptibility, anhysteretic and isothermal remanent magnetizations and hysteresis parameters (e.g. Evans and Heller, 2003; Peters and Dekkers, 2003; Liu et al., 2012).
Magnetic susceptibility
Magnetic susceptibility or more precisely the volume magnetic susceptibility, k is defined as the ratio between the induced magnetization (M) and the applied field (H), i.e.
H M
k
(1)
Since both the induced magnetization and the applied field have units of A/m (in SI system) the magnetic susceptibility is dimensionless. The mass susceptibility, χ is obtained dividing by the sample density, ρ:
k
(2)
and in this case the units are m3/kg.
χ is a measure of how “magnetizable” a sample is for a certain applied field. It is strongly dependent on the concentration and on the composition of the samples and constitutes a useful parameter to identify the amount of magnetic minerals within a sample. Most kinds of minerals are either diamagnetic or paramagnetic. Application of the magnetic field alters the orbital motion of the electrons and produces a small induced magnetization, which is linearly dependent on the applied field and reduces to zero when the field is removed (Fig. 2).
Diamagnetism comes from atoms without atomic magnetic moments and when diamagnetic materials acquire a magnetization, this is antiparallel to the applied field and the susceptibility resultant is negative and independent of the temperature.
Paramagnetism, on the other hand, arises from the presence of atoms in which the adjacent atomic moments don’t interact. Magnetization of paramagnetic materials is parallel to the applied field and the susceptibility is positive and strongly dependent on the temperature.
There is another kind of magnetic behavior of special interest: ferromagnetism. Ferromagnetism is originated from atoms with magnetic moments, in which adjacent atomic moments interact strongly. The effect of the interaction is to produce strong magnetizations that can be several orders of magnitude larger than for paramagnetic materials in the same magnetizing field. In ferromagnetic materials, when the applied field is removed, magnetization does not return to zero but is retained.
Assessing climatic changes through environmental magnetic analyses of three sedimentary columns of the North Atlantic Ocean (between 29ºN and 35ºN)
Figure 2: Examples of the magnetization acquired by: a) diamagnetic; b) paramagnetic; and c) ferromagnetic minerals (from the left to the right, respectively).
Frequency-dependent susceptibility
χFD denotes the frequency dependence of the magnetic susceptibility. This dependence arises from particles with superparamagnetic (SP) behavior, which reacts more intensively to applied fields with lower frequency.
χFD is usually given in percentage and calculated such as:
100
LF HF LF FD(3)
In which
χ
LF andχ
HF are the magnetic susceptibilities measured at low and high frequency, respectively. According to Dearing et al (1996) χFD can give a qualitative idea of the typical grain size of the dominant magnetic minerals. Therefore, if: i) FD < 2%, signal dominated by frequency-independent grains, with single-domain (SD) and multi-domain (MD) sizes; ii) FD > 6%, signal dominated by frequency-dependent grains, within the superparamagnetic (SP) grains size and; iii) 2 < FD < 6 %, mixture of both type of behaviors.Isothermal Remanent Magnetization
An isothermal remanent magnetization (IRM) is acquired when a sample is exposed to a strong and almost instantaneous magnetic field at constant temperature. In nature, it is a rare phenomenon although it can occur as the result of lightning strikes, being the most common form of IRM, the one acquired in laboratory.
IRM curves are acquired on previously demagnetized samples and consist in exposure a sample to a successively higher magnetic field until the sample is saturated, acquiring a saturation IRM (SIRM). At this point, if the field is increased beyond this limit, magnetization will remain constant.
Robertson and France (1994) showed that the magnetic mineral phases contributing to a IRM curve have an acquisition path similar to a cumulative log-Gaussian (CLG) function, described using three
Assessing climatic changes through environmental magnetic analyses of three sedimentary columns of the North Atlantic Ocean (between 29ºN and 35ºN) parameters: i) SIRM: the saturation of the IRM, providing an indication on the concentration of magnetic minerals, ii) B1/2: the medium destructive field, which corresponds to the applied field at which the half of the SIRM is acquired, providing a measure of the mean coercivity, iii) DP: the dispersion parameter, expressing the coercivity distribution. IRM curves are usually analyzed with the method developed by Kruiver et al. (2001), which allows the determination of these parameters through the fit of the IRM acquisition data versus the logarithm of the applied field with the acquisition curve expressed: i) on a linear scale (LAP), ii) as a gradient (GAP) and iii) on a probability scale (SAP).
S-ratio
The S-ratio gives an idea about the relative abundance between high and low coercivity magnetic minerals, within a sample. The S-ratio is calculated as S = -IRM-03T/ IRM1T (King and Channell, 1991), i.e. an IRM is acquired in a direct field of 1 T, followed by the acquisition of another IRM in a backfield of 0.3 T. Usually it is used the field of 0.3 T because is the maximum value for the coercivities of the titanomagnetite solid solution. Other iron oxides (like hematite) and iron-sulfides (like pyrrothite and goethite) commonly show higher coercivities (Dunlop and Özdemir, 1997).
Therefore, as closer the values of S-ratio are from the unity, higher is the signature of low-coercivity magnetic minerals.
Anhysteretic Remanent Magnetization
Anhysteretic remanent magnetization (ARM) is a laboratory-produced magnetization generated when a sample is placed under an alternating magnetic field (e.g. ~100 mT) superimposed by a small direct biased field (e.g. ~50 µT). The alternating field unlocks the magnetic moments of the sample and the DC bias field magnetizes all particles with coercivity equal or lesser than the maximum field along the direction of the direct field. It responds preferentially to SD grains, because they are more efficient at acquiring remanence than larger particles.
ARM is also proportional to the direct bias field and is therefore common expressed as the ARM susceptibility (χARM). χARM is the mass normalized ARM (in Am2/kg) per unit bias field. Therefore, both ARM and χARM are proportional to the concentration and coercivity of the main magnetic carriers.
χ
ARM/χ
and ARM/SIRMχARM/χ and ARM/SIRM (Banerjee et al., 1981; King et al., 1982) ratios are widely used as magnetite grain size indicator. All the magnetic parameters used in both ratios are sensitive to the concentration of ferromagnetic minerals. However, ARM (or χARM) is particularly sensitive to the coercivity of magnetite grains, following a log quasi-linear decrease with increasing grain size (e.g. Egli and Lowrie, 2002). Although χ and IRM tend to increase from SD to MD grains, they are relatively independent of grain size when compared to χARM and ARM. Therefore, such ratios will be mostly sensitive to variations of magnetic coercivity, i.e., inferring the grain size according to the variations of ARM.
Hysteresis parameters
When ferrimagnetic minerals are magnetized by a magnetic field they present hysteresis behavior and the determination of specific parameters that are related with the physical properties of the main magnetic carriers.
Assessing climatic changes through environmental magnetic analyses of three sedimentary columns of the North Atlantic Ocean (between 29ºN and 35ºN) magnetizing field and/or using the remanent saturation magnetization (Mrs or SIRM) which corresponds to the magnetization that remains after removed the applied field.
Coercivity of the remanence (Hc) is the applied field needed to remove the induced magnetization back to zero and coercive remanent force (Hcr)is the reversed field needed to remove Mrs.
Although Hc and Hcr can give some information about the coercivity of the minerals, they are not much used in this form. Instead their ratio is a powerful grain size indicator (Day et al., 1977).
Hysteresis parameters are particularly useful to assess grain size information, using the plot of coercivity ratio (Hcr/Hc) versus magnetization ratio (Mrs/Ms) known as Day plot (Day et al., 1977). This graph was initially proposed to distinguish particle sizes in titanomagnetites and was then improved with the integration of the theoretical curves proposed by Dunlop (2002a, b), allowing this way a better constrained of the grain size, namely the SP particles and mixtures of magnetic minerals.
Assessing climatic changes through environmental magnetic analyses of three sedimentary columns of the North Atlantic Ocean (between 29ºN and 35ºN)
3. Methods and Sampling
The three cores analyzed in this work were recovered during an oceanographic mission of the Task Group for the Extension of the Continental Shelf (EMEPC) at the Atlantic Ocean in the year of 2007 (see location at Fig. 3).
Core C02 was collected near Atlantis Seamount (34.5462ºN; 31.9310ºW) from a water depth of 3500 m, allowing the recovery of 114 cubic samples along the 300 cm length.
Core C05 was taken from Great Meteor Tablemount (29.7034ºN; 28.2642ºW) at 2500 m water depth. First 47cm of the core presented very disturbed sediment and were excluded, only allowing the recovery of 58 samples along the 347 cm length.
Core C07 was located around Cruiser Tablemount (32,024ºN; 27,746ºW) in a water depth of 1840 m and a total of 157 samples were collected from the 250 cm length.
The cores were sampled using plastic cubic boxes of 8 cm3, which were kept at approximately 4ºC to prevent chemical alterations. Samples were dried before measurements and the respective mass measured for latter normalization of the several magnetic parameters here used.
Magnetic susceptibility (χ) was measured in all samples at three distinct frequencies of 976, 3904 and 15616 Hz in an applied field of 200A/m using the MFK1 Kappabridge. Anhysteretic remanent magnetization (ARM) was imparted in a maximum alternating field of 100 mT and a DC bias field of 50 µT, using AMU-1A coupled with LDA-3A AF demagnetizer. The anhysteretic susceptibility,
χ
ARM was calculated as the ARM intensity normalized by the DC bias field. The isothermal remanent magnetization (IRM) was gradually acquired until a maximum applied field of 1.2T, using an IM-10-30 impulse magnetizer. IRM was also acquired in a field of 1 T followed by the acquisition of the IRM in a back field of -0.3 T to determine the S-ratio. The remanent magnetizations were acquired in selected samples and measured in the low speed mode of JR-6 magnetometer in order to avoid sediment perturbations.Magnetic analyses of core C07 were complemented by classical hysteresis measurements. Hysteresis loops were performed in Laboratory of Rock Magnetism, Institute of Geophysics ASCR in Prague, using the EV9 Vibrating Sample Magnetometer made by ADE Corporation (USA).The measurement sequence includes hysteresis loop and isothermal remanent magnetization acquisition followed by D.C. remagnetization. Short sequence includes hysteresis loop and D.C. remagnetization.
Loops of the full sequence were measured until the maximum applied field of ±2 T and the short sequence was measured until ±1 T.
Isothermal remanent magnetization acquisition was measured on previously demagnetized sample after the application of fields from 0 to 2 T and a total of 95 data points were obtained for each sample. The D.C. remagnetization was measured after previous saturation in a field of -1 T being followed by the same procedure as in the IRM acquisition, except in the case of the short sequence where the maximum applied field was 650 mT.
The grain size analysis of core C07 was conducted in 65 samples using a laser granulometer, Malvern Particle Size Analyzer Mastersizer MS2000, which provides the grain-size data as a volume for all the textural distribution (0.02 µm to 2 mm). Sediment textural type was determined according to Flemming (2000).
Spectral analysis was performed using the Multi-Taper method (MTM) (Thomson, 1982), which has the advantage of reducing spectral leakage (bias) by obtaining multiple independent estimates from the same sample, being particularly efficient for small datasets as it is the case. The analysis was performed using the software “SSA-MTM Toolkit”, freely available at http://www.atmos.ucla.edu/tcd/ssa/ (Dettinger et al., 1995). Peaks in the power spectra were considered significant only for confidence levels higher than 90%. The search for oscillation spells is obtained through application of the Singular Spectrum Analysis (SSA) (Ghil et al., 2002).
Assessing climatic changes through environmental magnetic analyses of three sedimentary columns of the North Atlantic Ocean (between 29ºN and 35ºN)
Figure 3: Bathymetric map showing the location of the three studied cores: core C02 in Atlantis Seamount (34.5462ºN; 31.9310ºW), core C05 in Great Meteor Tablemount (29.7034ºN; 28.2642ºW)
Assessing climatic changes through environmental magnetic analyses of three sedimentary columns of the North Atlantic Ocean (between 29ºN and 35ºN)
4. Results
4.1 Environmental magnetism analyses
χ presents significant variations along the sedimentary columns C02 and C07 (between 10-9
-10-7 m3/kg), mostly characterized by several peaks that are separated by intervals with stable values (Fig. 4). Exception to this behavior is achieved for core C05, which shows low and quite stable values along the sedimentary column (around 10-9-10-8 m3/kg).
C02 is characterized by a sharp decay of χ on the top of the core, with highest values, followed by a trend towards lowest values, closest to the average until the core base. This behavior is only interrupted by a well defined interval between 161 and 120 cm with the minimum values observed in core. In C07 the intervals of 198-147 cm and 96-4 cm are rather variable and present the highest values of χ. In contrast, the intervals 246-200 cm and 146-97 cm are relatively stable and have the lowest values (Fig.4).
The behavior of χ is similar to the observed for magnetic parameters sensitive to the amount of ferromagnetic (s.l.) carriers, like IRM1T (Fig. 4). The comparison between χ with such remanent parameter shows a linear trend (cf. Fig. 5), pointing for ferromagnetic (s.l.) as the class of magnetic minerals responsible for the variations observed at χ.
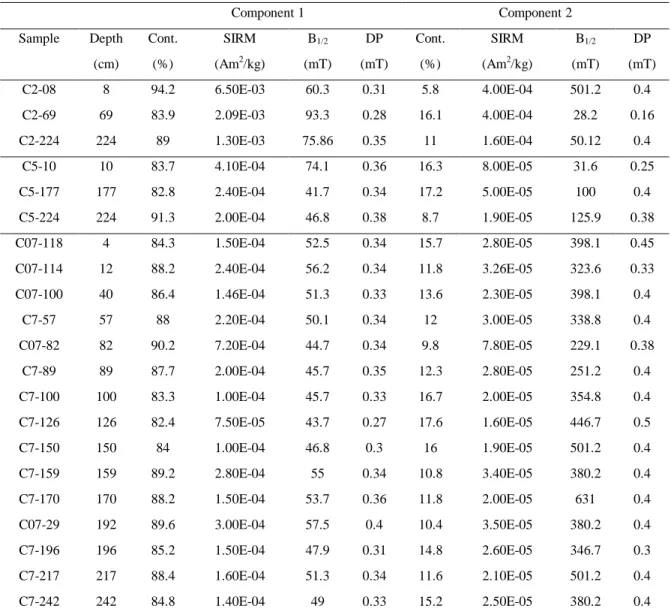
In order to analyze the main ferromagnetic carriers IRM acquisition was conducted until the applied field of 1.2 T in C02 and C05 and 2.0 T in C07. From such analyses it is observed a strong increase of the remanence until the applied field of 300 mT, followed by a gradual and slight increase of IRM until the maximum applied field (Fig. 6). This denotes the presence of a mixture of magnetic minerals with distinct coercivities, which is confirmed by the cumulative log-Gaussian analysis (Robertson and France, 1994; Kruiver et al., 2001).The lower coercivity component presents values of B1/2 around 42-76 mT, contributing with 82-94% to the total remanence (Table 1). Conversely, the higher coercivity component has values of B1/2 of 30-630 mT and contributes with 6-18% to the total magnetic signal. The three cores are characterized by relatively uniform values of S-ratio which in general don’t vary beyond 0.88-0.93 (Fig.7). C02 is quite uniform in depth while C05 and C07 exhibit marked down-core changes. A decrease of this parameter is observed in C05 in the interval between 151-53 cm and in C07 between 191-170 cm, corresponding to an increase of the high coercive component. On the other hand, an increase of the S-ratio is observed in C05 in the intervals between 282 -154 cm and in C07 between 82-75, i.e. in these intervals the contribution of high-coercive minerals is negligible.
S-ratio supports the IRM results suggesting low-coercive minerals, most likely magnetite or its oxidized counterpart maghemite as the predominant magnetic carriers with minor contributions of high-coercive magnetic minerals such as hematite and/or goethite (Oldfield, 1991; Liu et al., 2012).
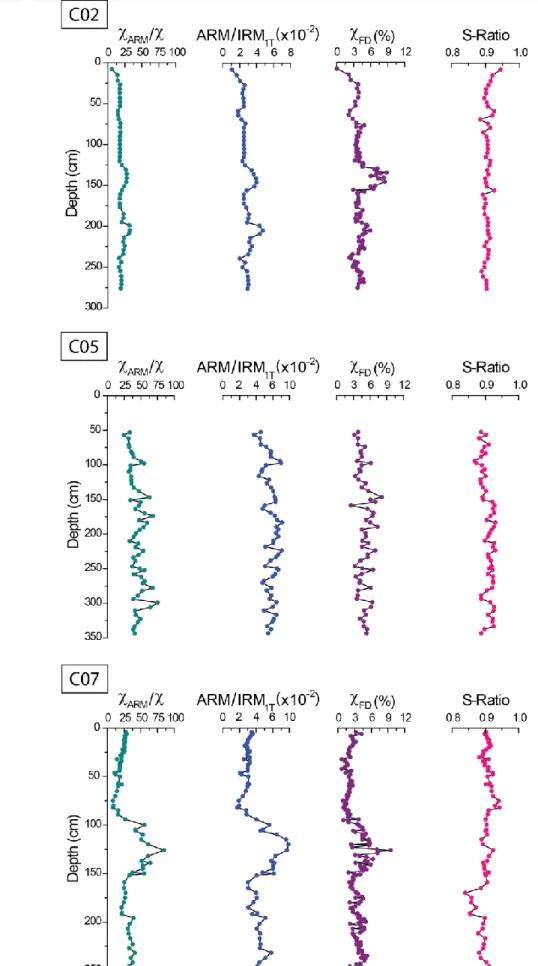
The ratios χARM/χ and ARM/IRM1T are sensitive to the magnetic mineral grain size and have similar trends along the cores (Fig.7).
The thinner particles appear in C02 in the intervals 214-195 cm and 156-125 cm and in C07 between 152-89 cm. In general, magnetic grain size tends to slightly increases from the core base towards the surface.Exception to this behavior is achieved for C05, whose grain size is the thinnest and does not present the well defined intervals observed in the other two cores.
The χFD, which is sensitive to the SP ferrimagnetic grains, presents values between 1% and 9% (Fig.7). According to Dearing et al. (1996) this indicates that the cores are essentially composed by a mixture of SP and SD/MD grains for values of 2 < χFD< 6% and mostly by SP grains where χFD > 6%, which is
Assessing climatic changes through environmental magnetic analyses of three sedimentary columns of the North Atlantic Ocean (between 29ºN and 35ºN)
Figure 4: Concentration dependent parameters determined for core C02, core C05 and core C07: magnetic susceptibility (orange); isothermal remanent magnetization acquired at 1T (green); and
Assessing climatic changes through environmental magnetic analyses of three sedimentary columns of the North Atlantic Ocean (between 29ºN and 35ºN)
Assessing climatic changes through environmental magnetic analyses of three sedimentary columns of the North Atlantic Ocean (between 29ºN and 35ºN)
Table 1- Parameters describing the IRM acquisition curves of C02, C05 and C07* Component 1 Component 2
Sample Depth Cont. SIRM B1/2 DP Cont. SIRM B1/2 DP (cm) (%) (Am2/kg) (mT) (mT) (%) (Am2/kg) (mT) (mT) C2-08 8 94.2 6.50E-03 60.3 0.31 5.8 4.00E-04 501.2 0.4 C2-69 69 83.9 2.09E-03 93.3 0.28 16.1 4.00E-04 28.2 0.16 C2-224 224 89 1.30E-03 75.86 0.35 11 1.60E-04 50.12 0.4 C5-10 10 83.7 4.10E-04 74.1 0.36 16.3 8.00E-05 31.6 0.25 C5-177 177 82.8 2.40E-04 41.7 0.34 17.2 5.00E-05 100 0.4 C5-224 224 91.3 2.00E-04 46.8 0.38 8.7 1.90E-05 125.9 0.38 C07-118 4 84.3 1.50E-04 52.5 0.34 15.7 2.80E-05 398.1 0.45 C07-114 12 88.2 2.40E-04 56.2 0.34 11.8 3.26E-05 323.6 0.33 C07-100 40 86.4 1.46E-04 51.3 0.33 13.6 2.30E-05 398.1 0.4 C7-57 57 88 2.20E-04 50.1 0.34 12 3.00E-05 338.8 0.4 C07-82 82 90.2 7.20E-04 44.7 0.34 9.8 7.80E-05 229.1 0.38 C7-89 89 87.7 2.00E-04 45.7 0.35 12.3 2.80E-05 251.2 0.4 C7-100 100 83.3 1.00E-04 45.7 0.33 16.7 2.00E-05 354.8 0.4 C7-126 126 82.4 7.50E-05 43.7 0.27 17.6 1.60E-05 446.7 0.5 C7-150 150 84 1.00E-04 46.8 0.3 16 1.90E-05 501.2 0.4 C7-159 159 89.2 2.80E-04 55 0.34 10.8 3.40E-05 380.2 0.4 C7-170 170 88.2 1.50E-04 53.7 0.36 11.8 2.00E-05 631 0.4 C07-29 192 89.6 3.00E-04 57.5 0.4 10.4 3.50E-05 380.2 0.4 C7-196 196 85.2 1.50E-04 47.9 0.31 14.8 2.60E-05 346.7 0.3 C7-217 217 88.4 1.60E-04 51.3 0.34 11.6 2.10E-05 501.2 0.4 C7-242 242 84.8 1.40E-04 49 0.33 15.2 2.50E-05 380.2 0.4
*Cont.-contribution of each component to the total IRM; SIRM- saturation of the IRM; B1/2 – medium destructive field; DP- dispersion parameter.
Assessing climatic changes through environmental magnetic analyses of three sedimentary columns of the North Atlantic Ocean (between 29ºN and 35ºN)
Figure 6: Isothermal Remanent Magnetization (IRM) curves of selected samples from core C02, C05 and C07 treated by the software developed by Kruiver et al. (2001).
Assessing climatic changes through environmental magnetic analyses of three sedimentary columns of the North Atlantic Ocean (between 29ºN and 35ºN)
Figure 7: Grain size dependent parameters determined for core C02, core C05 and core C07: ratio of anhysteretic susceptibility and magnetic susceptibility (dark cyan); ratio of anhysteretic and isothermal
Assessing climatic changes through environmental magnetic analyses of three sedimentary columns of the North Atlantic Ocean (between 29ºN and 35ºN)
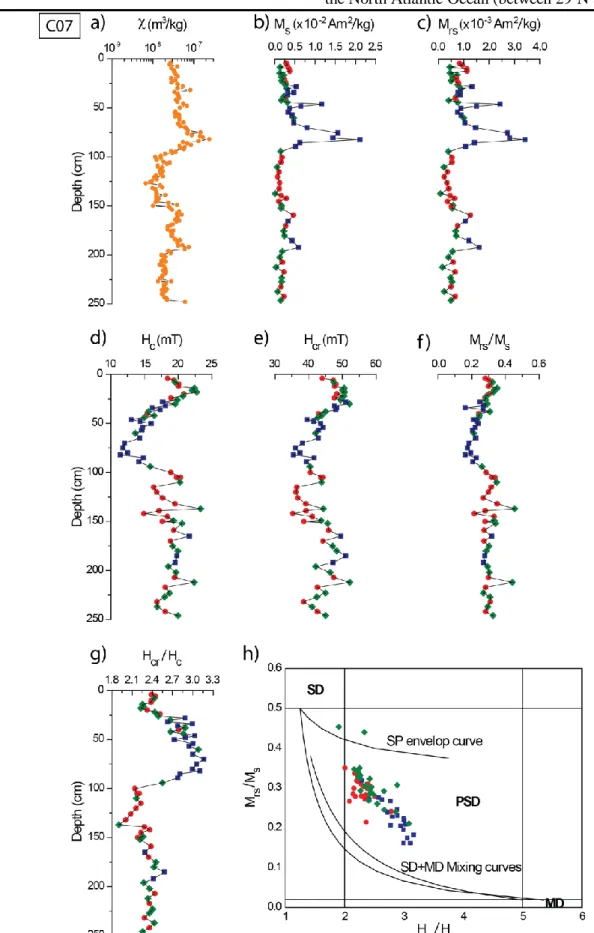
Room-temperature hysteresis loops of C07 were measured in order to obtain data for the concentration and grain-size distribution assessment.
From such analyses was possible to identify three types of curves according to the main magnetic carriers (Hana Grison, personal communication), i.e., diamagnetic, paramagnetic and ferromagnetic. From the behavior of the hysteresis loops, was possible to distinguish characteristics intervals in the sedimentary column. A high fraction of diamagnetic minerals and paramagnetic minerals with weak ferrimagnetic content, define three intervals between 246-196, 159-94 cm and 26-4 cm. Intercalated with them, two other intervals between 192-165 cm and 89-28 cm are characterized by paramagnetic minerals with high fraction of ferrimagnetic content (Fig.8).
Ms and Mrs can reflect magnetic mineral concentration when the magnetic grain size and mineralogy remain relatively constant (Liu et al., 2012), as observed in C07. Ms and Mrs show good agreement with the results obtained for χ, IRM1T, χARM (Fig. 6), showing two intervals with low and quite stable values (between 246-196 cm and 151-94 cm) and other two intervals with variable and highest values (between 192-159 cm and 89-28 cm).
Information about grain size can be accessed from the Mrs/Ms and Hcr/Hc ratios which show the similar pattern observed for χARM/χ and ARM/IRM1T ratios along the core (cf. Fig. 6 and Fig. 8). Data obtained from the hysteresis loop confirms the presence of finer particles between 152 and 94 cm and coarser grains on the top of the core (Fig. 8).
Additional information about grain size variation can be inferred from the Day plot (Day et al, 1977) with the theoretical curves proposed by Dunlop (2002a). The hysteresis parameters displayed in the Day plot (Fig. 8) are distributed on the PSD domain, following approximately the SD+MD mixing curves, but shifted towards the right, which could be explained by the presence of SP particles (Dunlop, 2002a, b). It is worth nothing than the two samples from 212 cm and from 137 cm that exhibit a different behavior in the Day plot, following the SP envelop curve.
Assessing climatic changes through environmental magnetic analyses of three sedimentary columns of the North Atlantic Ocean (between 29ºN and 35ºN)
Figure 8: Hysteresis parameters of core C07. a) Magnetic susceptibility; b) Saturation magnetization; c) Remanent saturation magnetization; d) Coercivity; e) Coercivity of the remanence; f) Ratio between the remanent saturation magnetization and saturation magnetization; g) Ratio between the coercivity of the remanence and coercivity; h) Day plot (Day et al., 1977; Dunlop, 2002a, b), with the
different magnetic behaviors: diamagnetism (red circles), paramagnetism with weak ferrimagnetism (green diamonds) and paramagnetism with high portion of ferrimagnetism (blue squares).
Assessing climatic changes through environmental magnetic analyses of three sedimentary columns of the North Atlantic Ocean (between 29ºN and 35ºN)
4.2 Sedimentology of core C07
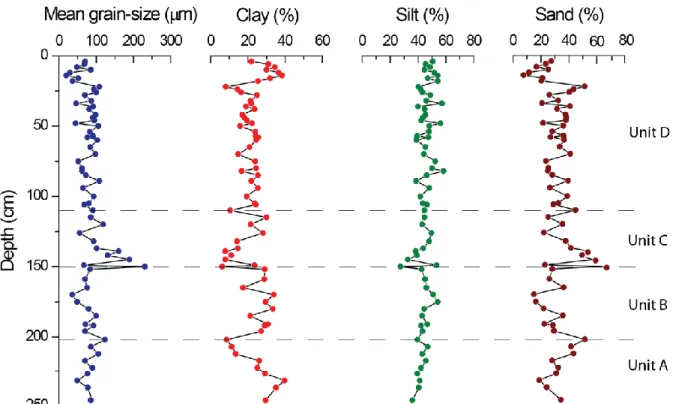
Grain-size analyses of C07 show four main sedimentary units (Fig. 9).
Units A and B have a mean grain-size average of approximately 80 µm; unit C is the coarsest with a mean grain-size average of 143 µm and unit D, the shallower is finer with a mean grain-size average of 64 µm and present a uniform textural type. Some peaks of mean grain-size are observed at 150 cm (231 µm), 145 cm (190 µm) and 14 cm (20 µm).
The core composition mostly corresponds to clay, silt and sand. The silt content is very uniform, consisting of approximately 50%, and the clay and sand content are in phase opposition varying between 6-38% and 8-66%, respectively. The sand content follows the mean grain-size behavior.
Figure 9: Sedimentology of core C07. Mean grain-size, clay, silt and sand content and the four main sedimentary units (from the left to the right, respectively).
Assessing climatic changes through environmental magnetic analyses of three sedimentary columns of the North Atlantic Ocean (between 29ºN and 35ºN)
4.3 Spectral analyses
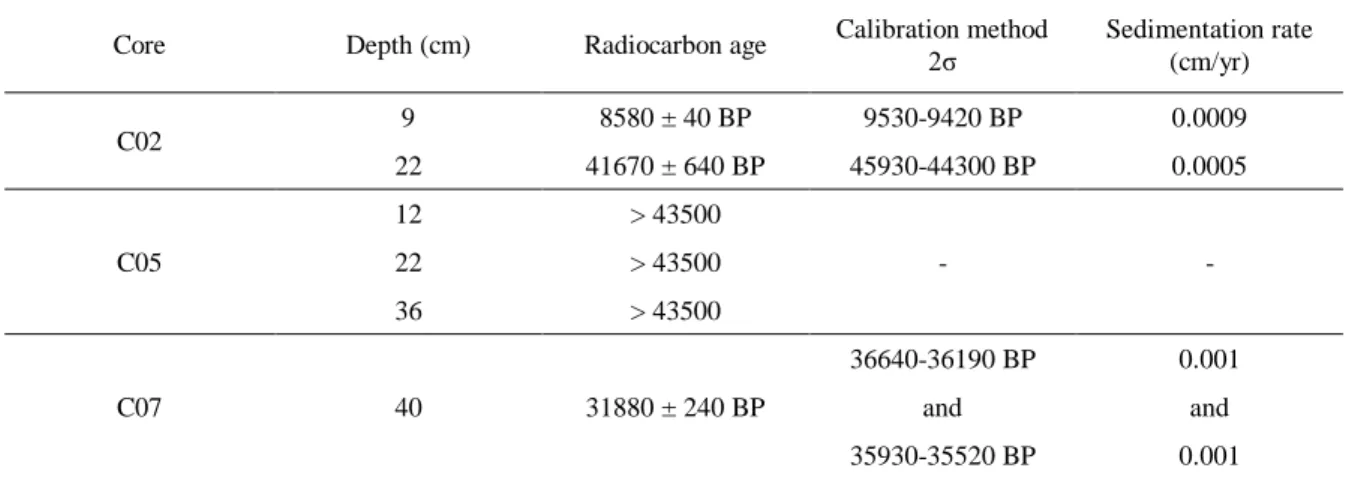
Radiocarbon dates were determined for the first centimeters of each core in order to constrain ages for the last 43 kyr (Table 1; Palma, Ph.D. thesis in prep.). Subsequent sedimentation rates calculated for the first centimeters of C02 and C07 yield values around 0.9 cm/kyr until the 9 cm and 0.5 cm/kyr from 9 to 22 cm; and 1 cm/kyr until 40 cm, respectively (Table 1; Palma, Ph.D. thesis in prep.). Although the sedimentation rates can vary significantly from one oceanic basin to another, depending essentially on the type of environment, values here obtained, although low are within the typical values observed for pelagic sediments, which are around 1 cm/kyr (e.g. Liu et al., 2012).
Once the three 14C ages obtained for C05 show values > 43,500 BP the sedimentation rates weren’t estimated.
Table 2- Radiocarbon dates and sedimentation rates obtained for the first centimeters of each core (Palma, Ph.D. thesis in prep.).
Core Depth (cm) Radiocarbon age Calibration method 2σ Sedimentation rate (cm/yr) C02 9 8580 ± 40 BP 9530-9420 BP 0.0009 22 41670 ± 640 BP 45930-44300 BP 0.0005 C05 12 > 43500 - - 22 > 43500 36 > 43500 C07 36640-36190 BP 0.001 40 31880 ± 240 BP and and 35930-35520 BP 0.001
Since the results obtained by radiocarbon dates are limited to a few centimeters of the sedimentary columns, a tentative to obtain possible sedimentation rates for the entire columns was made using spectral analyses for χ and ARM/IRM1T ratio time series. Assuming that the peaks observed in the power spectrum correspond to the Milankovitch orbital cycles, we may be able to deduce possible sedimentation rates by fitting the peaks observed to the periods corresponding to the precession (23,000-26,000 years), obliquity (41,000 years) and eccentricity (100,000 years).
Taking a sedimentation rate of 1 cm/kyr, the power spectrum of C02 shows significant spectral peaks for χ and for ARM/IRM1T ratio. In χ power spectrum two peaks appear near the periods of 43,000 years and 93,000 years, suggesting a close link to the obliquity (41,000 years) and eccentricity (100,000 years) orbital forcing’s (Fig. 9). In ARM/IRM1T power spectrum three peaks closely follow periodicities of about 26,000 years, 42,000 years and 87,000 years possibly linked to the precession (23,000-26,000 years), obliquity (41,000 years) and eccentricity (100,000 years). For C07, the χ power spectrum does not show any significant peak, but the ARM/IRM1T ratio power spectrum displays two meaningful peaks centered near the periodicities of 23,000 and 53,000 years. As the second peak corresponds to a wide sinusoid spanning from 33,000 to 141,000 years, which do not correspond to any climatic cyclicity, we recalculate the spectrum assuming a sedimentation rate of 1.6 cm/kyr. In this case, the ARM/IRM1T power spectrum shows two peaks centered at about 36,000 years and 86,000 years, which are not far from the obliquity (41,000 years) and eccentricity (100,000 years) orbital forcing’s.
Assessing climatic changes through environmental magnetic analyses of three sedimentary columns of the North Atlantic Ocean (between 29ºN and 35ºN)
Figure 10: Power spectra obtained by MTM and 50% (median), 90%, 95%, 99% confidence levels for magnetic susceptibility and ARM/IRM1T ratio, respectively from the left to the right, considering: a) a
sedimentation rate of 1 cm/kyr for C02; b) a sedimentation rate of 1 cm/kyr for C07; and c) a sedimentation rate of 1.6 cm/kyr for C07.
Assessing climatic changes through environmental magnetic analyses of three sedimentary columns of the North Atlantic Ocean (between 29ºN and 35ºN)
5. Discussion
The environmental magnetic analyses here conducted indicate that magnetite and/or maghemite are responsible for approximately 90% of the magnetic signature. Parameters sensitive to the concentration of these magnetic carriers (e.g., χ, IRM1T and Ms) show significant variations along the core. Such variations correspond to intervals with several peaks of magnetic susceptibility interrupted by others with low and stable values.
These intervals have a correspondence in terms of the magnetic granulometric state. Intervals with low and stable concentration of ferromagnetic carriers present an increase on χFD values as well on ratios ARM/IRM1T, χARM/χ, Mrs/Ms and decrease on ratio Hcr/Hc. Therefore, all of these parameters point towards the presence of thinner ferromagnetic granulometry. Otherwise, intervals dominated by the occurrence of several magnetic susceptibility peaks show the opposite behavior in what concerns the several magnetic parameters sensitive to the magnetic grain size, i.e., pointing towards a coarser magnetic granulometry (see relative distribution of magnetic grainulometry at Day diagram –Fig. 8). By comparing the behavior of magnetic parameters sensitive to the magnetic concentration and grain size, namely χ and ARM/IRM1T it is possible to separate the cores C02 and C07 into four main magnetic units (cf. Fig. 11). Units I and III represent the sedimentary layers with stable concentration of ferromagnetic grains of thinner size. Units II and IV represent the intervals with several peaks of χ and coarser magnetic carriers. The limits between these units are achieved at 255, 155 and 75 cm for core C02, and at 196, 146 and 97 cm for core C07.
Figure 11: Comparison between magnetic susceptibility (orange) and ARM/IRM1T ratio (blue) for core
C02 and core C07, respectively. Magnetic units are identified by the numbers on the right side of the plot.
As above mentioned, units I and III, present a low and stable concentration of thinner magnetic grains, which is indicative of stable conditions in the depositional environment. According to the high field analyses, these units are fairly rich in diamagnetic minerals. These minerals are commonly observed in deep sea environments as a result of high biogenic activity, deriving from the water column which is mainly composed of carbonate ooze (e.g. Levin and Gooday, 2003). These intervals represent a typical pelagic sedimentation with low terrigenous component that is in general rich in paramagnetic and ferromagnetic minerals. The decrease of detrital inputs into the oceanic basins mostly occur during cold and dry periods, i.e., during glacial periods (e.g. Sagnotti et al., 1998). Therefore, several evidences sustain units I and III as being representative of a sedimentation regime contemporaneous of glacial
Assessing climatic changes through environmental magnetic analyses of three sedimentary columns of the North Atlantic Ocean (between 29ºN and 35ºN) periods. The thinner magnetic particles at units I and III also suggests the presence of biomineralization processes. Since 1975 (Blakemore, 1975) it is known that some bacteria are able to produce thinner particles of magnetite that works as a navigational system (magnetotactic bacteria). These bacteria are found in several environmental settings, including deep-ocean basins (Evans and Heller, 2003). The size of bio-formed magnetite grains typically range from nanometers to micrometers, i.e., within the granulometric behavior of superparamagnetic – SP to single-domain – SD particles (Kopp and Kirschvink, 2007). Looking for the magnetic granulometry (cf. relative distribution of magnetic granulometry at Day diagram – Fig. 8), it is easily recognized that these units show a relative increase of the thinner magnetic fraction, with significant contribution of particles in the superparamagnetic (SP) – single-domain (SD) range.
On the other hand, the intervals characterized by several peaks of magnetic susceptibility, show coarser magnetic grain size and increase of the paramagnetic content (units II and IV), denoting totally different environmental conditions. These characteristics claim for significant inputs of terrigenous sediments. One could expect that the mechanism responsible for the transport of paramagnetic and coarser ferromagnetic minerals in these intervals would have to be strong enough to put coarser minerals in motion, something that did not happen during the periods in which χ is relatively constant and the particle size is quite thin. Since the area occupied by the two cores is not supplied by rivers, these magnetic minerals should have been transported by icebergs melting and/or wind, which carry ice rafted debris and dust, which correspond to the large sources of terrestrial material into the deep Atlantic Ocean basins at high (e.g. McManus et al., 1998; Watkins et al., 2007) and low latitudes (e.g. Rea, 1994; Maher, 2011), respectively.
High values of χ associated with coarser magnetic carriers are typically observed in ice rafted-debris (IRD) transported to the ocean during the well-known Heinrich events (e.g. Robinson et al., 1995; Stoner et al., 1996, 2000). Moreover, the dominant presence of low coercivity magnetic minerals, with S-ratio > 0.9 supports this interpretation (Grousset et al., 1993; Hemming et al., 2004).
The sediments are relatively thin (<100 µm), which contradicts the typical definition of IRD as being coarse lithic grains (>150 µm). Although considerable disagreement still exists about the quantification of IRD in marine sediments (see Hemming, 2004), according to Andrews (2000) the coarse fraction present in the base of the icebergs is generally small and the grain size is strongly dependent on the provenance of the sediments eroded by the glaciers as well by the distance of transport under the glacier. Since we do not observe any increase in the total size of the particles that compose the cores (at least for C07), but only an increase in the size of the magnetic minerals, it could mean that the sediments suffered a large transport. Although the water temperature during the Heinrich events at latitudes south of 40ºN in the central Atlantic were cool, studies suggest that was too warm to sustain icebergs drifting (Cortijo et al., 1997). However it is possible that after the melting of the icebergs, the thinner fraction the IRD may has been transported by deep sea currents away from the melting point of the icebergs and thus reaching these relatively low latitudes (Watkins et al., 2007).
In C07 between 192-165 cm, variable values of χ and coarse minerals are associated with low S-ratios, implying the presence of high coercivity minerals such as hematite (cf. Fig.7 and Fig.11). In this case, a possible transport of dust probably from Africa’s inland seems more likely, due to the presence of the high coercivity minerals (e.g. Rea, 1994; Maher, 2011). The presence of dust only in C07 can be explained by geographical position of the core, located further south than C02, which could have allowed that during certain periods, winds carrying particles from the African continent have reached the location of the core. However, possible IRD sourced from other continental rocks rich in high coercivity minerals is also possible (e.g. Channell et al., 2013).
The presence of HE records at such low latitudes, if confirmed, will provide new insights about the position of the polar front and Inter Tropical Convergence Zone (ITCZ) during these extreme episodes. Evaluating changes in the polar front and ITCZ positions will contribute to the understanding of couple
Assessing climatic changes through environmental magnetic analyses of three sedimentary columns of the North Atlantic Ocean (between 29ºN and 35ºN) additional information provided by independent proxies like also Ca/Sr ratio and Sr-Nd isotope composition are needed.
Access to an accurate evaluation of the sedimentation rates is also crucial to frame temporally the sedimentary record. Once the ages available by 14C are very limited in number and temporal range, we are unable to know with the desired accuracy the evolution of the sedimentation rates along both cores. Therefore, despite the peaks of susceptibility seems to resemble IRD-type sediments we cannot ensure that they occur during interglacial periods. As example, Kissel et al. (1999) in a study of several deep sea cores distributed within the Atlantic Ocean reported coarse magnetic minerals associated with susceptibility maxima and finer grains coincident with susceptibility minima, like we have. However, their age models indicate that the maxima in the amount of magnetic minerals coincided with warm periods and not with Heinrich events or even cold periods. Based on this, they concluded that they were not in the presence of IRD and the mechanism responsible for the transport of the magnetic minerals was deep sea currents. For an appropriate interpretation of what is recorded in these cores, a complete age model is essential. However for such ancient sediments the most suitable method is oxygen isotope stratigraphy, which is a relatively slow method, and despite our efforts to get the results at time, this was not possible and it is still ongoing.
In the absence of direct methods to infer the sedimentation rates, spectral analyses were used, assuming sedimentation rates of 1 cm/kyr (C02) and 1.6 cm/kyr (C07), as merely first approximations. Results obtained for core C02 are in a satisfactory agreement with the Milankovitch orbital cycles, namely with the obliquity (41,000 years) and eccentricity (100,000 years) orbital forcing’s periods. The same is not observed for core C07. The most likely explanation for the absence of spectral peaks in χ is the fact that the χ data series show a well-marked peak centered between 85-75 cm (cf. Fig. 4). Since the MTM gives more importance to data centered at the middle of the series and less to the corners, it is very likely that the method is giving to much weight to this “anomalous” data. In the case of ARM/IRM1T power spectrum, for a sedimentation rate of 1 cm/kyr a wide peak appears from the period of ~40,000 to ~100,000 years. This peak can be justified in the same way than the absence of spectral peaks in χ. The MTM may be giving to much weigh to a peak observed in the data series of ARM/IRM1T between 150-100 cm (cf. Fig. 7). Data series not large enough, the occurrence of some extreme phenomenon whose signal is superimposed to the climatic forcing and a variable sedimentation rate, are other possible explanations for the failure of spectral analyses at C07.
Unlike the others cores, C05: i) does not present well defined intervals (cf. Figs. 4 and 7); ii) presents low and stable susceptibility values along the sedimentary column; and iii) all the 14C ages gave ages higher than 43,500 years. Once this core was retrieved at the flank of the Great Meteor Tablemount, it is suggested that the “sedimentary homogenization” result from a landslide and respective gravity current.
Assessing climatic changes through environmental magnetic analyses of three sedimentary columns of the North Atlantic Ocean (between 29ºN and 35ºN)
6. Conclusions
The study of three sedimentary cores located in the Atlantic Ocean between the latitudes of 29º and 35ºN, allowed access the evolution of climate through different environmental conditions during the past thousands of years.
Magnetic results show that that magnetite and/or maghemite are responsible for ~90% of the magnetic signal encountered at these cores. The remaining signal result from high coercivity minerals, must probably hematite and/or goethite.
The sedimentary columns C02 and C07 present transitions between stable and rather variable intervals of magnetic susceptibility values and magnetic grain size. The stable intervals are characterized by low and almost constant values of magnetic susceptibility, regular thinner particles and high fraction of diamagnetic minerals. On the other hand, intervals with strong variations of magnetic susceptibility values, reveal synchronous oscillations of the content of ferrimagnetic minerals with coarser granulometry and high amounts of paramagnetic minerals. The changes between the intervals denote different environmental conditions.
Spectral analyses performed for χ and ARM/IRM1T of C02 show periodicities closed to the Milankovitch orbital cycles, taking constant sedimentation rates of 1 cm/kyr. For core C07, the same isn’t observed (with an assumed sedimentation rate of 1.6 cm/kyr) and further research should be done. In both cores maxima of χ and coarser magnetic carriers suggest the presence of ice-rafted debris (IRD) transported by icebergs during the Heinrich events at low latitudes (32ºN). However, independent and complementary data, like oxygen isotopic stratigraphy, Ca/Sr ratio and Sr-Nd isotopic composition are needed to confirm it.
In core C05, magnetic results as the absence of well defined intervals and the low and quite stable values of magnetic susceptibility combined with 14C ages suggest that the core correspond to landslide.