Article
0103 - 5053 $6.00+0.00
*e-mail: [email protected]; [email protected]
2D and 3D QSAR Studies of the Receptor Binding Afinity of Progestins
Lea da Silva Veras,a Masamoto Arakawa,b Kimito Funatsub and Yuji Takahata*,a,c
aInstituto de Química, Universidade Estadual de Campinas, 6154, 13083-970 Campinas-SP, Brazil
bDepartment of Chemical System Engineering, Faculty of Engineering, The University of Tokyo,
7-3-1, Hongo, Bunkyo-ku, Japan
cEscola de Engenharia, Universidade do Estado do Amazonas, Av. Darcy Vargas, 1200,
Parque 10, 69065-020 Manaus-AM, Brazil
Foi realizada uma análise de QSAR-2D com três descritores sobre a ainidade de ligação a receptor no citosolo humano. Um conjunto de vinte e três progesteronas foi dividido em um conjunto de treinamento de dezesseis compostos e em um conjunto de teste de sete compostos. O método quântico semi-empírico RM1 foi usado para calcular a geometria e algumas propriedades moleculares. O software DRAGON também foi usado para produzir descritores. O software MobyDigs foi usado para selecionar descritores e construir modelos QSAR. O melhor modelo de QSAR foi construído para o conjunto de treinamento usando regressão linear múltipla com três descritores, PW2, Mor15m e GAP-10, resultando em r2 = 0,886, q2 = 0,805, q2
boot = 0,723, e q2
ext = 0,666. Um conjunto de nove progesteronas adicionais que não foram usadas para construir o modelo QSAR foi empregado para validação externa resultando em q2
ext = 0,403. A validação também foi feita com funções de aptidão RQK. Foi mostrado que o modelo QSAR satisfaz todos os critérios requeridos para validação, indicando que o modelo de regressão é aceitável. Dois modelos QSAR-3D foram construídos: o primeiro para avaliar o poder preditivo e o segundo para ser analisado. O poder preditivo obtido com o conjunto de nove compostos para avaliação externa foi q2
ext = 0,476. Usando a representação gráica dos coeicientes de regressão de PLS, correspondendo às interações espacial e eletrostática, foi possível obter uma interpretação mecânica. Foi mostrado que QSAR-2D e 3D juntos satisfazem todos os seis requerimentos do Princípio de Setubal (Princípio de OECD). A partir das informações obtidas pelo QSAR-3D foram construídas quatro novas progesteronas. As atividades de ainidade de ligação ao receptor destes novos compostos foram várias vezes maiores que qualquer uma do conjunto de vinte e três progesteronas já estudado.
A 2D QSAR analysis with three descriptors of binding afinity to human cytosol receptor was performed. The set of twenty-three progestins was divided into a training set of sixteen molecules and a test set of seven molecules. The quantum chemical RM1 semiempirical method was used to calculate geometry and some molecular properties. DRAGON software was also use to produce descriptors. MobyDigs software was used to select descriptors and build QSAR models. The best 2D QSAR model was constructed for the training set with multiple linear regression (MLR) using three descriptors , PW2, Mor15m, and GAP-10, resulting in r2 = 0.866, q2 = 0.805, q2boot = 0.723, q2
ext = 0.666. A set of nine additional progestins that were not used for model building was used for external validation resulting q2
ext = 0.403. The QSAR model was also validated by RQK itness functions. It was shown to satisfy all the required criteria for validation. Two 3D QSAR models were built, irst, to estimate predictive power, second, to analyze it. The predictive power of the 3D QSAR obtained with the nine external validation compounds was q2
ext = 0.476. Based upon the graphical representation of PLS regression coeficients corresponding to steric and electrostatic interactions, it was possible to obtain a mechanistic interpretation. Thus the 2D and 3D QSAR together satisfy all the six Setubal Principles (OECD principles). Based upon the information obtained from the 3D QSAR analysis, the structures of four new progestins are proposed. Their receptor binding activities are estimated to be several times more potent than the most potent progestin of the twenty-three studied.
Introduction
Progestins1 are sex hormones of which progesterone is the most well known. The two most frequent uses of progestins2 are to prevent endometrial hyperplasia from unopposed estrogen in hormone replacement therapy and for hormonal contraception. Progestins are also used to treat endometriosis, dysfunctional uterine bleeding and secondary amenorrhea, and as a palliative treatment of breast cancer, prostate cancer endometrial cancer. Progesterone1 is a C-21 steroid hormone involved in the female menstrual cycle, preparing the lining of the uterus for implantation of a fertilized ovum. Continued progesterone secretion is necessary for the completion of pregnancy. Progesterone is used for luteal support in in vitro
fertilization (IVF) protocols and for prevention of pre-term birth in pregnant women.3 The combined oral contraceptive pill (COCP), often referred to as the birth-control pill, is a combination of an estrogen and a progestin. Progesterone suppresses ovulation. Pregnant women do not conceive again while pregnant. It was this observation that led to the search for synthetic progestins that could be used as oral contraceptives. Progesterone itself requires very large doses to be effective in suppressing ovulation when taken orally because it is degraded in the intestinal tract.1 COCP’s are currently used by more than 100 million women worldwide and side effects occur in about 6% of users.4 In order to reduce these side effects, studies of other progestins are needed to improve their quality and potency.
The biological activity of progestins is closely related to their binding afinity to the progesterone receptor. In the past, a number of papers were published on the observed receptor binding afinities of progestins to human cytosol receptor proteins.5-11 Because of the wide applicability of progestins for human health problems, it is desirable to investigate their receptor binding afinity. Saha et al.12 performed a quantitative structure activity relationship (QSAR) analysis of the receptor binding afinity of twenty four progestins (P1-P24) with the electrotopological
state atom index (ETSA),13 in an attempt to locate the pharmacophore fragment of the molecule. The coeficient of determination (r2) of the best QSAR model they obtained was 0.66, but no cross-validation of the model was reported. Thus, there is the possibility to improve the quality of the QSAR model and investigate new aspects that were not treated in the earlier paper.
The objective of the present work is to search for better QSAR models for a similar set of progestins in the literature and to investigate new aspects that were not treated previously, applying different QSAR techniques from those applied earlier, in order to elucidate the nature
of the receptor binding. We also propose the structures of several new progestins that are estimated to be more potent than any one of those involved in the present study. We have applied two dimensional (2D) as well as three dimensional (3D) QSAR techniques to achieve this goal.
According to the Setubal Principles14 (currently known as the Organization for Economic Co-operation and Development (OECD) principles15), a QSAR should, (i) be associated with a deined endpoint; (ii) take the form of an
unambiguous and easily applicable algorithm; (iii) ideally,
have a mechanistic interpretation; (iv) be accompanied by
a deinition of domain of applicability; (v) be associated
with a measure of goodness-of-it (internal validation); (vi) be assessed in terms of its predictive power by using
data not used in the development of the model (external validation).
In this work we have tried to satisfy all six Setubal Principles. The irst principle was satisied when we stated our objectives. 2D QSAR is suitable to satisfy the majority of the Setubal Principles, while 3D QSAR is suitable for mechanistic interpretation, the 3rd principle. Older studies on steroids and a recent article17 relate QSAR studies on progestagens with and without 3D and are considered in this work.
Methods
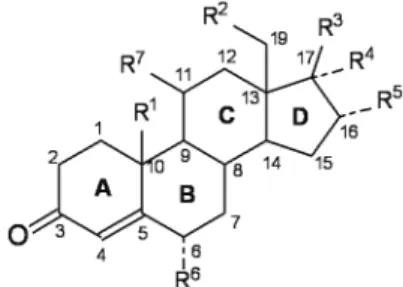
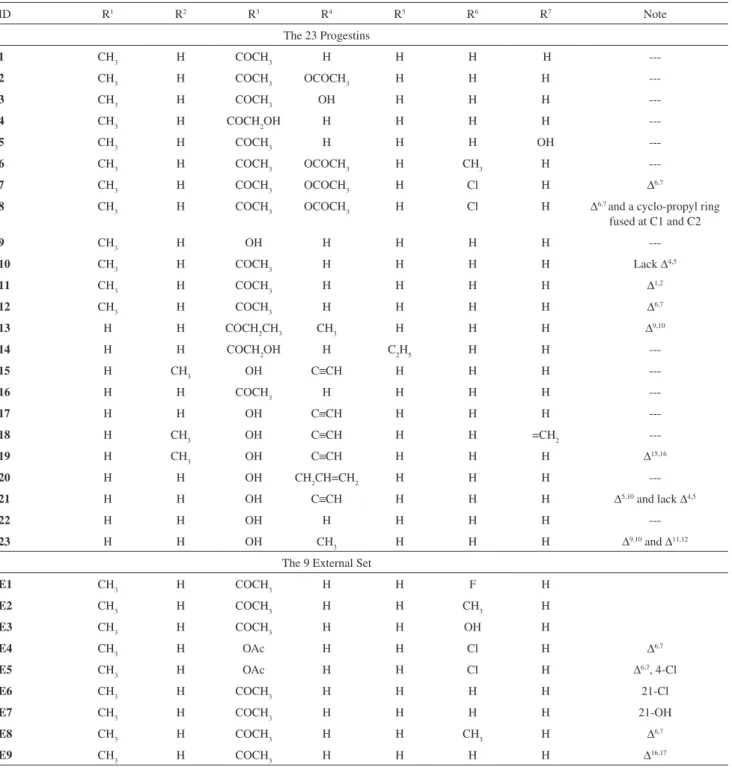
Figure 1 and Table 1 show the set of twenty three progestins (1-23) used to build a QSAR model together
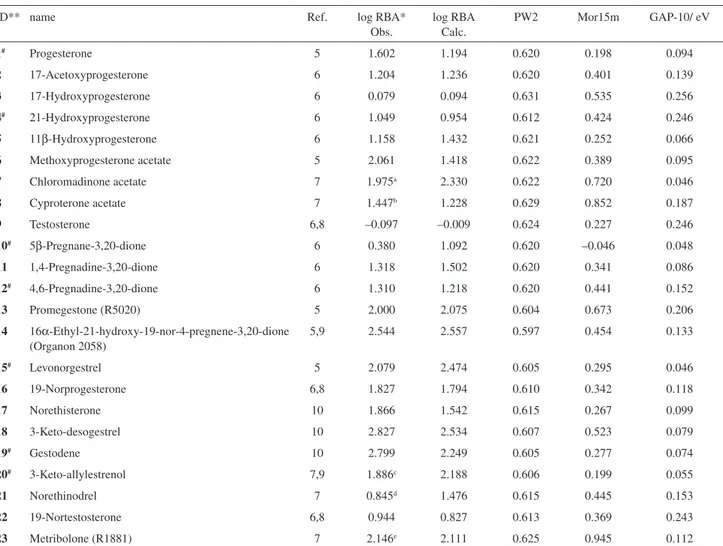
with an external set of nine compounds that were used for an external validation, while Table 2 lists their observed log RBA values, where RBA is the relative binding afinity, a measure of biological activity relative to the binding afinity of promegestone(R5020), which is the reference steroid
most frequently used in receptor studies. In compiling this list, we found six erroneous log RBA values18 in Table I of Saha et al.12 The log RBA values in Table 2 are corrected
ones. Table 2 does not include compound P07 of the list of
24 compounds studied by Saha et al.12 The log RBA values
of compounds P07 and P21 are identical and this causes
Figure 1. Basic structure of the progestins. R1-R7 are the substituents
calculation problems with some of computer packages that we used, so we removed progestin P07 from the original
set of the compounds12 for our QSAR analysis. Thus there were a total of 23 progestins in our set that were used to build a QSAR model.
The ground state geometries of the molecules were optimized with the RM1 (Recife Model 1)19 semiempirical molecular orbital model found in
HyperChem Professional 8.20 The following criteria were used to optimize the ground state geometries: algorithm: Polak-Ribiere; RMS gradient: 0.1 kcal mol-1; maximum number of cycles: 795; solvent: in vacuo. The RM1
method is essentially identical to the AM1 method, but with improved performance and with newer and better parameters. In most cases, RM1 yields results superior to both AM1 and PM3. The RM1 semiempirical quantum Table 1. The twenty three progestins (n = 23) used to build a QSAR model and the nine external validation set (E1-E9) that were never used to build the QSAR model. See Figure 1 for complete structural information
ID R1 R2 R3 R4 R5 R6 R7 Note
The 23 Progestins
1 CH3 H COCH3 H H H H
---2 CH3 H COCH3 OCOCH3 H H H
---3 CH3 H COCH3 OH H H H
---4 CH3 H COCH2OH H H H H
---5 CH3 H COCH3 H H H OH
---6 CH3 H COCH3 OCOCH3 H CH3 H
---7 CH3 H COCH3 OCOCH3 H Cl H ∆6,7
8 CH3 H COCH3 OCOCH3 H Cl H ∆6,7 and a cyclo-propyl ring
fused at C1 and C2
9 CH3 H OH H H H H
---10 CH3 H COCH3 H H H H Lack ∆4,5
11 CH3 H COCH3 H H H H ∆1,2
12 CH3 H COCH3 H H H H ∆6,7
13 H H COCH2CH3 CH3 H H H ∆9,10
14 H H COCH2OH H C2H5 H H
---15 H CH3 OH C≡CH H H H
---16 H H COCH3 H H H H
---17 H H OH C≡CH H H H
---18 H CH3 OH C≡CH H H =CH2
---19 H CH3 OH C≡CH H H H ∆15,16
20 H H OH CH2CH=CH2 H H H
---21 H H OH C≡CH H H H ∆5,10 and lack ∆4,5
22 H H OH H H H H
---23 H H OH CH3 H H H ∆9,10 and ∆11,12
The 9 External Set
E1 CH3 H COCH3 H H F H
E2 CH3 H COCH3 H H CH3 H
E3 CH3 H COCH3 H H OH H
E4 CH3 H OAc H H Cl H ∆6,7
E5 CH3 H OAc H H Cl H ∆6,7, 4-Cl
E6 CH3 H COCH3 H H H H 21-Cl
E7 CH3 H COCH3 H H H H 21-OH
E8 CH3 H COCH3 H H CH3 H ∆6,7
mechanical calculation produces physical properties related to the electronic structure of the molecule.
Molecular orbital energies and Mulliken atomic charges calculated by RM1 were employed as QSAR descriptors. The Kth level below the highest occupied molecular orbital (HOMO) and its energy is represented as HOMO-K, where K = 0,1,2,.., 30. Likewise, the Lth level above the lowest unoccupied molecular orbital (LUMO) and its energy is represented as LUMO+L, where L = 0,1,2,…,10. Energy separations between two adjacent molecular orbitals are calculated and denominated as “GAP”. For instance, GAP-10 is deined as the energy separation between the HOMO-9th orbital and the HOMO-10th orbital. The total number of GAP-M calculated was 28, i.e. M = 1,2,…,28.
Atomic charges on the seventeen carbon atoms of the steroid skeleton, heats of formation, electronic energies, and others were also used as descriptors. A total of 105 quantum mechanical descriptors for each molecule were generated. The software DRAGON21 was used to calculate
other types of descriptors. All the twenty descriptor blocks available in the package ranging from 0D to 3D descriptors in the program were selected for descriptor calculations. A total of 1664 molecular descriptors were calculated. The descriptors that had intercorrelation values greater than 0.9 were eliminated. This reduced the number of molecular descriptors to 245. Adding the 105 quantum mechanical descriptors and the 245 DRAGON-derived descriptors resulted in a total of 350 descriptors for each molecule. The software MobyDigs22 was used for descriptor selection and QSAR model building.
The set of the 23 progestins in Table 1 were divided into a training set and a test set. The training set consisted of 16 progestins, whereas the test set consisted of 7 progestins (1, 4, 10, 12, 15, 19, 20), chosen based on an even
distribution of the biological activity in these molecules. A three descriptor QSAR model was searched using a genetic algorithm (GA).23 In the genetic algorithm window, default values were used. A cross-validated correlation Table 2. Observed and calculated log RBA and values of the three selected descriptors, PW2, Mor15m and GAP-10 for the 23 progestins
ID** name Ref. log RBA*
Obs.
log RBA Calc.
PW2 Mor15m GAP-10/ eV
1# Progesterone 5 1.602 1.194 0.620 0.198 0.094
2 17-Acetoxyprogesterone 6 1.204 1.236 0.620 0.401 0.139
3 17-Hydroxyprogesterone 6 0.079 0.094 0.631 0.535 0.256
4# 21-Hydroxyprogesterone 6 1.049 0.954 0.612 0.424 0.246
5 11β-Hydroxyprogesterone 6 1.158 1.432 0.621 0.252 0.066
6 Methoxyprogesterone acetate 5 2.061 1.418 0.622 0.389 0.095
7 Chloromadinone acetate 7 1.975a 2.330 0.622 0.720 0.046
8 Cyproterone acetate 7 1.447b 1.228 0.629 0.852 0.187
9 Testosterone 6,8 –0.097 –0.009 0.624 0.227 0.246
10# 5β-Pregnane-3,20-dione 6 0.380 1.092 0.620 –0.046 0.048
11 1,4-Pregnadine-3,20-dione 6 1.318 1.502 0.620 0.341 0.086
12# 4,6-Pregnadine-3,20-dione 6 1.310 1.218 0.620 0.441 0.152
13 Promegestone (R5020) 5 2.000 2.075 0.604 0.673 0.206
14 16α-Ethyl-21-hydroxy-19-nor-4-pregnene-3,20-dione (Organon 2058)
5,9 2.544 2.557 0.597 0.454 0.133
15# Levonorgestrel 5 2.079 2.474 0.605 0.295 0.046
16 19-Norprogesterone 6,8 1.827 1.794 0.610 0.342 0.118
17 Norethisterone 10 1.866 1.542 0.615 0.267 0.099
18 3-Keto-desogestrel 10 2.827 2.534 0.607 0.523 0.079
19# Gestodene 10 2.799 2.249 0.605 0.277 0.074
20# 3-Keto-allylestrenol 7,9 1.886c 2.188 0.606 0.199 0.055
21 Norethinodrel 7 0.845d 1.476 0.615 0.445 0.153
22 19-Nortestosterone 6,8 0.944 0.827 0.613 0.369 0.243
23 Metribolone (R1881) 7 2.146e 2.111 0.625 0.945 0.112
*Conidence limits: a(1.906-2.035); b(1.322-1.544); c(1.775 -1.975); d(0.544 - 1.021); e(2.021 - 2.276); #The seven test set molecules; **The remaining 16
coeficient, q2, was selected as the itness function. As the criteria for descriptor selection, we choose descriptors that give the highest value of qext2, an external24 q2, for the seven compounds of the test set. This means that we searched for descriptors that result in a QSAR model that has the greatest predictive ability. In order to estimate true predictive power of the QSAR model, we compare the predicted and observed activities of the nine compounds of the external validation set (Tables 1 and 3) that were not used in the model development. The second Setubal Principle was satisied in this section.
Results and Discussion
Equation 1 is the best QSAR model obtained with three descriptors:
log RBA = –51.65 (± 20.77) PW2 + 1.740 (± 0.8910) Mor15m –
6.915 (± 2.797) (GAP-10) + 33.52 (± 12.69) (1)
where (n = 16; r2 = 0.866; s = 0.331; F = 25.94; p < 0.0001; q2 = 0.805; q2
boot = 0.723, SDEP = 0.346; SDEC =0.287; Kxx= 11.91; Kxy= 37.56; ∆K=25.65).
PW2 is the Randic path/walk shape index.25 It is among the topological descriptors and demonstrates that the quotient (Pi/Wi) of i-th path length (Pi) and walk length (Wi) of a molecule in graph theory can correlate many physicochemical properties of the molecule, such as density, critical pressure, molar refraction, heat of formation, steric interactions, entropy, and others. PW2 is deined as (P2/W2), the quotient of path length of 2 (P2) and walk length of 2 (W2). Since PW2 is expected to correlate many physicochemical properties of the progestins, PW2 should also correlate with its biological activity.
Mor15m is the 3D-MORSE (molecule representation of structures based on electron diffraction) code of signal 15, weighted with atomic masses. Methods such as X-ray and electron diffraction yield diffraction patterns from which the atomic coordinates are derived by mathematical transformations. Inversely, three-dimensional atomic coordinates can be transformed into a code by an equation similar to the one used in electron diffraction for preparing scattering carves. The intensity of scattered radiation, I(s), can be approximated by equation 2:
(2)
s = 0, …, 31.0 Å-1
where s measures the scattering angle, rij represents the distance between the ith and the jth atoms, A
i represents
the atomic properties of the ith atom, such as atomic mass, partial atomic charge, and others, and N is the number of atoms in the molecule. Values of equation 2 were calculated at 32 evenly distributed values of s in the range of 0-31Å-1 from the three-dimensional atomic coordinates of a molecule. These 32 values constitute the 3D-MORSE code of the three-dimensional structure of a molecule. The 3D-MORSE code allows the representation of the three-dimensional structure of a molecule by a ixed number of values.
As indicated earlier, GAP-10 is the energy separation between the HOMO-9th orbital and the HOMO-10th orbital. It conveys information concerning electronic structure of a molecule. But why GAP-10 is correlated with log RBA is not known.
The statistical parameters for equation 1 are: standard deviation error of prediction (SDEP), standard deviation
error in calculation (SDEC), while Kxx is the total correlation in the model predictors (x) and Kxy is the total correlation in the set given by the model predictors X plus the response Y. ∆K is the difference between Kxy and Kxx. Correlation coeficients, in parentheses, between two out of the three descriptors are PW2/Mor15m (0.219); PW2/GAP-10 (0.213); Mor15m/GAP-10 (0.275). The correlation coeficients are all less than 0.3. Correlation coeficients ( r ) between the Y-value and an individual descriptor that appears in equation 1 are −0.60(PW2),
−0.54(GAP-10) and +0.27(Mor15m) respectively. The degree of contribution of the two descriptors, PW2 and GAP-10, to the QSAR model is about the same. They are the most signiicant. PW2 and Mor15m are descriptors that are related to topology and 3D molecular geometry, while GAP-10 is related to electronic structure of the molecule. Since the correlation between PW2 and the Y-values is negative, the smaller the value of PW2 of a compound, the greater its biological activity. The same statement also applies to GAP-10 since it has negative correlations with the Y-values. In order to deine the applicability domain (AD) of the QSAR model (4th Setubal Principle), a Williams Plot (Figure 2) is presented. This plot contains both the training (open squares) and the test set (illed squares) compounds. All the compounds except one lie within the limit of AD. One test compound is outside the 3σ line, although it is close to the line and has been retained. Internal validation (5th Setubal Principle) resulted in one or more measures of robustness of the model parameters such as q2 (0.805), Y-scrambling (a(r2) = 0.111, b(q 2) = – 0.634) and internal predictability such as q2
co-linearity of the descriptors, the block of X variables, is low (Kx = 0.12). The difference in the correlation between the block of X variables plus the response Y (Kxy) and that of X (Kxx) is suficiently high (DK = 0.256). The value of q2
bootstrap is fairly close to q2 conirming the internal predictability and stability of the model. The difference between r2 and q2 is not large. In view of these observations, we conclude that the QSAR model of equation 1 is fairly robust.
External validation (6th Setubal Principle) refers to a validation exercise in which the chemical structures selected for inclusion in the validation (or test) set are different from those included in the training set. Our seven test set compounds among the original 23 molecules belong to the same chemical domain, as seen in the Williams plot (Figure 2). External validation for the set is accessed by q2
ext. The value of q2ext is 0.67, which is smaller than q2, but
not too much different. Thus the value of 0.67 for q2 ext is acceptable. The seven test set compounds for the external validation were used to select the best QSAR model, equation 1.
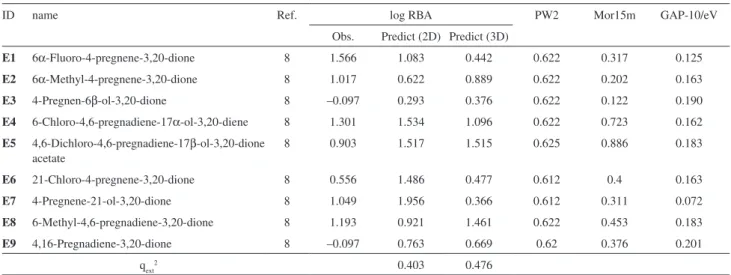
In order to asses true predictive power of the QSAR model (equation 1), we calculated log RBA values of the nine compounds of the external validation set that were not used in the model development. The predicted values are listed in the column designated as “Predict (2D)” in Table 3. The value of q2
ext for the validation set was 0.403 (Table 3) which is lower than 0.67 that was obtained with the test set of the seven molecules.
The leave-one-out variance q2 has sometimes been demonstrated to be too optimistic in evaluating prediction ability of regression models. Todeschini et al.26 proposed
a set of more severe validation criteria than q2 using RQK itness functions (Table 4).
Comparison of the last two columns of Table 4 reveals that our QSAR model (equation 1) satisies all ive of the Todeschini criteria. Figure 3 shows a plot of the calculated log RBA against the observed values.
The nature of the three selected descriptors, PW2, GAP-10 and Mor15m, does not permit one to draw a clear mechanistic interpretation (3rd Setubal Principle). However, the 3D QSAR method is expected to provide a mechanistic interpretation. Physicochemical interpretation of a 3D QSAR model is straightforward as only two kinds of descriptors, steric and electrostatic interactions, are employed. 3D QSAR was performed using the software ToMoCo,27 which employs a grid approach.28 The grid approach attempts to establish a relationship between the biological activities and the steric/electrostatic properties between a set of compounds. A superposition rule for these compounds is deined. The steric and electrostatic Figure 2. Williams plot. The plot contains both the training set (open
squares) and the test set (illed squares) compounds.
Table 3. Observed and two set of predicted log RBA’s , irst by equation 1 (2D QSAR), and second, by the 3D QSAR, and values of the three selected descriptors, PW2, Mor15m and GAP-10 for the external set of the nine progesntins (E1-E9)
ID name Ref. log RBA PW2 Mor15m GAP-10/eV
Obs. Predict (2D) Predict (3D)
E1 6α-Fluoro-4-pregnene-3,20-dione 8 1.566 1.083 0.442 0.622 0.317 0.125
E2 6α-Methyl-4-pregnene-3,20-dione 8 1.017 0.622 0.889 0.622 0.202 0.163
E3 4-Pregnen-6β-ol-3,20-dione 8 –0.097 0.293 0.376 0.622 0.122 0.190
E4 6-Chloro-4,6-pregnadiene-17α-ol-3,20-diene 8 1.301 1.534 1.096 0.622 0.723 0.162
E5 4,6-Dichloro-4,6-pregnadiene-17β-ol-3,20-dione acetate
8 0.903 1.517 1.515 0.625 0.886 0.183
E6 21-Chloro-4-pregnene-3,20-dione 8 0.556 1.486 0.477 0.612 0.4 0.163
E7 4-Pregnene-21-ol-3,20-dione 8 1.049 1.956 0.366 0.612 0.311 0.072
E8 6-Methyl-4,6-pregnadiene-3,20-dione 8 1.193 0.921 1.461 0.622 0.453 0.183
E9 4,16-Pregnadiene-3,20-dione 8 –0.097 0.763 0.669 0.62 0.376 0.201
interaction energies with a probe atom of each compound are calculated at each grid point in the grid box spanning 3D space. Atomic charges were calculated with the PM3 method as is required with ToMoCo. They were used for calculation of electrostatic ield values. Carbon atoms with sp3 conigurations and +1 charge were used as probes. 3D QSAR was performed twice, irst to evaluate predictive power of the 3D QSAR, second to produce 3D grid ield for analysis and ligand construction. In the irst 3D QSAR modeling, exactly the same training set of the sixteen compounds (Table 2) as the one used previously for 2D QSAR modeling was employed. Four carbons, C1 to C4, were used to superimpose the set of molecules. The average RMS error of the superposition was 0.0514 Å. The lattice interval of the grid box was chosen to be 1.0 Å. There were 4256 lattice points in the box. VDW and electrostatic ield values were calculated with this box. A 3D QSAR model was constructed using PLS with eleven components. The resulting values of r2 and q2 were 1.000 and 0.959, respectively. The 3D QSAR model was used to predict log RBA’s of the nine external validation compounds and listed in Table 3 in the column marked as “Predict (3D)”. The value of qext2 obtained is 0.476 which can be compared with the corresponding value of 0.403
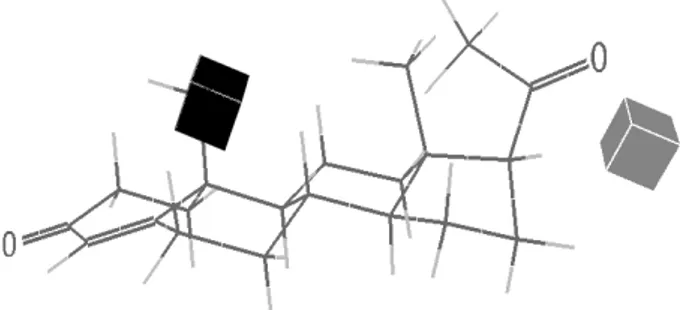
obtained with 2D QSAR , equation 1. The 3D QSAR model has slightly better predictive power than 2D QSAR for the type of compounds and the type of biological activity that we are dealing. In the second 3D QSAR modeling, the whole set of the 23 geometry optimized molecules with the Y-values (biological activities), Tables 1 and 2, were entered into ToMoCo. The lattice interval of the grid box was chosen to be 1.0 Å. There were 6048 lattice points in the box. A 3D QSAR model was constructed using PLS with seven components from which q2 took its maximum value. The resulting values of r2 and q2 were 0.962 and 0.678, respectively. The model gave Figure 4, which shows a graphical representation in cube format for the grid points associated to the larger regression coeficients of the PLS model.
There are some gray cubes closely packed on the
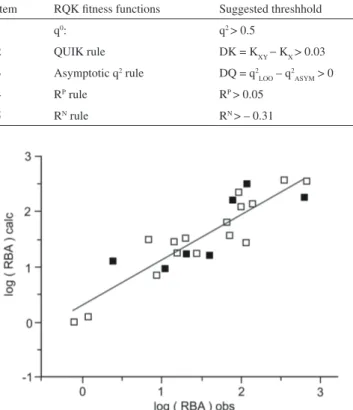
β-side of the A-ring of the steroid skeleton. A gray cube corresponds to a negative regression coeficient. It implies that if there is an atom or a group of atoms in the region where the gray cubes are located, the Y-value (binding affinity) of the molecule will decrease. Williams and Sigler29 published an atomic structure of progesterone complexed with its receptor. Their Figures 2a and 2b show that it is the A-ring side of progesterone that establishes a close contact with the progesterone-binding pocket. If a progestin has a (large) substituent that occupies β-side of A-ring, it will block its entrance to the binding pocket and Table 4. RQK itness functions, their thresholds, as suggested by Todeschini et al.26 as criterion for validation of a QSAR model, and their corresponding
values obtained from the QSAR model shown in equation 1
Item RQK itness functions Suggested threshhold Parameter values produced by QSAR model, equation 1
1 q0: q2 > 0.5 q2 = 0.805
2 QUIK rule DK = KXY − KX > 0.03 DK = 0.256
3 Asymptotic q2 rule DQ = q2
LOO – q2ASYM > 0 DQ = 0.043
4 RP rule RP > 0.05 RP = 0.248
5 RN rule RN > – 0.31 RN = 0
Figure 3. Graph of calculated log RBA against observed values. The graph contains both the training set (open squares) and the test set (illed squares) compounds.
its binding afinity will decrease. On the other hand, if a progestin has no substituent on the β-side of the A-ring, this will permit its entrance into the binding pocket and binding afinity will increase. This is what we observe in majority of progestins (compounds 13-23 in Tables 1 and 2)
that have no β-CH3 at C10 in the A-ring.
There is a black cube located outside of C17 of the D-ring of the steroid. A black cube corresponds to a positive regression coeficient. If there is a bulky substituent in the region where the black cube is located, the Y-value will increase. Figure 2a of Williams and Sigler27 shows the existence of open space in external region of the D-ring. If there were bulky substituents at C17 of the D-ring stretching towards the empty space, it would help stabilize the steroid, contributing to an increase of binding afinity (see progestins 6,7,20).
Figure 5 shows a graphical representation in cube format for the grid points associated with the larger regression coeficients of the PLS model obtained for electrostatic interaction. There is a black cube on β-CH3 at C10 in A-ring. The black cube corresponds to a positive regression coeficient. If there are positive substituents in the region where the black cube is located, the Y-value (binding afinity) of the molecule will increase. Substitution of the β-CH3 at C10 with β-H usually increases the Y-value, as is the case of progestins 13, 14, 15…18, 19, 20.
There is a gray cube on the α-side of C17 in the D-ring. A gray cube represents a negative sign. If there is negative substituents in the region where the gray cube is located, the Y-value (binding afinity) of the molecule will increase. Some progestins have ethynyl (C≡CH) at α-C17. Ethynyl is an electron rich radical that can be considered a negative substituents. Progestins 15, 18, and 19 have ethynyls at
α-C17 and they have high Y-values. Thus the 3D QSAR has helped to provide a mechanistic interpretation (third Setubal Princple).
Figure 5. A graphical representation in cube format for the grid points associated with the larger regression coeficients of the PLS model obtained for electrostatic interactions, with positive effects in black and negative ones in gray.
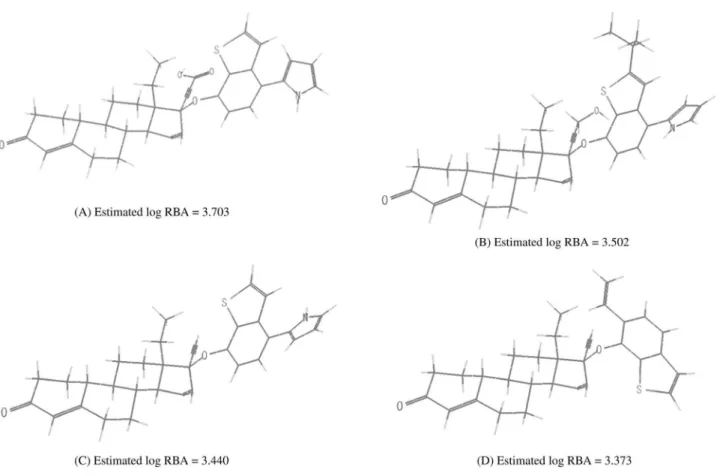
The analyses of Figures 4 and 5 suggest that new progestins should be modeled by substituting some of hydrogen atoms in the D-ring of the molecule with appropriate substituents. ToMoCo has a package called “LigConstructor” with which one can model new chemical structures. Gestodene (19) was selected as a
“seed”, because it is one of the most potent progestins and a typical one. A seed molecule is a starting molecule from which a new molecule is modeled, with the aim of designing potential progestins that could be more potent than gestodene. The ield that gave Figures 4 and 5, plus the seed molecule, were used as input for LigConstructor. Figure 6 shows the four progestins, (A)-(D), that were
modeled.
The estimated log RBA activity values of the four are: (A) 3.703; (B) 3.520; (C) 3.440; (D) 3.373. The log RBA
value of gestodene is 2.799. The most potent progestin in Table 2 is 3-keto-desogestrel (18) that has a log RBA
value of 2.827. The activities of the four newly modeled progestins are all greater than 3-keto-desogestrel (18), the
most potent in Table 2. If progesterone (1) is taken as a
reference molecule, 3-keto-desogestrel (18) is 17 times
more potent than progesterone (1), the newly modeled
progestins (A-D) are estimated to have potencies, 126
times (A), 83 times (B), 69 times (C) and 59 times (D)
greater than progesterone (1). A would be 8 times more
potent than 18, the most potent in Table 2. There is no
guarantee that the newly modeled progestins, (A)-(D),
really would have the estimated activity values. Equation 1 (the 2D-QSAR model) was invoked to predict log RBA values of the four new compounds. The predicted values are; (A) 3.586 (3.703), (B) 3.898(3.502), (C) 3.466(3.440),
(D) 2.669 (3.373). The value in parenthesis is log RBA
value predicted by the 3D-QSAR model. The 2D and 3D QSAR models predicted almost the same activity values for the compound (C). The two QSAR models predicted
improved values for (A) and (B). For compound (D), the
two models predicted somewhat different activity values. Both the 2D and 3D QSAR models predicted improved log RBA values for (A)-(C). This might be an indication
that the three compounds, (A)-(C), would have higher
Figure 6. Four proposed progestins, (A) - (D), whose receptor binding afinity activities (log RBA) are greater than 3-keto-desgestrel, the most potent progestin in Table 2. The six-member ring in the substituent at C17α is phenyl ring.
Conclusions
2D QSAR analysis of the binding afinity of a set of 23 progestins to human cytosol receptor proteins was performed. It was shown that the QSAR model satisies ive out of the six Setubal (OECD) Principles. The only principle that the 2D QSAR model does not satisfy is mechanistic interpretation, which was carried out using a 3D QSAR methodology, resulting in graphical representations in cube format for the grid points associated with the larger regression coeficients of the PLS model obtained for steric and electrostatic interactions. Thus, it was demonstrated that a combination of 2D and 3D analysis enables one to satisfy all the six Setubal Principles. Based upon the information obtained from the 3D QSAR analysis, four new progestins were constructed, whose receptor binding activities are estimated to be several times more potent than the most potent progestin listed in Table 2.
Acknowledgments
The authors thank professors Carol H. Collins and Fred Y. Fujiwara of Universidade Estadual de Campinas - Unicamp for english revision and professors Alberto dos
S. Marques and José Luis de Souza Pio of Universidade do Estado do Amazonas, Rogerio Custodio and Marcia M. C. Ferreira of UNICAMP for constructive comments. We acknowledge the Conselho Nacional de Desenvolvimento Cientíico e Tecnológico (CNPq) and the Fundação de Amparo à Pesquisa do Estado de São Paulo (FAPESP) for inancial support.
References
1. Solomons, T. W. G.; Fryhle, C. B.; Organic Chemistry, 8th ed., John Wiley & Sons,. Inc.: New York, 2004. ISBN: 978-0-471-41799-6
2. http://en.wikipedia.org/wiki/Progestin, accessed in February 2009.
3. Loose, D. S.; Stancel, G. M. In Goodman & Gilman’s The
Pharmacological Basis of Therapeutics, 11th ed.;Brunton, L.
L.; Lazo, J. S.; Parker, K. L., eds.; McGraw-Hill: New York, 2004, pp. 1541-71. ISBN 0-07-142280-3.
4. Fortherby, K.; Caldwell, A. D. S.; Contraception1994, 49, 1. 5. Juchem, M.; Pollow, K.; Am. J. Obstet. Gynecol.1990, 163,
2171.
6. Blanford, A. T.; Wittman, W.; Stroupe, S. D.; Westphal, U.;
7. Bergink, E. W.; Meel, F. V.; Turpijin, E. W.; Vies, J. V.; J. Steroid Biochem. Mol. Biol. 1983, 19, 1563.
8. Smith, H. E.; Smith, R. G.; Toft, D. O.; Neegaard, J. R.; Burrowa, E. P.; O’Malley, B. W.; J. Biol. Chem. 1974, 249, 5294.
9. Bergink, E. W.; Loonen, P. B. A.; Kloosterboer, H. J.; J. Steroid
Biochem. Mol. Biol.1985, 23, 165.
10. Kloosterboer, H. J.; Vonk-Noordegraaf, C. F; Turpijin, E. W.;
Contraception1988, 38, 325.
11. McRobb, L.; Handelsman, D. J.; Kazlauskas, R.; Wilkinson, S.; McLeod, M. D.; Heather, A. K.; J. Steroid Biochem. Mol. Biol.2008, 110, 39.
12. Saha, A.; Roy, K.; De, K.; Sengupta, C.; Indian J. Chem.2002,
41B, 1268.
13. Kier, L. B.; Hall, L. H.; Pharm. Res.1990, 7, 801.
14. Gramatica, P.; QSAR Comb. Sci.2007, 26, 694.
15. http://ecb.jrc.ec.europa.eu/qsar/background/index. php?c=OECD, accessed on July 2009.
16. Coburn, R. A.; Solo, A. J.; J. Med. Chem.1976, 19, 748;
Schulte-Hermann, R.; Ochs, H.; Bursch, W.; Parzefall, W.; Cancer Res.
1988 , 48, 2462.
17. Bursi, R.; Groen, M. B.; Eur. J. Med. Chem.2000, 35, 787. 18. log RBA values: (ID) correct (wrong): (10) 0.380 (0.778); (11)
1.318 (1.716); (12) 1.310(1.708); (17) 1.866 (1.426); (18) 2.827 (1.426); (19) 2.799 (2.493).
19. Rocha, G. B.; Freire, R. O.; Simas, A. M.; Stewart. J. J. P.;
J. Comput. Chem.2006, 27, 1101.
20. Hypercube, Inc., 1115 NW 4th st., Gainesville, FL, 32608, USA. 21. DRAGON for Windows and Linux 2006, Talete Srl, Milano,
Italy.
22. MobyDigs, Version 1-2004, Talete srl, Milano, Italy.
23. Goldberg, D. E.; Genetic Algorithms in Search, Optimization
and Machine Learning, Addison-Wesley: Indianapolis, 1989.
24. Tropsha, A.; Gramatica, P.; Gombar, V. K.; QSAR Comb. Sci.
2003, 22, 69.
25. Randic, M.; J. Chem. Inf. Compt. Sci.2004, 41, 607. 26. Todeschin, R. ; Consonni, V.; Mauri, A.; Pavan, M.; Anal. Chim.
Acta2004, 515, 199.
27. ToMoCo-The Total System for Molecular Designs by the Computer Aided Chemisty Laboratory Version. 1.3, ChemInfonavi: Japan.
28. Cramer III, R. D.; Patterson, D. E.; Bunce, J. D.; J. Am. Chem. Soc.1988, 110, 5959.
29. Williams S. P.; Sigler, P. B.; Nature1998, 393, 392.
Received: April 16, 2009
Web Release Date: February 11, 2010