Article
J. Braz. Chem. Soc., Vol. 22, No. 9, 1782-1787, 2011. Printed in Brazil - ©2011 Sociedade Brasileira de Química 0103 - 5053 $6.00+0.00
A
*e-mail: [email protected]
Simultaneous Determination of Hydride and Non-Hydride Forming Elements by
Inductively Coupled Plasma Optical Emission Spectrometry
Z. Benzo,a,b M. N. Matos-Reyes,a M. L. Cervera*,a and M. de la Guardiaa
aDepartment of Analytical Chemistry, University of Valencia, 50th Dr. Moliner Street,
46100 Burjassot, Valencia, Spain
bInstituto Venezolano de Investigaciones Cientíicas, IVIC, Carretera Panamericana, km 11,
Altos de Pipe, 1020-A Caracas, Venezuela
Foram estudadas as características de funcionamento de um sistema de nebulização duplo e as condições químicas para a geração de hidretos, assim como as iguras de mérito para os elementos formadores e não formadores de hidretos. Foi caracterizado o desempenho analítico do sistema de nebulização pelos limites de detecção de 0,002 até 0,0026 µg mL-1 para os elementos formadores de
hidretos e entre 0,0034 e 0,0121 µg mL-1 para os elementos não formadores de hidretos, o desvio
padrão relativo para 10 replicatas ao nível de 0,25 mg mL-1 e percentagens de recuperação entre
97 e 103%. A aplicabilidade do sistema foi demonstrada na determinação simultânea de Ca, Cd, Co, Cr, Cu, Fe, Mg, Mn, Mo, Ni, Zn, As, Bi, Sb, Se e Te em amostras certiicadas para elementos traços, NIST 1549 (leite em pó desnatado), NIST 1570a (folhas de espinafre), DORM-2 (músculo de cação) e TORT-2 (hepatopâncreas de lagosta). Os resultados obtidos foram concordantes com os teores certiicados.
The operating characteristics of a dual nebulization system were studied including instrumental and chemical conditions for the hydride generation and analytical igures of merit for both, hydride and non hydride forming elements. Analytical performance of the nebulization system was characterized by detection limits from 0.002 to 0.0026 µg mL-1 for the hydride forming elements
and between 0.0034 and 0.0121 µg mL-1 for the non-hydride forming elements, relative standard
deviation for 10 replicate measurements at 0.25 mg L-1 level and recovery percentages between
97 and 103%. The feasibiity of the system was demonstrated in the simultaneous determination of Ca, Cd, Co, Cr, Cu, Fe, Mg, Mn, Mo, Ni, Zn, As, Bi, Sb, Se, and Te in the NIST 1549 (non-fat milk powder), NIST 1570a (spinach leaves), DORM-2 (dogish muscle) and TORT-2 (lobster hepatopancreas) certiied samples for trace elements. Results found were in good agreement with the certiied ones.
Keywords: hydride, non-hydride elements, simultaneous determination, online hydride generation, ICP OES
Introduction
Chemical vapour generation (CVG) coupled to atomic absorption spectrometry (AAS), atomic fluorescence spectrometry (AFS), inductively coupled plasma optical emission spectrometry (ICP OES) and inductively coupled plasma mass spectrometry, (ICP-MS) is a commonly used way for improving the sensitivity and selectivity of the
determinations.1,2
The simultaneous determination of hydride forming and non hydride forming elements was irst reported by
Wolnick et al.3 The tandem nebulization system employed
consisted in a Meinhard concentric glass nebulizer mounted in a polytetrafluorethylene spray chamber directly joined to a cross-flow nebulizer fitted to a cylindrical glass spray chamber connected to the ICP torch. In a recent
paper4 the historical development of dual mode sample
Gomez et al.5 used a dual sample introduction system
which consists of a crossflow nebulizer and concentric conventional Meinhard pneumatic nebulizer connected to the conventional double-pass spray chamber of the ICP OES instrument using a simple T-shaper adaptor.
Asfaw and Wibetoe6 developed a procedure for the direct
analysis of beer, instant coffee and milk by ICP OES for the determination of Se and Ca, Mg, K, P, S and Zn. Selenium, introduced as hydride, was determined simultaneously with the other non-hydride-forming elements using the commercial multi-mode sample introduction system
(MSIS) which was also used by Wiltsche et al.7 for the
multielemental analysis in high alloy steels and nickel alloys using axially viewed hydride generation ICP OES.
On the other hand, Benzo et al.8 employed a system which
consists of two commercial conventional concentric nebulizers coupled to a modiied cyclonic chamber for the determination of As, Be, Cd, Co, Cr, Cu, Fe, Mg, Mn, Mo, Ni, Pb, Se, Sb, Sr, V and Zn. The system provided a convenient means of determining elements, either by nebulisation or hydride generation or simultaneously in the same device without suffering losses during
the time. Matusiewicz and Slachcinsky9 used a MSIS
nebulizer system in microwave induced plasma optical emission spectrometry (MIP-OES) for the simultaneous determination of some hydride forming elements (As, Bi, Ge, Sb, Se, and Sn), volatile vapors (Hg) and conventional elements (Ca, Fe, Mg, Mn, and Zn) using slurry sampling. This approach retains the multi-element capability of OES detection with simultaneous determination under compromised experimental conditions of various hydride forming elements and mercury and non-hydride forming
elements. In a previous paper,10 it was demonstrated that
the simultaneous determination of Sb, Sn, V and Zn can be made by CVG-ICP OES with a homemade designed dual nebulizer without any further instrumental change. The system was constructed from simple, commercially available equipments. The full versatility of this system was exploited by simultaneous optimization of operating and hydride reaction conditions for the four aforementioned elements, being evidenced its dual potential beneit in ICP OES.
The goal of the present work has been the development of a multielemental method based on the simultaneous determination of Ca, Cd, Co, Cr, Cu, Fe, Mg, Mn, Mo, Ni, and Zn (non-hydride forming elements), and As, Bi, Sb, Se, and Te (hydride forming elements) using a dual nebulizer and online hydride generation, with axial view ICP OES which has been evaluated based on the accuracy obtained for the analysis of different reference materials.
Experimental
Instrumentation
A dual viewed ICP OES instrument, Perkin Elmer, Model Optima 5300 DV spectrometer (Norwalk, CT, USA) used in the axial viewing mode, equipped with an autosampler AS 93-plus and the new dual nebulizer developed in other research laboratory was used throughout this work. Argon C-45 (purity higher than 99.995%) supplied by Carburos Metalicos (Barcelona, Spain) was employed as plasmogen. The operating conditions of the ICP OES equipment are summarized in Table 1.
Table 1. Instrumental and hydride generation conditions for ICP OES determination of hydride and non-hydride forming elements
Parameter Value
Instrumental
RF power 1300 W
Gas Argon
Plasma gas flow rate 16 L min-1
Auxiliary gas flow rate 0.2 L min-1
Nebulizer gas flow rate 0.8 L min-1
Sample aspiration rate 1.1 mL min-1
View Axial/radial
Background correction 3-Point
Sample introduction interface Modiied cross-flow nebulizer itted to a double pass spray chamber
Number of replicates 3
Hydride generation
HCl concentration 6 mol L-1
HCl flow rate 0.5 mL min-1
NaBH4 concentration (in 0.4%, m/v, NaOH) 1.5% (m/v)
NaBH4 flow rate 0.5 mL min-1
Emission lines / nm
As 188.979
Bi 223.061
Ca 317.933
Cd 228.802
Co 228.616
Cr 267.716
Cu 327.393
Fe 230.204
Mg 285.213
Mn 257.610
Mo 202.031
Ni 231.604
Sb 206.836
Se 196.026
Te 214.281
A microwave laboratory system, Ethos SEL from Milestone (Sorisole, Italy), equipped with a thermocouple probe, for automatic temperature control, and an automatic gas leaks detector, with a maximum power of 1000 W, was employed for sample digestion. The system was equipped with 10 vessels of 100 mL inner volume. For cleaning the vessels, an automatic cleaning device trace clean from Milestone was used. Additionally, a 9 L volume ultrasound water bath, from Selecta (Barcelona, Spain), with 50 W power and 50 Hz frequency was employed for sample sonication.
Reagents and solutions
A multi-element standard of 100 mg L−1 from Scharlau
(Barcelona, Spain) containing all the elements studied was used as stock solution. Nitric acid (65% m/m) and hydrogen peroxide (30% m/m) were obtained also from Scharlau. All working standard solutions were prepared daily from the stock solution by simple dilution with Milli-Q ultrapure water in a nitric acid medium at 3% (v/v) level. Ultrapure water was obtained with a Millipore (Milford, MA, USA) Milli-Q water puriication system.
Certified reference materials NIST 1549 (non-fat milk powder) and NIST 1570a (spinach leaves), obtained from the National Institute of Standards and Technology (Gaithersburg, MD, USA), DORM-2 (dogish muscle) and TORT-2 (lobster hepatopancreas) materials obtained from the National Research Council of Canada (Ottawa, ON, Canada) were used to test the accuracy of the developed procedure. A commercial milk sample was used for the evaluation of matrix interferences and milk commercial samples were digested in the microwave system.
Sample preparation
An aliquot of 4.0 mL of milk was transferred inside a
Teflon vessel and it was accurately weighed. 6.0 mL HNO3
and 2.0 mL H2O2 were added. The reactor was closed and
it was placed inside the microwave oven and the following program was run: step 1, 20 min to reach 150 ºC; step 2, 10 min to reach 200 ºC; step 3, 10 min at 200 ºC; and step 4, cooling down. After cooling, the vessels were opened and they were put in an ultrasound water bath for 30 min, in order to eliminate the nitrous oxide fumes, till to obtain completely clear digests and then transferred to 50 mL tubes with deionized water and diluted to a inal volume of 25 mL.
The certiied reference materials NIST SRM 1549, NIST 1570a, DORM-2 and TORT-2 were digested (0.5 g
of each SRM) in a microwave oven using 4 mL H2O,
6 mL HNO3 and 2 mL H2O2. The certiied materials were
prepared in independent triplicates. The heating program was the same previously described.
Analytical procedure
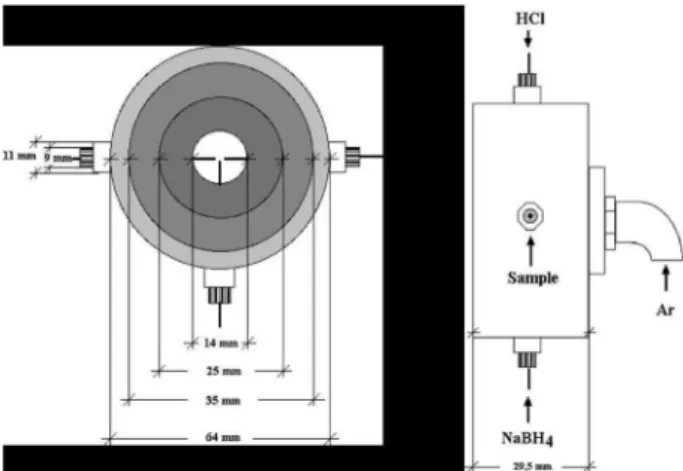
The nebulization system is based on a cross-flow
nebulizer prototype,10 in which two introduction channels,
perpendicular to the sample introduction one, were incorporated (see Figure 1). The two new channels permit
the introduction of HCl and NaBH4 solutions. The sample,
the acid and sodium borohydride solutions were mixed at a merging point just before nebulization. This system was coupled with a conventional Scott double-pass spray chamber. Two peristaltic pumps were used: one to deliver the acid and the second to deliver the sodium borohydride solution. Sample delivering was carried out by the instrument autosampler. The two peristaltic pumps of the
hydride generation system (HCl and NaBH4) were operated
in continuous flow mode combined with the autosampler peristaltic pump, which controls the drain in order to avoid pressure differences and eventually, plasma extinction. Chemical conditions for the hydride generation used in this
work were already studied in a previous paper.11
Results and Discussion
Plasma stability
For evaluation of plasma short-term stability, it was monitored the response of each analyte from a solution
containing 0.25 mg L-1 of each one of the elements studied.
Short-term stability was expressed as the relative standard deviation (RSD) of fluctuations in the emission signal around a mean value from a series of 10 replicates. The precision was almost equal or better than 10% indicating a high repeatability and short-term stability. Results are shown in Table 2.
Matrix effect and internal standardization
The slopes of the aqueous calibration curves prepared in nitric acid medium at 3% (v/v) level and those obtained by the standard addition on a digested milk sample, diluted 2.5 and 5 times, were compared in order to asses the presence of
signiicant matrix effects (Table 3). The t-test was applied to
the sensitivity values obtained for all considering elements at the two dilution levels considered. It was obtained values
of tcal of 8.004 and −0.038 for dilution at 2.5 and 5 times,
respectively. In the irst case it was demonstrated that tcal = 8.004 > t(n = 32, 95%) = 2.042. Sensitivity values obtained
from 5 times diluted digested milk samples indicate the absence of matrix effects, evidenced by the similarity between calibration solutions and standard addition ones (tcal = −0.038 > t(n = 32, 95%) = 2.042).
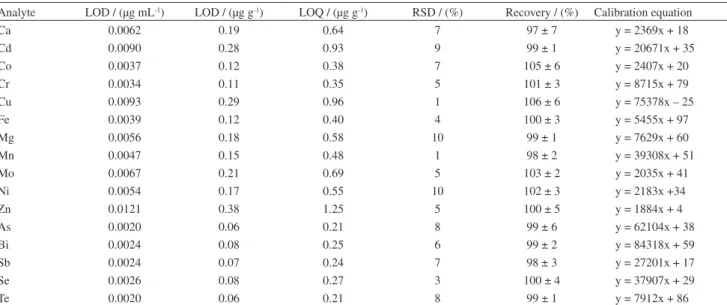
The choice of an internal standard was made by evaluating the proile of the analytical signals of the Table 2. Figures of merit of ICP OES determination of hydride and non-hydride forming elements using a dual nebulizer
Analyte LOD / (µg mL-1) LOD / (µg g-1) LOQ / (µg g-1) RSD / (%) Recovery / (%) Calibration equation
Ca 0.0062 0.19 0.64 7 97 ± 7 y = 2369x + 18
Cd 0.0090 0.28 0.93 9 99 ± 1 y = 20671x + 35
Co 0.0037 0.12 0.38 7 105 ± 6 y = 2407x + 20
Cr 0.0034 0.11 0.35 5 101 ± 3 y = 8715x + 79
Cu 0.0093 0.29 0.96 1 106 ± 6 y = 75378x – 25
Fe 0.0039 0.12 0.40 4 100 ± 3 y = 5455x + 97
Mg 0.0056 0.18 0.58 10 99 ± 1 y = 7629x + 60
Mn 0.0047 0.15 0.48 1 98 ± 2 y = 39308x + 51
Mo 0.0067 0.21 0.69 5 103 ± 2 y = 2035x + 41
Ni 0.0054 0.17 0.55 10 102 ± 3 y = 2183x +34
Zn 0.0121 0.38 1.25 5 100 ± 5 y = 1884x + 4
As 0.0020 0.06 0.21 8 99 ± 6 y = 62104x + 38
Bi 0.0024 0.08 0.25 6 99 ± 2 y = 84318x + 59
Sb 0.0024 0.07 0.24 7 98 ± 3 y = 27201x + 17
Se 0.0026 0.08 0.27 3 100 ± 4 y = 37907x + 29
Te 0.0020 0.06 0.21 8 99 ± 1 y = 7912x + 86
LOD and LOQ values were established using a 0.5 g sample mass; RSD values were established from 10 replicate analysis at 0.25 mg L-1 level. Recovery
percentages correspond to a milk sample spiked at 0.25 µg mL-1 level. Values are the mean ± the standard deviation of three replicate analysis. Concentration
values in the calibration lines (x) were in mg L-1.
Table 3. Sensitivity values obtained from external and standard addition calibration with dilution factors of 2.5 and 5
Element External Standard addition with
2.5 dilution factor r1
Standard addition with 5
dilution factor r2
Ca 2369 ± 91 5739 ± 19 2.42 4409 ± 25 1.86
Cd 20671± 101 27547 ± 22 1.33 17765 ± 94 0.86
Co 2407 ± 25 4215 ± 10 1.75 2056 ± 17 0.85
Cr 8715 ± 48 1498 ± 28 0.17 6709 ± 31 0.77
Cu 75378 ± 118 4209 ± 34 0.06 48714 ± 101 0.65
Fe 5455 ± 44 954 ± 17 0.17 6073 ± 40 1.11
Mg 7629 ± 37 14192 ± 57 1.86 8397 ± 41 1.10
Mn 39308 ± 95 6521± 33 0.17 35957 ± 87 0.91
Mo 2035 ± 18 331 ± 13 0.16 1473 ± 21 0.72
Ni 2183 ± 29 407 ± 21 0.19 1855 ± 30 0.85
Zn 1884 ± 15 459 ± 14 0.24 1551 ± 24 0.82
As 62104 ± 85 3660 ± 51 0.06 66571 ± 70 1.07
Bi 84318 ± 106 9376 ± 58 0.11 87040 ± 81 1.03
Sb 27201± 79 779 ± 11 0.03 25216 ± 73 0.93
Se 37907 ± 63 2255 ± 61 0.06 29858 ± 56 0.79
Te 7912 ± 24 2732 ± 47 0.35 6210 ± 18 0.78
Sensitivity values (mean ± standard deviation) expressed in counts per µg mL-1; r
1 = slopestandard addition with 2.5 dilution/ slopeexternal calibration;
elements considered, in presence of Sc and Ru. To evaluate the internal standard performance, the slopes of the calibration curves for each analyte in the presence of 0.5
and 1.0 mg L−1 of Sc and Ru, respectively, were compared
(results not shown). It was observed that slightly better correction was obtained using Ru as internal standard. Therefore, Ru was adopted throughout this work.
Figures of merit
The limit of detection values for each element under
study were calculated in µg mL-1, based on three times
the standard deviation of the average of 10 readings of a
multielemental standard solution of 0.25 µg mL-1 level,
divided by the slope of the respective calibration curve.
Limit of detection values were also established in µg g-1
taking into account the sample mass, as well as the limits of quantiication (10 times the standard deviation). Data are listed in Table 2 and it can be seen that the system provides a high sensitivity and low detection limits for most studied elements. In order to compare the limits of detection obtained by dual-mode sample-introduction systems for simultaneous measurement of hydride and non-hydride forming elements, Table 4 is also included. This table shows that the limits of detection achieved for hydride-forming elements are within the range of those reported,
except for analytes such as As, Sb and Se.12 What is equally
important is that the limits of detection obtained for the non-hydride forming elements commonly correspond to those obtained with others reported systems or few are somewhat improved. The exception was Zn, whose limit of detection was high.
Recovery studies
Recovery studies were carried out by spiking a digested milk sample with a multielemental standard solution at
0.25 µg mL-1 level.Recovery percentages were in the range
from 97 to103%, as listed in Table 2.
Accuracy studies
Method accuracy was evaluated by quantiication of trace elements in a certiied reference material, NIST 1549 (non-fat milk powder). Considering that other available reference materials may contain potential interferences similar to those of milk samples, NIST 1570a (spinach leaves), DORM-2 (dogish muscle) and TORT-2 (lobster hepatopancreas) were also analyzed in order to get a wider application of the method. In general terms, statistically comparative values were found between data obtained and those certiied for both, hydride and non-hydride forming elements. Table 5 reports the aforementioned data, also indicating as a footnote the statistical t-test applied for each reference material.
Table 4. Limits of detection for hydride and non-hydride forming elements obtained with ICP OES using simultaneous hydride generation (HG) and pneumatic nebulization (PN) with different dual-mode sample-introduction systems, limits of detection obtained for PN alone in the same systems are given in parentheses4
Element Tandem nebulization /
(ng mL-1)
Modiied nebulizers / (ng mL-1)
Modiied spray chambers / (ng mL-1)
This work / (ng mL-1)
Ca 6.0-25 (20.0) - 0.5 (0.2) 6.2
Cd 1.3-9.0 (2.0-4.0) 3.0 0.5-4.1 (1.2-1.9) 9.0
Co 3.0-4.4 (4.0-5.0) - 0.6-8.0 (0.3-5.0) 3.7
Cr 3.0-5.9 (4.3-9.0) 6.0 0.9-3.2 (1.2-5.6) 3.4
Cu 3.3-70 (2.0-3.0) 11 1.2-10 (1.5-3.0) 9.3
Fe 3.6-6.0 (4.0-14.0) - 0.7-6.8 (0.4-4.6) 3.9
Mg 1.0-3.0 (1.0-1.7) 3.9 0.5-19 (0.5-2.0) 5.6
Mn 0.7-3.0 (1.1-2.0) 2.0 0.1-1.0 (0.04-1.3) 4.7
Mo 5.0-13.0 (7.0-14.0) - 1.5-8.7 (1.3-12) 6.7
Ni 6.0-8.4 (10) 6.0 0.7-11 (0.4-16.0) 5.4
Zn 1.0-7.0 (1.5-7.0) 3.0-4.7 1.5-9.0 (2.3-6.8) 12.1
As 2.2-5.3 (20.0-160.0) 0.4 (50.0) 0.4-7.5 (3.4-130.0) 2.0
Bi 0.9 (40) - 0.4-4.6 (2.7-50.0) 2.4
Sb 0.7-19 (20.0-2700.0) 0.5-2.0 (70.0) 0.1-8.3 (5.0-180.0) 2.4
Se 0.5-10.0 (20.0-260.0) 0.1 (53.0) 0.3-3.4 (7.4-100.0) 2.6
The regression between obtained results (y) and
certiied ones (x) provide an equation y = (1.00 ± 0.14)x +
(−0.012 ± 0.003) which clearly evidences the lack of
systematic errors in the determination of the considered elements. Differences between results found and certiied
ones are not statistically signiicant (see tcal values in Table 5).
Conclusions
The nebulizer system used in this work has proved its beneits in ICP OES; in general good-short term stability of the plasma was obtained; thus providing a signiicant improvement over conventional nebulization systems. The great advantage is that this system is adequate for the simultaneous determination of non-hydride and hydride forming elements in samples with different matrix composition. Good recoveries obtained for the elements analyzed and the excellent data found for different certiied samples, clearly show the accuracy of the ICP OES determination of minor and trace elements in previously digested food samples.
Acknowledgments
Authors acknowledge the financial support of the Ministerio de Ciencia e Innovacion project AGL2007-64567, Ministerio de Educación project SAB2009-0064 and Conselleria d’Educació I Ciència de la Generalitat Valenciana GV PROMETEO 2010-055. Z. Benzo acknowledges Instituto Venezolano de Investigaciones
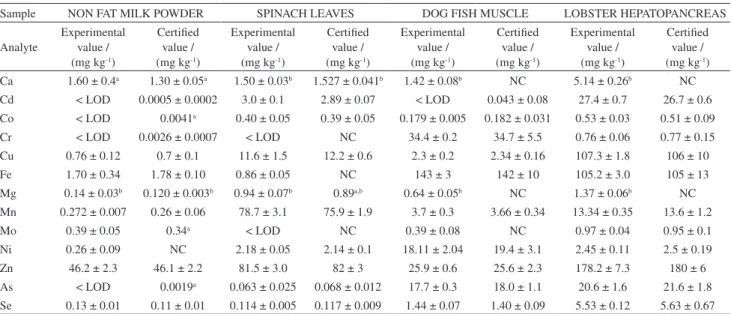
Table 5. Analysis of certiied reference materials by ICP OES using a designed dual nebulizer for the simultaneous determination of hydride and non hydride forming elements
Sample NON FAT MILK POWDER SPINACH LEAVES DOG FISH MUSCLE LOBSTER HEPATOPANCREAS
Analyte
Experimental value / (mg kg-1)
Certiied value / (mg kg-1)
Experimental value / (mg kg-1)
Certiied value / (mg kg-1)
Experimental value / (mg kg-1)
Certiied value / (mg kg-1)
Experimental value / (mg kg-1)
Certiied value / (mg kg-1)
Ca 1.60 ± 0.4a 1.30 ± 0.05a 1.50 ± 0.03b 1.527 ± 0.041b 1.42 ± 0.08b NC 5.14 ± 0.26b NC
Cd < LOD 0.0005 ± 0.0002 3.0 ± 0.1 2.89 ± 0.07 < LOD 0.043 ± 0.08 27.4 ± 0.7 26.7 ± 0.6 Co < LOD 0.0041a 0.40 ± 0.05 0.39 ± 0.05 0.179 ± 0.005 0.182 ± 0.031 0.53 ± 0.03 0.51 ± 0.09
Cr < LOD 0.0026 ± 0.0007 < LOD NC 34.4 ± 0.2 34.7 ± 5.5 0.76 ± 0.06 0.77 ± 0.15
Cu 0.76 ± 0.12 0.7 ± 0.1 11.6 ± 1.5 12.2 ± 0.6 2.3 ± 0.2 2.34 ± 0.16 107.3 ± 1.8 106 ± 10
Fe 1.70 ± 0.34 1.78 ± 0.10 0.86 ± 0.05 NC 143 ± 3 142 ± 10 105.2 ± 3.0 105 ± 13
Mg 0.14 ± 0.03b 0.120 ± 0.003b 0.94 ± 0.07b 0.89a,b 0.64 ± 0.05b NC 1.37 ± 0.06b NC
Mn 0.272 ± 0.007 0.26 ± 0.06 78.7 ± 3.1 75.9 ± 1.9 3.7 ± 0.3 3.66 ± 0.34 13.34 ± 0.35 13.6 ± 1.2
Mo 0.39 ± 0.05 0.34a < LOD NC 0.39 ± 0.08 NC 0.97 ± 0.04 0.95 ± 0.1
Ni 0.26 ± 0.09 NC 2.18 ± 0.05 2.14 ± 0.1 18.11 ± 2.04 19.4 ± 3.1 2.45 ± 0.11 2.5 ± 0.19
Zn 46.2 ± 2.3 46.1 ± 2.2 81.5 ± 3.0 82 ± 3 25.9 ± 0.6 25.6 ± 2.3 178.2 ± 7.3 180 ± 6
As < LOD 0.0019a 0.063 ± 0.025 0.068 ± 0.012 17.7 ± 0.3 18.0 ± 1.1 20.6 ± 1.6 21.6 ± 1.8
Se 0.13 ± 0.01 0.11 ± 0.01 0.114 ± 0.005 0.117 ± 0.009 1.44 ± 0.07 1.40 ± 0.09 5.53 ± 0.12 5.63 ± 0.67
aInformation value; bconcentration value in mass fraction (%); NC: non certiied; t
cal = 0.0075, t (n = 14, 95%) = 2.145; tcal= 0.0128, t (n = 18, 95%) = 2.101;
tcal= -0.006, t(n = 16, 95%) = 2.12; tcal= -0.00346, t (n=20, 95%) = 2.086.
Cientíicas, IVIC for allowing her sabbatical leave and T. Zoltan, for her contribution in the nebulizer construction as part of her degree thesis.
References
1. Pohl, P.; Trends Anal. Chem. 2004, 23, 87.
2. Yan, X. P.; Ni, Z. M.; Anal. Chim. Acta1994, 291, 89. 3. Wolnik, K. A.; Fricke, F. L.; Hahn, M. H.; Caruso, J. A.; Anal.
Chem.1981, 53, 1030.
4. Pohl, P.; Sturgeon, R. E.; Trends Anal. Chem.2010, 29, 1376. 5. Gomez, L. R.; Marquez, G. D.; Chirinos, J. R.; Anal. Bioanal.
Chem. 2006, 38, 188.
6. Asfaw, A.; Wibetoe, G.; Anal. Bioanal. Chem. 2005, 382, 173. 7. Wiltsche, H.; Brenner, I. B.; Prattes, K.; Knapp, G.; J. Anal. At.
Spectrom.2008, 23, 1253.
8. Benzo, Z.; Maldonado, D.; Chirinos, J. R.; Marcano, E.; Gomez, C.; Quintal, M. S. J.; Instrum. Sci. Technol.2008, 36, 598. 9. Matusiewicz, H.; Slachcinski, M.; Microchem. J.2007, 86, 102. 10. Zoltan, T.; Benzo, Z.; Murillo, M.; Marcano, E.; Gomez, C.;
Salas, J.; Quintal, M.; Anal. Bioanal. Chem.2005, 382, 1419. 11. Dos Santos, E. J.; Herrmann, A. B.; de Caires, S. K.; Azzolin-Frescura, V. L.; Curtius, A. J.; Spectrochim. Acta, Part B2009, 64, 549.
12. Rojas, I.; Murillo, M.; Carrion, N.; Chirinos, J.; Anal. Bioanal. Chem.2003, 376, 110.
Submitted: April 20, 2011