Statistis of Turbulene Indued by Magneti Field
A.A. Ferreira, M.V.A.P. Heller, M.S. Baptista, and I.L. Caldas
Instituto deFsia,UniversidadedeS~aoPaulo
C.P.66318,CEP05315-970S~aoPaulo,S.P.,Brasil
Reeivedon26June,2001
UsingtheTCABRtokamakfaility,weanalyzeturbulenteletrostatiutuationsinastationary
toroidalmagnetoplasma,reated by radio-frequenywavesand onnedby twodierenttoroidal
magnetields. Theinreaseoftoroidalmagnetieldleadstogradientsinthemeanplasmaradial
prolesandtheonsetofeletrostatiturbulene. Fortheturbulentutuations,weshowthatthe
statistis of data olleted using xedsampling time is the same than the statistis of the time
inwhih measurementsof thedata returnto aspeiedreferene intervalof values. Withthese
statistialanalyses wendspeialinvariant probability distributions,power-salinglaws forsome
averagequantities,andlong-rangeorrelationfortheirosillations. Theseobservationssuggestthat
turbulenehas reurrent properties, as those observed inreurrent fullyhaoti low-dimensional
systems. Therefore,evolutionofmeasurementsoflow-dimensionaldynamialsystemsanbeused
todesribethereurreneobservedinthetokamakedgeturbulene.
I Introdution
Flutuationsexitedinplasmaphysisanleadto
turbulene[1,2℄. Experimentalworksarriedoutona
lineardevieshowedthatdriftwavesandestabilizethe
plasmaandgenerateaturbulentspetrum[3℄. Another
experimental investigationshowedthat turbulene
de-velopsinatoroidalmagnetoplasmadue todriftwaves
desestabilization byalargemagnetionnementeld
[4℄. On the other hand, in another experiment in a
toroidaldevie withoutplasmaurrent,anomaloustra
nsport was assoiated to intermittent oherent
stru-tures[5℄.
Theonsetof temporal eletrostatiturbulene was
experimentally investigated in a stationary toroidal
magnetoplasma, reatedby radio frequenywaves[6℄,
onned by a toroidal magneti eld. To
harater-izeturbuleneandintermitteny,spetralanalyseswere
appliedtooatingpotentialandionsaturationurrent
utuationsobtainedwitheletriprobesattheplasma
edge. Theinreaseofmagneti eldleadstogradients
in the mean pl asma radial proles and a ontinuous
powerspetrumof higher frequeny wavesoupled to
thedrivenradiofrequenywaves.
Theunderstandingofhaosindeterministisystems
suggests that a probabilistidesription of turbulene
anbeappliedtodesribethepreviousresults[7℄. Here,
weuseatoolofanalysisthatmeasuresthereurreneof
theturbulentdata,inaordanewithstrutures
vary-ingonspae-time[8℄. Thistoolgivesinformationabout
thestatistisoftheturbulentosillations. Moreover,we
use areurrentmeasure of haotidynamis, the rst
Poinarereturn time [8, 9℄ to simulate the statistial
behavior of the turbulent eletrostati measurements.
Theapplieddynamialsystemtheoryexplainsalsothe
existeneof salinglawsfortheaveragevaluesof data
distributions.
II Experimental Data
The experiment [6℄ was performed with a
hydro-genmagnetized irular plasma in the toroidal devie
oftheTCABRtokamak(majorradiusR
0
=0.610mand
minorradius a= 0.175m. Thestationary plasmawas
obtainedbya(16kHz)radio-frequenyosillator with
pulselengthof25ms. Hydrogenpressure10 4
Pa.
Typ-iallyobtainedplasmaedgeparameterswereT<30eV
andn<5x10 16
m 3
. Inorder tostudy theturbulene
onsetweappliedtwodierenttoroidalmagnetields,
namely,B
'
=0.04Tand1.00T.
Thedata were olletedfromamultipin Langmuir
probethatmeasures theoatingpotentialandtheion
saturationurrentutuations,meandensity,eletron
temperature,andplasmapotential. Theprobesignals
were digitally reorded at a sampling frequeny of 1
MHz. Here,weanalyzetheionsaturationurrent
u-tuations, I, for intervalsof 20 ms during thereorded
pulses,withfrequenieshigherthan20kHz.
Density and temperature for the magneti eld of
1 T were n (2 7)10 17
m 3
and T
e
=(12-30)eV.
Inthesrape-o-layer,theradialdeayoeÆientsare
n
=-n=5n 2:910 2
m, for density, and
Te =
T =5T 4:010 2
Figs. 1(a)-(b) showsamples ofutuatingion
sat-uration urrent, I, at r=a = 0.85 for the two applied
magnetields, B
'
=1.00T(a)andB
'
=0.04T(b).
Theutuationamplitudeinreaseswiththemagneti
eld. Fig.2presentsthefrequenypowerspetraofthe
sameutuationsformagnetieldsof1Tand0.04T.
Thisgureshowsaontinuousbroadband of
frequen-ies from 20 kHz to 60 kHz (the 16kHz frequeny of
theradio-frequenyosillatordoesnotappearin these
gures). Forallfrequeniestheutuationamplitudes
inreasewiththemagnetield.
1.5
2
t (ms)
−300
−100
100
300
I(t) (arb. units)
1.5
2
t (ms)
−300
−100
100
300
I(t)
(A)
(B)
Figure1. Samples ofutuating ionsaturation urrent,I,
atr=a=0.85forthetwoappliedmagnetields,B'=1.00
T(a)andB'=0.04T(b).
Figure2. Thefrequenypowerspetraofthesame
utu-ations for magnetields of 1T (higher amplitudepower
spetra)and0.04T (loweramplitudepowerspetra).
III Statistial Analysis of T
urbu-lene
We dene I
n
for the value of the utuating ion
isthesamplingrate. Fig. 3showstheevolutionof the
dierene
R
n =I
n+1 I
n
: (1)
These utuating dierenes are reurrent, i.e., their
amplitudes eventuallyome bakto areferene
inter-valofvalueswithsizeof2Æat=0. Next,inthisgure,
wedenethereturningtime,T
n
,astheintervaloftime
inwhihR
n
repeatsavalueinsidethehosenreferene
interval. Theproeduretoobtainthesereturningtime
isillustratedinFig. 3,whereweshowashemati
rep-resentation of the T
n
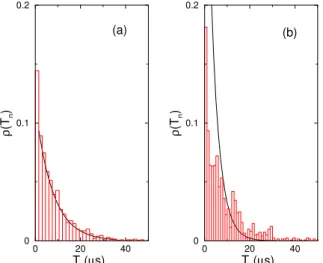
. Theprobability distributionof
T
n
in normalizedunits (T
n
), obtainedfor the
turbu-lent utuations, an be seen in Fig. 4. For B= 1T
thedistributionorrespondstoaPoisson(Fig. 4a)[9℄.
However,thedistribution ofFig. 4b,for B=0.04T,is
notaPoissondistribution.
−100
−50
0
50
100
R
n
(arb. units)
χ
T
1
=22
T
2
=33
n (
τ
)
2
δ
20
40
60
80
Figure3. ThediereneR
n
andthereturningtimeT
n for
theutuationtoreturntotheintervalofsize2Æ.
0
20
40
T
n
(
µ
s)
0
0.1
0.2
ρ
(T
n
)
0
20
40
T
n
(
µ
s)
0
0.1
0.2
ρ
(T
n
)
(a)
(b)
Figure4. TheprobabilitydistributionofTn innormalized
units (Tn), obtained for the turbulent utuations with
1.00T(a)and0.04T(b).
The average return time < T
n
of this interval. Figs. 5and 6showthese dependene
for the two magneti elds. For = 0, the
exponen-tial deayof <T > with Æ, for small Æ, is almost the
samefor thesetwoelds (Fig. 5). So thisvariationis
notsensitivetotheinreaseofturbulene. However,for
thehighmagnetield,<T
n
>inreasesexponentially
with,butthisvariationisnotexponentialforthelow
magnetield (Fig. 6).
0
0.01
0.02
0.03
0.04
0.05
ρ
(R
n
)
0
0.01
0.02
0.03
0.04
0.05
ρ
(R
n
)
−200
−100
0
100
200
(a)
(b)
(c)
(d)
−100
0
100
200
0.01
0.02
0.03
0.04
ρ
(R
n
)
R
n
(arb. units)
R
n
(arb. units)
Figure5. Theexponentialdeayof<T >withÆ,forsmall
Æ,with=0.
0
20
40
χ (arb. units)
0
20
40
60
<T
n
> (
µ
s)
1.00 T
0.04 T
Figure6. Theexponentiallawof<Tn>inrespetwith
forthe1.00T.Forthelowereld,thelawbetween<Tn>
andisnotexponential.
On theother hand for the series R
n
weobtain its
probability distribution (R
n
) shown in Figs. 7(a-b).
These distributionsanberepresentedas[9℄
[R
n ()℄=
1
2<R + n > exp (jRn <Rn>j=<R + n > ); (2)
whih orresponds to a sum of two Poisson
distribu-tions,where<R
n
>istheaverageoftheR
n
'sandR +
representsR
n
bigger than <R
n
>. This Poisson-like
is haraterized by the average width of the
distribu-tionwhih isequalto <R +
n
>. Figs. 7(-d) showthe
simulation of the distributions of Figs. 7(a-b). Next,
weshowhowto simulate these distributionsusing the
reurreneofalow-dimensionaldeterministimodel.
0
1
2
3
4
5
δ(arb. units)
0
10
20
30
<T
n
> (
µ
s)
1.00 T
0.04 T
Figure7. Probability distributionofthe dierene Rn for
1.00T(a)and 0.04T (b). Theprobability distributionof
aombinationofthePoinarerstreturntimeofahaoti
trajetory(-d).
Wesimulatethereportedstatistial behaviorusing
alow-dimensionaldeterministimodel, namelythe
lo-gistimap[11,12℄.
x n+1 =bx n (1 x n ) (3)
withtheontrol parameterb=4. Thereurreneis
in-trodued through the rst Poinarereturn time, P
n ,
ofthehaotiorbit,i.e., thenumberofmapiterations
requiredfor the orbit to reah twie aspeied small
interval of width 2 [10℄. Fig. 7 showsthat the
ex-perimentaldistributionofFig. 7aisreproduedbythe
distributionofvaluesalulatedforR
n
givenbyalinear
ombinationoftworstPoinarereturntime:
R n =P n (;x 0 ) P n (;x 0 0 ) (4)
noindentwhere x
0 andx
0
0
aretwodierentinitial
on-ditionsof the haoti trajetory. Usingthe same
pro-edure toobtain Fig. 7bweobtainFig. 7d that does
notreprodueso welltheexperimentaldistribution.
Reurreneappearsinstatistialanalysesof
utu-ation dierene, R
n =I
n+1 I
n
, olleted using xed
samplingtime,asin Figs. 7(a-b), andalsoin analyses
obtainedfrom thereturn time to aspeied referene
intervalofI
n
(Fig. 4).
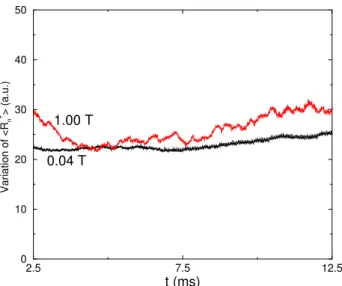
Fig. 8 shows, for both magneti elds, the
varia-tionsof theaverage widthofthe Poisson-like
distribu-tion, < R +
disharge, for previous time intervals of 250s. The
width hanges in time for the turbulent data of the
higher magnetield andis more stable forthe lower
magnetield.
2.5
7.5
12.5
t (ms)
0
10
20
30
40
50
Variation of <R
n
+
> (a.u.)
1.00 T
0.04 T
Figure8. Thevariationsoftheaveragewidthofthe
Poisson-like distribution, < R +
n
>, obtained eah 1s, along the
plasmadisharge,forprevioustimeintervalsof250s.
IV Conlusions
Inreasing thetoroidalmagneti eld,weobserve
gradients in the plasma proles. Spetral
ompo-nents, with frequenies higher than those injeted in
theplasma, areexitedgenerating broaderontinuous
frequenyspetrathatindiatetheonsetofturbulene.
Wepresentevidenesthat,inreasingthemagneti
eld, harateristis of the probability distribution of
theplasmautuationsapproahthoseobtainedby
sta-tistialanalysesoftherstPoinarereturntimeofthe
logisti map. Thus, twodierentf lutuation regimes
turbulent regime, for 1T, the utuation is reurrent
anditsstatistisistheonepresentedbyafullyhaoti
dynamisystem. However,theutuationobserved
be-foretheonsetofturbulenehasanotherkindof
statis-tis.
Aknowledges
ThisworkwaspartiallysupportedbyBrazilian
gov-ernmentalagenies FAPESP,CNPq,andCAPES.
Referenes
[1℄ R. D. Hazeltine, J. D. Meiss, Plasma Connement,
Addison-Wesley Publishing Company, Redwood City
(1992).
[2℄ W.Horton,Rev.Mod.Phys.71,735(1999).
[3℄ U.Kaushke,G.Oelerih-HillandA.Piel,Phys.Fluids
B2,38(1990).
[4℄ C.Riardi,D.Xuantong,M.Salierno,L.Gamberale,
andM.Fontanesi,Phys.Plasmas4,3749 (1997).
[5℄ F.J.Oynes,O.M.Olsen,H.L.Peseli,A.Fredriksen,
andK.Ripdal,Phys.Rev.E57,2242(1998).
[6℄ A.A.Ferreira,M.V.A.P.Heller, I.L. Caldas,Phys.
Plasmas7,3567(2000).
[7℄ U. Frish, Turbulene, Cambridge Press, Cambridge
(1995).
[8℄ M.S.Baptista,I.L.Caldas,PhysiaA284,348(2000).
[9℄ I.L.Caldas,M.S.Baptista,C.S.Baptista,A.A.
Fer-reiraeM.V.A.P.Heller,PhysiaA287,91(2000).
[10℄ V.Afraimovih,Chaos7,12(1997).
[11℄ K.T.Alligood,T.Sauer,J.A.Yorke,Chaos,an
Intro-dution to Dynamial Systems, Springer-Verlag, New
York(1997).
[12℄ E.Ott,ChaosinDynamialSystems, Cambridge