Article
Printed in Brazil - ©2017 Sociedade Brasileira de Química 0103 - 5053 $6.00+0.00
*e-mail: [email protected]
Toxic Elements and Microbiological Content of Food: Evidence from a Case Study
in a Brazilian City Heavily Contaminated by Lead and Cadmium
Kelly M. Macedo,a Isabella M. M. da Silva,b Fábio S. de Oliveira,*,b Jacira T. Castro,c
Daniele C. M. B. dos Santos,d Fernanda Freitasb and Maykson C. de Jesusa
aCentro de Ciências Agrárias Ambientais e Biológicas, Universidade Federal do Recôncavo da Bahia,
R. Rui Barbosa, 710, 44380-000 Cruz das Almas-BA, Brazil
bCentro de Ciências da Saúde, Universidade Federal do Recôncavo da Bahia, Av. Carlos Amaral, 1015,
Cajueiro, 44574-490 Santo Antônio de Jesus-BA, Brazil
cCentro de Ciência e Tecnologia em Energia e Sustentabilidade, Universidade Federal do Recôncavo da Bahia,
Avenida Centenário, 697, Bairro SIM, 44085-132 Feira de Santana-BA, Brazil
dInstituto de Química, Universidade Federal da Bahia, Campus Universitário de Ondina,
40170-290 Salvador-BA, Brazil
Food security has become a major concern of the world population and this is even more prominence in polluted areas. This study aimed to evaluate microbiological and toxic elements content of local food itens from Santo Amaro, Bahia. The determination of lead, cadmium, Escherichia coli (E. coli)and total coliform were carried out in coriander, cassava, okra, chicken muscle/liver, fish muscle and eggs. The population of total coliform and E. coli were estimated by the express count method using plates EC (AOAC 991.14) and accounting of colonies by colony counter. For toxic elements determination samples were digested using HNO3 and H2O2 following EPA 200.3 using a digester block with cold fingers. The determination of lead and cadmium was performed by inductively coupled plasma optical emission spectrometery (ICP OES). The mean total coliform has ranged from < 1 to 4.5 log CFU g-1. Coriander presented higher mean total coliform (4.5 log CFU g-1) and E. coli was higher than recommended levels. The range of toxic elements revealed higher concentrations of lead in chicken muscle (1.25-11.58 mg kg-1) and cadmium in eggs (0.45-1.06 mg kg-1). Finally, the risk to the inhabitants of Santo Amaro was evident and reinforces the importance of effective actions of local authorities.
Keywords:E. coli, total coliform, lead, cadmium, contamination
Introduction
The food chain is affected by dangers that can be of physical, chemical or biological nature. Once these dangers can be potentially harmful to humans, food security has become a matter of global public health.1 Microbiological
evaluation allows the identification of parameters that are among the most important ones to determine the quality of foods. The non-observance of microbiological parameters results in economic losses and hazards to public health. These criteria are considered relevant for the evaluation of safety and microbiological quality of food, providing information regarding the sanitary conditions and the possibility of contamination by pathogens.2
Among the organisms used as safety indicator, there are total coliform, which points out failures in the hygienic aspect, and the thermotolerant coliform, especially the Escherichia coli (E. coli), which indicate fecal contamination by enteropathogens.3 The quantification of
these bacteria in food is important to meet microbiological standards established in Brazil by National Health Surveillance Agency (Agência Nacional de Vigilância Sanitária, ANVISA).
Just like the microbiological hazards, the chemical hazards also require special care, since the ingestion of food with high levels of chemical substances can cause chronic and severe diseases.4 Toxic elements such as
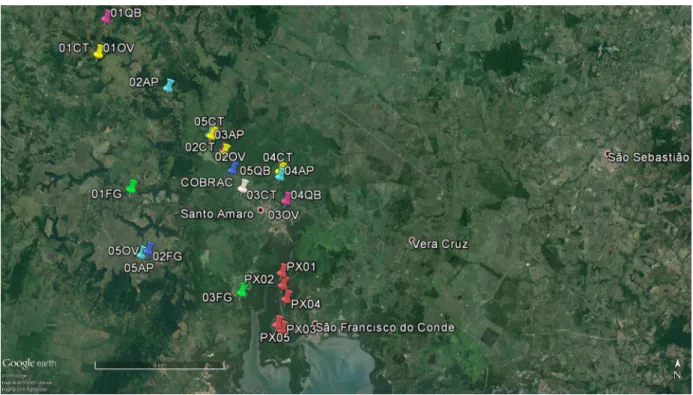
The study area of this work is the city of Santo Amaro (Bahia, Brazil), located about 72 km from the capital Salvador, UTM coordinates 8612904, 532670 (SAD69, 24L) (Figure 1). In this territory there was an intense contamination by Pb and Cd caused by the metallurgic activity carried out by the Brazilian Lead Company (Companhia Brasileira de Chumbo, COBRAC) that irresponsibly dumped the waste rich in toxic metals in the environment, dispersing contaminants throughout the city.6
The smelter’s records estimated that about 500,000 tons of furnace slag with 1-3% lead had been dumped into surrounding areas since the plant began working. Then Santo Amaro has been considered one of the cities with highest lead pollution in the world.
Considering the lack of studies regarding microbiological and chemical quality of food, especially for food samples from an environment contaminated by toxic elements, this study aimed to evaluate the microbiological and chemical
quality of food with high frequency of consumption by the population of Santo Amaro.
Experimental
Ethical aspects
The study was approved by the Research Ethics Committee of Universidade Federal da Bahia (CAAE: 04022312.0.0000.0056 - Appreciation 219.566). The participants were informed of the study objectives and those who agreed were invited to sign an informed consent. They were free to choose not to participate of the study in case they believed it could affect their moral or physical integrity.
Choosing of food samples
In order to select the vegetables and animal products
to be sampled in this study, it was necessary to assess the food consumption profile of Santo Amaro’s population to obtain data about locally produced food most commonly consumed by the population, organized by food group. Food frequency questionnaire (FFQ) adapted to the study population7,8 was applied to 172 city residents with ages
between 18 to 60 years old and of both sexes.
For the choice of products on the list of FFQ, data from Municipal Agricultural Production in the city of Santo Amaro collected by the Brazilian Institute of Geography and Statistics (Instituto Brasileiro de Geografia e Estatística, IBGE) census of 2006 and from Consumer Expenditure Surveys (Pesquisas de Orçamentos Familiares, POF) 2008/09 were used, resulting in 53 food items. The questionnaires were applied in 12 Family Health Units (Unidades de Saúde da Família, USF) along the urban and rural area of the city. The survey was conducted from February to August 2014 and the data was tabulated and analyzed using SPSS 20.
From the results of FFQ data and the dialogue with local food producers, the inclusion criteria were food items with higher frequency of consumption, produced by at least 5 different local producers. Six items were chosen, three of them were animal products and the other three vegetable products. The selected animal products were chicken, fish and egg with a consumption percentage of 78.1, 37.9 and 31.6%, respectively. The selected vegetable items were coriander (Coriandrum sativum), okra (Abelmoschus esculentus L. Moench) and cassava (Manihot esculenta) with a consumption percentage of 93.3, 43.0 and 30.8%, respectively. Lead and cadmium were used to evaluate chemical contamination and the populations of total coliform and E. coli as microbiological parameters. A descriptive analysis was performed for the quantitative variables (average and standard deviation) to analyze the data.
Food sampling
Sample collection were carried out in Santo Amaro, Bahia, Brazil, UTM coordinates 8612341, 531528 (SAD69, 24L), from July to August 2014 during the rainy season of the study area. Five samples of each item were collected at five different production sites located at urban or rural zone of this city. The vegetables were collected manually and aseptically then put in plastic sterile bags and kept refrigerated in thermal bags. Egg and chicken samples were obtained from production sites and the animals were transported to a slaughterhouse where they were slaughtered. Fish samples were captured by local fishermen using nets at five different locations of the Subaé River.
Samples of muscle and liver were used to analyze chicken but for fish only muscle samples were used. The samples were placed in previously decontaminated plastic sterile bags and transported under refrigeration to the laboratories where they were analyzed.
The microbiological analysis occurred within 24 hours after sample collection. For lead and cadmium determination, the samples were kept frozen at −25 °C until sample preparation.
Apparatus
A freeze-dryer Terroni LS 300D (Brazil) was used to remove moisture from food samples. For sample digestion a heated digester block Tecnal TE-40/24 (Brazil) was used.
An inductively coupled plasma optical emission spectrometer (ICP OES) VISTA PRO (Varian, Mulgrave, Australia), axially arranged, equipped with CCD detector operating at wavelengths from 167 to 785 nm, was used for lead and cadmium determination. The optical system of the ICP OES was calibrated with a reference multielementary solution and the torch alignment was carried out using 5.0 mg L-1 Mn solution.
The spectral lines were selected by considering the intensities of emission of the analytical signals and the appropriate sensitivity for determining elements at concentration range of food samples. The characteristics and experimental conditions of the ICP OES are presented in Table 1.
Reagents
Analytical reagent grade materials were used for all experiments. All solutions were prepared using high-purity water with a resistivity of 18.3 MΩ cm obtained from an Easypure II RF/UV (Barnsted Thermolyne, USA). The nitric acid reagent was previously purified using a PTFE sub-boiling distillation system BSB-939-IR (Berghof, Eningen, FRG, Germany). Plastic and glass containers were decontaminated by immersion in 10% v/v HNO3 for
at least 12 h and a thorough rinse with ultrapure water prior to use. Reference solutions containing cadmium and lead were obtained from dilutions of 1000 mg L-1 stock solutions
(Merck, Germany).
Microbiological analysis
of colonies was performed with the colony counter CP600 Plus (Phoenix®, Brazil), calculating colony formation units
(CFU) and log CFU g-1 of sample.3
Chemical analysis
All the materials used to perform the analysis were decontaminated with 10% nitric acid within 12 hours. The samples kept at −20 °C were freeze-dried (LS 300D, Terroni, Brazil) during 12 hours in order to remove the moist. Dried samples were grounded using a porcelain mortar and pestle and sieved using 300, 200 and 100 µm nylon sieves.
The reference methodology 200.3 from the Environmental Protection Agency (EPA)9 has been adopted
by this study with some adaptations.10,11 Portions of 100 mg
of samples were transferred to digestion tubes in triplicate proceeding to the pre-digestion stage by adding 5 mL of concentrated nitric acid and heating the mixture to 50 °C for 12 h in a digester block (TE-40/24, Tecnal, Brazil). Cold finger condensers were used in order to minimize nitric acid and volatile analytes lost. After that period the temperature was raised to 140 °C and kept for 4 hours. Then the sample was cooled to room temperature and 2 mL of hydrogen peroxide 30% were added followed by heating to 140 °C for 3 hours. The resulting solution was transferred to 25.0 mL volumetric flask and the volume was completed with ultrapure water. Filtration using Whatman No. 1001042 was needed at the end of the process only for coriander samples, due to rare cases of occurrence of almost imperceptibly solid particles, in order to prevent clogging in ICP OES system.
Results and Discussion
Microbiological markers
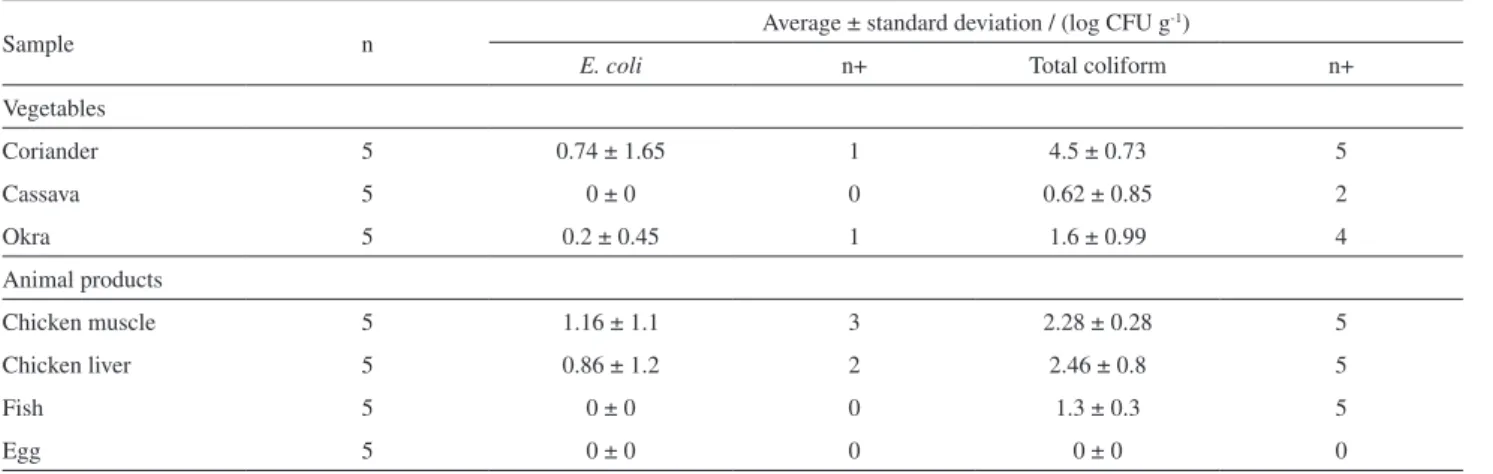
The average population of total coliform in vegetables ranged from 0.62 to 4.5 log CFU g-1. The vegetable that
presented the greatest average of total coliform was coriander with 4.5 log CFU g-1 (Table 2) and all samples
presented a population higher than 3.0 log CFU g-1. A
similar result was observed by Rincón et al.12 in which
coriander exhibited higher level of contamination by total coliform compared to other evaluated item.
The average population of total coliform in animal products ranged from < 1 to 2.46 log CFU g-1. The chicken
liver presented the highest average (2.46 log CFU g-1) and two
samples have shown contamination above 3.0 log CFU g-1.
Carvalho et al.,13 while evaluating the presence of
microorganisms in samples from poultry products, noted the presence of total coliform in processed livers, indicating that even in products subjected to inspection they are still susceptible to contamination by this group.
In the vegetables E. coli bacteria was detected in coriander and okra samples, but only in one sample of each, presenting a microbial load of 3.7 and 1.0 log CFU g-1,
respectively. According to the parameters established by the Resolution of the Executive Board (Resolução da Diretoria Colegiada, RDC 12/2001) of ANVISA,14 the coriander
sample was contaminated above recommended level (2.0 log CFU g-1), therefore it was unsafe for consumption.
From the 140 samples of fresh vegetables analyzed by Santos et al.,15 the coriander has presented the greatest
amount of positive samples for E. coli. Singh et al.16 have
Table 1. Instrumental parameters for determinations by ICP OES Characteristic and parameter
Radio frequency of the generator / MHz 40
Detector CCD
Inner diameter of the torch’s central tube / mm 2.3
Polychromator diffraction grating Echelle and CaF2 dispersion prism
Wavelength range / nm 167-785
Nebulization chamber Sturman-Masters
Nebulizer V-shaped groove
Power measurement / W 1200
Signal integration time / s 2.0
Plasma gas flow rate / (L min-1) 15
Auxiliary gas flow rate / (L min-1) 1.5
Nebulization gas flow / (L min-1) 0.70
demonstrated that, when cultivated in contaminated fields, this vegetable can work as an environmental reservoir of an E. coli pathogenic serotype, the enterotoxigenic (ETEC).
About microbiologic evaluation of the okra samples, E. coli was detected in only one sample and the average result for this sample was below recommended safe limits for this item (2.0 log CFU g-1). Similar results were observed by
Figueiredo et al.17 when they evaluated the sanitary quality of
okra irrigated with different types of treatments and checked that none of the samples was contaminated by E. coli.
In the cassava samples it was observed the absence of contamination by E. coli. The lack of previous handling and processing of this tubers may explain these results as the samples were obtained fresh, directly from the producers and aseptically. Dósea et al.18 noted that the increase of
this bacterium in cassava probably occurs due to excessive handling and exposure of the product during processing. The physiology of this tuber can also explain the absence of contamination since the presence of even low amounts of cyanogenic glycosides in the root peel and enzymatic release of HCN can act as a preventive factor for microbial proliferation.
According to Moreti,19 microbiologic contamination of
vegetable crops may occur from many sources, especially from the water used in the irrigation process which may work as the carrier of pathogens that present higher risks of contamination to humans, like E. coli.
In the animal products, E. coli was isolated in samples of chicken muscles and liver, with an average of 1.16 and 0.86 log CFU g-1, respectively (Table 2). The E. coli
results for these samples were in compliance with the current sanitary legislation safe limits for chicken muscle (4.0 log CFU g-1) and liver (5.0 log CFU g-1).14
Similar results were obtained in a study evaluating microbiologic quality of the meat and dairy products
sold in street markets of Arapongas, Paraná (Brazil), conducted by Zonta et al.20 They observed that the
contamination by E. coli in fresh meat and poultry had an average of 1.1 log CFU g-1, thus suitable for consumption.
Vieira et al.21 observed high levels of contamination while
evaluating the contamination by E. coli in chicken livers. Considering that fish were obtained directly from aquatic environment and preserved aseptically, the small microbial load of total coliform and the absence of E. coli in the fish muscle samples obtained in this study (Table 2) may be related to the fact that natural levels of microbial contamination increase in different organs. Usually the fish muscle presents smaller microbial populations than the gastrointestinal tract and the flesh. Coliform are unnatural in fish and their presence may be related to the microbiological conditions of the water where the fish lives.22
The results pointed out that the egg samples were free of total coliform and E. coli (Table 2). Therefore, there were no microbiological risks to human consumption. The result may be associated to the presence of natural antimicrobial agents, especially in the egg albumen. The egg has enzymes capable of destroying the bacterial cell wall and its pH is not favorable to microbial growth2 with average pH of 7.9
for the whites and 6.2 for the yolk.23
In the opposite direction, results of other works revealed high levels of E. coli in free-range eggs.24 The hygienic
and sanitary aspects of this type of eggs allow higher proportions of contamination by microorganisms. Thus it is suggested to clean and disinfect the environment and the equipment, to vaccinate poultry, to ensure quality control of the water and the food of the animals, to handle the excrement properly, amongst other sanitary measurements to reduce the risk of contamination.
Although there are no parameters in Brazilian legislation for total coliform, it is noted that the presence of
Table 2. Population of total coliform and E. coli in food samples of Santo Amaro, Bahia, Brazil, 2015
Sample n Average ± standard deviation / (log CFU g
-1)
E. coli n+ Total coliform n+
Vegetables
Coriander 5 0.74 ± 1.65 1 4.5 ± 0.73 5
Cassava 5 0 ± 0 0 0.62 ± 0.85 2
Okra 5 0.2 ± 0.45 1 1.6 ± 0.99 4
Animal products
Chicken muscle 5 1.16 ± 1.1 3 2.28 ± 0.28 5
Chicken liver 5 0.86 ± 1.2 2 2.46 ± 0.8 5
Fish 5 0 ± 0 0 1.3 ± 0.3 5
Egg 5 0 ± 0 0 0 ± 0 0
total coliform in these food items is of great value because it indicates deficient handling practices during cultivation such as the use of contaminated water for irrigation and fertilization with fresh animal manure. On the other hand, the contamination by E. coli, even in small proportions, indicates the possibility of risks to the consumer’s health.25
Toxic elements contamination
Despite EPA 200.39 being an analytical method
already validated as well as the adopted adjustments,10
an experiment was carried out using bovine liver certified reference material (BCR-185R) and the results at dry basis (0.179 ± 0.020 mg kg-1 of Pb and 0.542 ± 0.0057 mg kg-1 of
Cd) agreed at 95% confidence level with those ones reported on the certificate of analysis of this material (0.172 mg kg-1
of Pb and 0.544 mg kg-1 of Cd). The overall precision in the
analysis of food items in the present work was satisfactory with average relative standard deviation (RSD) of 4.1 and 8.2% for cadmium and lead, respectively.
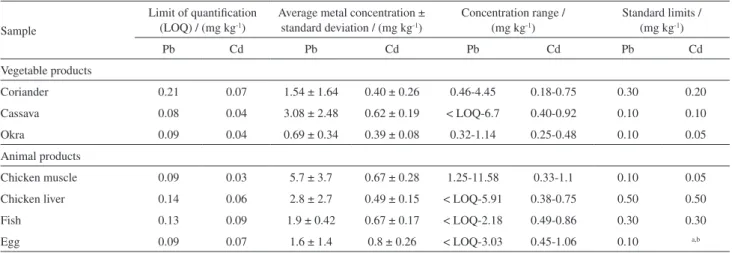
In the vegetable samples the average lead levels ranged from below limit of quantification (LOQ) to 6.7 mg kg-1
while the average cadmium concentrations varied from 0.18 to 0.92 mg kg-1 (Table 3). Cassava was the vegetable with
higher average contamination by metals and most samples exceeded the established levels for Pb and Cd (Table 3) up to 67 times the safe limits for lead.26 These results are
consistent with literature27 reporting that the metal content
in vegetables is higher in the roots and decreases according to the following order: roots > leaves > fruits > seeds.
Previous studies performed in Santo Amaro showed even higher levels of contamination by lead and cadmium in the cassava with average of 16.8 and 0.93 mg kg-1 and
concentrations ranges of 10.7-23.0 and 0.61-1.25 mg kg-1,
respectively.28 Although the levels found in this study are
lower than those ones reported in other works, it is clear the persistency of the contamination by toxic elements in this vegetable, even after 22 years since deactivation of COBRAC lead industry.
The concentrations of Pb in all the samples of coriander were above the established safe limits reaching up to 15 times the allowed concentration. In the same way, 80% of coriander sample also presented excess of contamination by Cd compared with legal limits.
A recent study demonstrated the biosorbent potential of the coriander for the removal of lead and other potentially toxic metals from contaminated water. This potential was attributed to the structure of the outer walls of microscopic cells of this plant which form an ideal architecture for absorbing toxic elements.29
The okra was the vegetable with smaller concentrations of Pb and Cd, with an average of 0.69 and 0.39 mg kg-1 and
concentration ranges of 0.32-1.14 and 0.25-0.48 mg kg-1,
respectively. However, these concentrations still exceeds the legislation standards. Pioneering works revealed alarming toxic metals concentrations in vegetables produced in Santo Amaro on areas surrounding COBRAC, and lead levels up to 215 mg kg-1 (dry basis) and cadmium concentrations up
to 11.8 mg kg-1 were found which drawn attention for the
hazards of ingesting okra and cassava.30
The present work shows that vegetable contamination was not limited to the factory surroundings. The current analysis revealed that contamination by toxic elements was observed even 15.1 km away from the factory. The Figure 2 exhibits the distribution of sampling points and the factory location.
Magna et al.,28 while analyzing the vegetables grown in
Santo Amaro, noted their ability in absorbing and carrying
Table 3. Concentrations of lead and cadmium (wet-basis) in vegetable and animal product samples and standard limits regulated by RDC 42/201326
Sample
Limit of quantification (LOQ) / (mg kg-1)
Average metal concentration ± standard deviation / (mg kg-1)
Concentration range / (mg kg-1)
Standard limits / (mg kg-1)
Pb Cd Pb Cd Pb Cd Pb Cd
Vegetable products
Coriander 0.21 0.07 1.54 ± 1.64 0.40 ± 0.26 0.46-4.45 0.18-0.75 0.30 0.20
Cassava 0.08 0.04 3.08 ± 2.48 0.62 ± 0.19 < LOQ-6.7 0.40-0.92 0.10 0.10
Okra 0.09 0.04 0.69 ± 0.34 0.39 ± 0.08 0.32-1.14 0.25-0.48 0.10 0.05
Animal products
Chicken muscle 0.09 0.03 5.7 ± 3.7 0.67 ± 0.28 1.25-11.58 0.33-1.1 0.10 0.05
Chicken liver 0.14 0.06 2.8 ± 2.7 0.49 ± 0.15 < LOQ-5.91 0.38-0.75 0.50 0.50
Fish 0.13 0.09 1.9 ± 0.42 0.67 ± 0.17 < LOQ-2.18 0.49-0.86 0.30 0.30
Egg 0.09 0.07 1.6 ± 1.4 0.8 ± 0.26 < LOQ-3.03 0.45-1.06 0.10 a,b
the toxic elements from the soil to the roots and after to the aerial part of the plant where there is a potential risk for consumption as food. These metals affect the nutritional values of vegetables and express a poisonous effect on humans who consume these food items. The high contamination found in vegetables can be closely related to contamination of the irrigation water31 and in the agricultural soil.28
The average contamination of the animal products ranged from 1.6 to 5.7 mg kg-1 for lead and from 0.49 to
0.8 mg kg-1 for cadmium (Table 3). The chicken muscle
was the product with highest average lead concentration while egg presented the highest cadmium concentration. All samples of chicken muscle and three samples of chicken liver presented contamination above the legislation standards. In those items the average concentration of cadmium was lower when compared to lead, however, all samples of chicken muscle and liver revealed cadmium contamination above the established limits. The maximum lead and cadmium concentrations for chicken muscle reached 57 and 13 times the safe levels for this product, respectively.
The high level of lead observed in the chicken muscle is supported by the work developed by Lopes et al.32 The
authors noted high masses of lead and cadmium retained in both fresh and rotten bovine muscle and they warned about potential risks associated to the consumption of meat contaminated by Cd2+ and Pb2+ ions. The authors also
associated the greatest retention of lead and cadmium ions in muscle tissue to the presence of chemical groupings in
the proteins, which presented affinity with those metallic ions, such as sulfhydryl, carbonyl, hydroxyl and amine.
The affinity of lead and cadmium to the sulfhydryl groups is highlighted, as this reactivity is closely related to lead inactivation effect on δ-aminolevulinic acid dehydratase (ALAD) cytoplasmic enzyme and ferrochelatase and can also be associated with cadmium reactivity to metallothionein.33,34 Thus, the high levels
of protein with sulfhydryl groups in muscle tissues may explain the metal accumulation in chicken meat.
Studies regarding the chemical contamination of chicken by lead and cadmium in Santo Amaro were not found, even though it is the source of protein most frequent consumed by this population. A study conducted in Turkey evaluated the levels of lead and cadmium in chicken and the results were 44.0 ± 2.9 mg kg-1 and 2.82 ± 0.78 mg kg-1,
respectively.31 The chicken’s feeding habits consists of
scratching and pecking the ground with occasional soil ingestion, enhancing the exposure of these animals to contamination by toxic elements in soil.
Amongst the fish samples, two of them were quantified as contaminated by Pb with an average level of 1.9 mg kg-1
and the exceeding level was up to 6 times the allowed limit. Cadmium concentrations in fish were above recommended limits for all these samples and the average result was 0.67 mg kg-1. In contrast to the results obtained in this work,
studies carried out with fish from the same region showed contamination by these metals at acceptable levels.35
According to Rocha et al.,36 the contamination by
toxic elements in fish from the Subaé River has been demonstrated and the authors warned about social, economic and health impacts to the local population whose fish remains one of the main source of protein. The fish contamination in this area was caused by the release of toxic elements in the Subaé River by COBRAC, leading to concentrations of Cd and Pb above the limits defined by the World Health Organization.
Among other factors, bioaccumulation of metals in fish depends on the eating habits and lifestyle of species. It is proposed that carnivorous species, due to their higher trophic levels, are often more contaminated than others due to the biomagnification process throughout the food chain and the concentration reflects the bioavailability of each metal. The high toxicity of these elements highlights the importance of a biomonitoring study, since these species are used as a human food source.37
The average concentration of lead for egg samples was 1.6 mg kg-1. Three of these samples revealed values up
to 29 times above the maximum limit of contamination. The average Cd level was 0.8 mg kg-1 and this chemical
specie was detected in all egg samples, however, Brazilian legislation has no standard limits for contamination of eggs by cadmium. The concentrations of lead in eggs are based on the corresponding levels to the bioaccessible fraction of this element in the soil and in different types of animal foods. The chickens raised in contaminated environments may accumulate pollutants in their eggs.38
After extensive research regarding the maximum levels of inorganic contaminants in foods, established by different international organizations, it was found that only the Ministry of Health of China determines upper limits for cadmium in egg of 0.05 mg kg-1.39 All egg samples
presented concentrations above the standards recommended by the Ministry of Health of China, therefore, it is an indicative of hazards to the consumer’s health.
For contaminated areas, such as the studied area, Soares et al.40 and Wang and Chen41 suggest the use
of microorganisms (fungi and bacteria) and plants to bioremediate impacted areas since they have the ability of removing, immobilizing and transforming the pollutants.
High concentration of lead and cadmium found for selected foods items is a matter of concern, mainly due to high frequency of its consumption by the Santo Amaro population and the deleterious effects from exposure to these chemical species can cause to humans.
Considering the chemical contamination as a hazard to human health and that Brazilian RDC 42/2013 involves a small variety of food items, the results of the present work suggest the evaluation and inclusion of safe levels for
high frequency of consumption such as egg in Brazilian regulations.
Conclusions
Considering the population of total coliform and E. coli in the analyzed vegetable samples, the need of sanitizing these products before consumption as well as the implementation of sanitary actions and guidance to producers is extremely important in order to minimize health risks.
In general, microbiological conditions of samples were satisfactory for the evaluated microorganisms, however, further researches are necessary for other index microorganisms and pathogens, considering that these food items are commonly eaten by people of Santo Amaro.
Based on the existing literature regarding chemical contamination of food in Santo Amaro, it was noted a persistency of contamination by lead and cadmium. In this way, the risks to Santo Amaro residents are evident, since the frequent ingestion of food with such levels of lead and cadmium can cause damages to human health.
Further studies involving the dosage of lead and cadmium of residents in the researched area, as well as in other vegetable or animal products are suggested. It is also suggested the encouragement of researches about bioremediation.
Finally, an update of the RDC 42/2013 is necessary in order to include a greater variety of food items in order to improve food surveillance.
Acknowledgments
This work was supported by the FAPESB and CNPq. K. M. M. is grateful to CAPES for research fellowship. The authors also thank M. G. A. Korn for support and insumes in ICP OES determinations.
References
1. Veiga, A.; Lopes, A.; Carrilho, E.; Silva, L.; Dias, M. B.; Seabra, M. J.; Borges, M.; Fernandes, P.; Nunes, S.; Perfil de Risco dos Principais Alimentos Consumidos em Portugal; Autoridade de Segurança Alimentar e Económica: Lisboa, Portugal, 2009. 2. Franco, B. D. G.; Landgraf, M.; Microbiologia dos Alimentos,
1a ed.; Atheneu: São Paulo, Brazil, 2008.
3. Silva, N.; Junqueira, V. C. A.; Silveira, N. F. A.; Taniwaki, M. H.; Santos, F. R. S.; Gomes, R. A. R.; Okazaki, M. M.; Manual de Métodos de Análise Microbiológica de Alimentos, 3ª ed.; Livraria Varela: São Paulo, Brazil, 2007.
5. ATSDR, Agency for Toxic Substances and Disease Registry; The Priority List of Hazardous Substances that will be the Subject of Toxicological Profiles; ATSDR: Georgia, Atlanta, 2013. Available at http://www.atsdr.cdc.gov/SPL/index.html, accessed in October 2016.
6. Machado, S. L.; Ribeiro, L. D.; Kiperstok, A.; Botelho, M. A. B.; Carvalho, M. F.; Eng. Sanit. Ambiental 2004, 9, 140. 7. Camilo, V. M. A.; Nunes, F. F. V.; da Silva, D. F.; da Silva, I. M.
M.; de Oliveira, F. S.; Santana, J. M.; Demetra 2016, 11, 195. 8. Camilo, V. M. A.; Santana, J. M.; Nunes, F. F. V.; da Silva, I.
M. M.; de Oliveira, F. S.; Campiolo, S.; O Mundo da Saúde
2016, 40, 51.
9. McDaniel, W.; EPA Method 200.3. Sample Preparation Procedures for Spectrochemical Determination of Total Recoverable Elements in Biological Tissues, 1991.
10. Oreste, E. Q.; de Jesus, A.; de Oliveira, R. M.; da Silva, M. M.; Vieira, M. A.; Ribeiro, A. S.; Microchem. J. 2013, 19, 5. 11. Virga, R. H. P.; Geraldo, L. P.; Santos, F. H.; Ciência e
Tecnologia dos Alimentos 2007, 27, 779.
12. Rincón, V. G.; Ginestre, P. M.; Romero, A. S.; Castellano, G. M.; Ávila, R. Y.; Kasmera 2010, 38, 97.
13. Carvalho, A. C. F. B.; Cortez, A. L. L.; Salotti, B. M.; Bürger, K. P.; Vidal-Martins, A. M. C.; Arq. Inst. Biol. 2005, 72, 303. 14. Agência Nacional de Vigilância Sanitária (ANVISA);
Resolução RDC No. 12, de 2 de janeiro de 2001, Aprova Regulamento Técnico sobre Padrões Microbiológicos para Alimentos; D.O.U. No. 10 jan. 2001, 2001, Brazil.
15. Santos, Y. O.; Almeida, R. C. C.; Guimarães, A. G.; Almeida, P. F.; Cienc. Tecnol. Aliment. 2010, 30, 1083.
16. Singh, G.; Vajpayee, P.; Ram, S.; Shanker, R.; Environ. Sci. Technol. 2010, 44, 6475.
17. Figueiredo, A. M. F.; Ceballos, B. S. O.; Sousa, J. T.; Araújo, H. W. C.; Rev. Bras. Eng. Agríc. Ambient. 2005, 9, 322. 18. Dósea, R. R.; Marcellini, P. S.; Santos, A. A.; Ramos, A. L. D.;
Lima, A. S.; Cienc. Rural 2010, 40, 441. 19. Moretti, C. L.; Hortic. Bras. 2003, 21, 2.
20. Zonta, G.; Souza, D. C.; Costa, M. R.; Bonesi, G.; Costa, R. C.; Alegro, L. C. A.; Santana, E. H. W.; UNOPAR Cient., Cienc. Biol. Saude 2013, 15, 377.
21. Vieira, T. B.; Pereira, V. L. A.; Franco, R. M.; Nascimento, E. R.; Silva, R. C. F.; Tortelly, R.; Rev. Bras. Med. Vet. 2014, 36, 144.
22. Lorenzon, C. S.; Gatti Junior, P.; Nunes, A. P.; Pinto, F. R.; Scholten, C.; Honda, S. N.; Amaral, L. A.; Arq. Inst. Biol. 2010,
77, 617.
23. Seibel, N. F. In Aves e Ovos; de Souza-Soares, L. A.; Siewerdt, F., eds.; Ed. Da Universidade UFPEL: Pelotas, Brazil, 2005, p. 77.
24. Vaz, A. B. S.; Yatsuyamagi, S. E.; Miyagusku, L.; Borba, H.; Souza, P. A.; Higiene Alimentar 2012, 26, 138.
25. Machado, S. S.; Bueno, P. R. M.; Oliveira, M. B.; Moura, C. J.; Rev. Bras. Produtos Agroindustriais 2009, 11, 191.
26. Agência Nacional de Vigilância Sanitária (ANVISA); Resolução RDC No. 42, Aprova Regulamento Técnico MERCOSUL sobre Limites Máximos de Contaminantes Inorgânicos em Alimentos, de 29 de agosto de 2013, Brazil.
27. Kabata Pendias, A.; Mukherjee, B. A.; Trace Elements from Soil to Human; Springer: New York, 2007.
28. Magna, G. A. M.; Machado, S. L.; Portella, R. B.; Carvalho, M. F.; Quim. Nova 2013, 36, 989.
29. Bernstein, M.; Woods, M.; Cilantro, that Favorite Salsa Ingredient, Purifies Drinking Water; American Chemical Society News, 2013. Available at http://www.acs.org/content/ acs/en/pressroom/newsreleases/2013/september/cilantro-that-favorite-salsa-ingredient-purifies-drinking-water.html, accessed in October 2016.
30. Tavares, T. M.; Carvalho, F. M.; Quim. Nova 1992, 15, 147. 31. Oymak, T.; Tokalıoglu, S.; Yılmaz, V.; Kartal, S.; Aydın, D.;
Food Chem. 2009, 113, 1314.
32. Lopes, M. V.; Korn, M.; Pereira, M. G.; Santana, E. P.; Oliveira, F. S.; Korn, M. G. A.; J. Braz. Chem. Soc. 2007, 18, 703. 33. Molin, F. D.; Paoliello, M. M. B.; Capitani, E. M.; Rev. Bras.
Toxicol. 2006, 19, 71.
34. Yokel, R. A.; Lasley, S. M.; Dorman, D. C.; J. Toxicol. Environ. Health 2006, 9, 63.
35. Santos, L. F. P.; Trigueiro, I. N. S.; Lemos, V. A.; Furtunato, D. M. N.; Cardoso, R. C. V.; Food Control 2013, 33, 193. 36. Rocha, G. O.; Guarieiro, A. L. N.; Andrade, J. B.; Eça, G. F.;
Aragão, N. M.; Aguiar, R. M.; Korn, M. G. A.; Brito, G. B.; Moura, C. W. N.; Hatje, V.; Rev. Virtual Quim. 2012, 4, 583.
37. Sanches Filho, P. J.; Fonseca, V. K.; Holbig, L.; Ecotoxicol. Environ. Contam. 2013, 8, 105.
38. Waegeneers, N.; Steur, H.; Temmerman, L.; Steenwinkel, S. V.; Gellynck, X.; Viaene, J.; Sci. Total Environ. 2009, 407, 4438.
39. United States Department of Agriculture, Foreign Agricultural Service; China - People Republic National Food Safety Standard - Maximum Levels of Contaminants in Food, 2010.
40. Soares, I. A.; Flores, A. C.; Mendonça, M. M.; Barcelos, R. P.; Baroni, S.; Arq. Inst. Biol. 2011, 78, 341.
41. Wang, J.; Chen, C.; Biotechnol. Adv. 2009, 27, 195.
Submitted: August 26, 2016