Article
Printed in Brazil - ©2017 Sociedade Brasileira de Química0103 - 5053 $6.00+0.00*e-mail: [email protected]
Electrodeposition Study of Ni Coatings on Copper from Choline Chloride-Based
Deep Eutectic Solvents
Amanda S. C. Urcezino, Luis P. M. dos Santos, Paulo N. S. Casciano, Adriana N. Correia and Pedro de Lima-Neto*
Departamento de Química Analítica e Físico-Química, Centro de Ciências, Universidade Federal do Ceará, Bloco 940, Campus do Pici, 60440-900 Fortaleza-CE, Brazil
Nickel was electrodeposited from choline chloride (ChCl)-based deep eutectic solvents (DESs) containing ethylene glycol (EG) and urea (U) on Cu substrate. The influence of the temperature and of DESs nature was evaluated. The diffusion coefficients of nickel varied from 2.2 × 10⁻⁹ to
3.7 × 10⁻⁸ cm2 s−1 for ChCl:2U and from 1.3 × 10⁻⁸ to 5.8 × 10⁻⁸ cm2 s−1 for ChCl:2EG with increasing
temperature. The nucleation process of Ni on Cu at 70 °C was determined as instantaneous in ChCl:2EG and progressive in ChCl:2U using Scharifker and Hills model. The SEM characterization showed that with increasing temperature, more compact coatings were obtained. Linear polarization and electrochemical impedance spectroscopy were used to evaluate the corrosion performance of the obtained deposits in 3.5% NaCl. The coatings were more protective as higher the temperature of deposition, with polarization resistance (Rp) values from 3.53 to 19.11 kΩ cm2.
Keywords: nickel, electrodeposition, nucleation, polarization, electrochemical impedance
spectroscopy
Introduction
Nickel (Ni) is known to enhance corrosion resistance of metallic materials,1 which makes it largely applicable in
industry in order to improve the corrosion performance of various alloys including stainless steels and high Ni alloys manufacturing, as well as its application as electrodeposited coatings onto different metallic substrates.2,3 In the case of
the industrial Ni electroplating process, the most traditional plating solution is based on the use of the aqueous Watt’s bath.1,2,4,5 However, electrodeposition of metals and alloys
from aqueous solution is strongly influenced by hydrogen evolution reaction. For instance, the parallel production of hydrogen decreases the electrodeposition efficiency, causing deleterious effects to the corrosion resistance of the electrodeposited coatings, such as the hydrogen embrittlement. In addition, it is unexceptional the use of additives and complexing agents in industrial electroplating process in order to decrease the gas production and also to stabilize the metallic ions in the plating solutions, which lead to a large production of polluting waste water from industrial baths related to aqueous solutions application.6-11
So, in order to avoid the disadvantage related above with the
electrodeposition in aqueous medium, the interest to obtain and to comprehend the metals and alloys electrodeposition from non-aqueous solutions is rising.
Ni and its alloys have been studied in many non-aqueous systems, especially in ionic liquids and deep eutectic solvents (DESs) and applied for corrosion protection, catalysis and magnetic devices.12-22 Particularly, the
DESs have been largely studied for use in replacement of water,8,11,23-26 since they are biodegradable, easy to
prepare, low sensitive to humidity, besides having an electrochemical window larger than water.27-30 Among
DESs, special attention has been given to choline chloride (ChCl)-based ones and particularly to two of them, one formed by ChCl and ethylene glycol (ChCl:2EG) and other by ChCl and urea (ChCl:2U), both in a molar proportion of 1:2.31-35
However, there are some lacks in understanding nickel electrochemical behavior and nucleation/growth kinetics in DESs. In this context, a systematic study of voltammetric profile of nickel onto copper and a comparative study of the nucleation and growth of Ni onto Cu in different DESs has not been reported. So, in the present work two different systems ChCl:2EG and ChCl:2U containing NiCl2·6H2O were used in order to evaluate the influence
growth processes of Ni coating onto Cu surface and in the surface morphology of the obtained electrodeposits, as well. Additionally, the anticorrosive properties of the obtained Ni electrodeposited coatings were evaluated in 3.5% NaCl by linear polarization and electrochemical impedance spectroscopy techniques.
Experimental
Choline chloride (Sigma-Aldrich®, > 98%), urea
(Sigma-Aldrich®, 99.0-100.5%) and ethylene glycol
(Sigma-Aldrich®, 99.8%) were all used as received.
DESs solutions were formed by the mixture of the two components in a molar ratio of 1ChCl:2U or 1ChCl:2EG at 80 °C until obtaining a homogeneous, colorless and transparent liquid. The solutions containing nickel ions were prepared by addition of 0.2 mol L−1 NiCl
2·6H2O (P.A.
97%, VETEC®) to the DESs until a homogeneous green
liquid was obtained. The water content of neat DESs and electroplating solutions was determined by Karl Fischer coulometric titration using a Titrino Coulometer model 756 from Metrohm® and it was less than 1% for all tested
samples.
Ultraviolet and visible spectroscopy (UV-Vis) measurements were carried out for each DES and for 5 × 10⁻³ mol L−1 of NiCl
2·6H2O in ChCl:2U and ChCl:2EG
at 22 ± 1 °C using a PerkinElmer® spectrometer model
Lambda 25 with 1 cm quartz cells.
Electrochemical experiments were carried out using an Autolab® PGSTAT 128N potentiostat/galvanostat,
controlled with NOVA® software. A heated water-jacketed
cell of 30 mL was used for DESs experiments with a conventional three-electrode setup. For aqueous medium, a three-electrode conventional electrochemical cell with a volume of 80 mL was used.
In electrochemical experiments, the working electrode was a copper disc with 0.03 cm2 of geometric area. A
Pt gauze, with an exposed area greater than that of the working electrode, was used as counter electrode and an Ag wire was used as the quasi-reference electrode in DES and an Ag|AgCl|Cl− (saturated KCl) was used as reference
electrode for the measurements carried out in aqueous medium. Experiments of cyclic voltammetry were carried out in the absence and in the presence of 0.2 mol L−1
NiCl2·6H2O in potentials more negative than −0.40 V to
avoid oxidation of Cu substrate in anodic scan.36 For neat
DESs, the potential range was from −0.40 to −1.50 V and the sweep rate was 10 mV s−1, varying the temperature
from 25 to 70 °C. To evaluate the influence of temperature on nucleation loop of Ni onto Cu substrate, scans were recorded at 25, 45 and 70 °C with a sweep rate of 10 mV s−1,
starting at −0.40 V and reversing the scan as soon as the nickel reduction wave has formed. Current transients were obtained by chronoamperometry at 70 °C for nucleation and growth studies. Chronoamperometry experiments at large overpotentials were carried out to calculate diffusion coefficients of nickel in both DESs by Cottrell’s equation at 25, 45 and 70 °C.
Ni electrodeposits were obtained under galvanostatic control using Cu discs with 0.2 cm2 of geometric exposed
area. A current density of 1 mA cm−2 was applied for
3600 s in order to obtain Ni coatings at 25, 45 and 70 °C in both DESs. Prior to each experiment, Cu electrodes were abraded with SiC paper up to 1200, degreased with 10% NaOH aqueous solution, activated with 10% HCl solution, rinsed with Milli-Q® grade water and dried with heated air.
Polarization curves and impedance spectra were obtained in aqueous 3.5% NaCl (VETEC®) after 3600 s of
open circuit potential stabilization using Cu discs with the Ni galvanostatic electrodeposits as working electrodes at 22 ± 1 °C. Linear polarization experiments were carried out at 1 mV s−1 and electrochemical impedance spectroscopy (EIS)
data were acquired in the frequency range from 10 kHz to 10 mHz with an AC sinusoidal wave of 10 mV of amplitude. The equivalent electric circuit (EEC) analysis was carried out in order to fit the EIS data. The choice of best fit was based on the lowest number of circuit’s components, χ2 error equal
to or minor than 0.001 and up to 5% of errors associated with circuit’s components.
The surface morphology of the Ni electrodeposited coatings was analyzed by FEI-Quanta 450 FEG microscope for characterization of Ni deposits.
Results and Discussion
UV-Vis spectroscopy analysis
Figure 1 displays the UV-Vis spectra obtained for both neat DESs and for 5 × 10⁻³ mol L−1 NiCl
2·6H2O in ChCl:2U
and in ChCl:2EG.
Firstly, this figure shows that adsorption peaks are absent in the spectra obtained for both neat DESs. On the other hand, the spectrum obtained with NiCl2·6H2O dissolved in
ChCl:2EG presents three bands centered at 412, 690 and 750 nm, while the achieved in ChCl:2U presented two bands, centered at 360 and 580 nm. Abott et al.18 reported bands centered in 425 and 655-715 nm for NiCl2·6H2O in ChCl:2EG
which corroborates with our results. Gu and Tu,37 studying
the thermochromic behavior of chloro-nickel(II) species in DESs, obtained UV-Vis spectra with a band at around 420 nm and at least three bands in the range of 600-800 nm for 0.05 mol L−1 NiCl
range from 30 to 70 °C. In ChCl:2U, these authors observed one band at around 400 nm and two bands in the range of 600-850 nm for 0.1 mol L−1 NiCl
2·6H2O with temperature
varying from 29 to 72 °C.37 Zhang et al.38 also observed bands
in the ranges of 350-500 nm and 600-800 nm for the UV-Vis absorption spectrum of NiCl2 in aqueous medium. Also other
similar spectra were obtained by many authors for NiII with
different ligands and/or solvents, like nitrate NiII complex in
ionic liquid,39 5,7,12,14-tetramethyldibenzo-[b,i][1,4,8,11]
tetraazacyclotetradecahexenate NiII complex in chloroform40
and various NiII complexes in aqueous solutions.41-44 These
bands have been explained by the ligand field theory and have been assigned as characteristic of NiII d-d transitions,38,43,45-48
since NiII forms d8 complexes. Tanabe and Sugano49 diagrams
for d8 electronic configuration in octahedral ligand field can
be used to predict the allowed transitions for the complexes in study. According to these, there are three allowed transitions,
3A
2g(F) →3T2g(F), 3A2g(F) →3T1g(F) and 3A2g(F) →3T1g(P),
which lead to a prediction of up to three bands in the UV-Vis spectrum for NiII complexes.45,49 The bands observed in
412 nm in ChCl:2EG and in 360 nm in ChCl:2U can be attributed to the 3A
2g(F) → 3T1g(P) transition.43,45,49
Bands in the region of 550-800 nm can be attributed to
3A
2g(F) →3T1g(F) transition.38,43,49 Moreover, in this range, a
split in the band could occur, due to a spin-orbit coupling that mixes the 3T
1g(F) and 1Eg states.38,43 This split was observed
in ChCl:2EG but not in ChCl:2U spectrum. Lastly, the difference in the wavelengths of the obtained bands in each solvent indicated that the transitions in ChCl:2U involve more energy than that occurring in ChCl:2EG, which was confirmed by the green tones of these solutions, being a pale one to the ChCl:2EG and a more intense green in ChCl:2U. Griffiths and Scarrow50 reported the formation of complexes
of the type Ni(EG)x2+, NiCl(EG)y+ and NiCl42– using ethylene
glycol as solvent and adding chloride with different salts. According to them, x is a number between 3 and 6 and y is
between 3 and 5, since EG can act as a bidentate ligand.50
Sharma et al.51 obtained [Ni(U)
6]SO4·H2O and [[Ni(U)6]
NO3·H2O]− complexes by adding an aqueous solution of urea
to a solution containing Ni2+ ions in water. So, the obtained
bands in Figure 1 can be related to the formation of NiII
complexes with ethylene glycol and urea, with or not Cl− in
the structure, for each corresponding DES medium.
Electrochemical characterization of the electrolytes
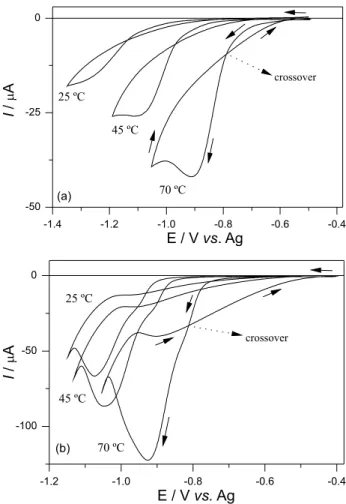
Figure 2 shows the cyclic voltammograms obtained at 10 mV s−1 for neat ChCl:2U (a) and ChCl:2EG (b) at
different temperatures.
For both neat DESs, a pronounced increase in the cathodic current occurs at potentials more negative than −1.0 V, with the potential increasing with decreasing temperature. Furthermore, a well-defined cathodic peak was displayed in all obtained cyclic voltammograms obtained in ChCl:2U solvent. An analogous behavior was found
Figure 1. UV-Vis spectra obtained for both neat DESs and for
5 × 10⁻³ mol L−1 NiCl
2·6H2O in ChCl:2U and ChCl:2EG at 22 ± 1 °C.
Figure 2. Cyclic voltammograms obtained for neat ChCl:2U (a) and
by Yue et al.29 studying the electrochemical behavior of ChCl:2U. These authors demonstrated that these processes was associated with choline cation decomposition forming triethylamine (at −1.2 V, 100 °C) and hydrogen (at −1.4 V, 100 °C).29 However, the mentioned process occurring
before the abrupt increase in current is very discrete to be related to choline cation decomposition, because the concentration of this chemical is high. So, the hypothesis of this process be related to water content in the ChCl:2U was tested by the addition of known amounts of water to this DES at 70 °C. These results are shown in Figure 3.
From Figure 3, it can be seen that increasing the amount of added water to the ChCl:2U leads to an increase in currents of the mentioned process, confirming that it is related to water. Nevertheless, the changing in currents is relatively low when compared to the amount of water added, indicating little influence in currents with increasing water amounts. In fact, Shah and Mjalli52 concluded that amounts
of water minor than 5% did not influence ChCl:2U physical properties, like melting point and viscosity. So, once the water content of all solutions used in the present work was less than 1%, as determined by Karl-Fischer method, no significant changes in the physical properties of the DESs can be assured. Additionally, the similarity of the morphology of the obtained deposits with data published in literature for Ni from DESs or ionic liquids shows that no influence of this water content was detected in the electrodeposits.20,53
Nucleation and growth studies
Figure 4 shows the voltammograms obtained for 0.2 mol L−1 NiCl
2·6H2O in both DESs at 10 mV s−1
with increasing temperature at a restricted potential range. It could be seen the so called nucleation loop54
for voltammograms recorded in both DES. It indicates that nickel electrodeposition onto copper needs a certain overpotential for the initial nucleation and growth process.55
In ChCl:2U, the nucleation overpotential56 reduced from
320 to 210 mV with increasing temperature from 25 to 70 °C. In ChCl:2EG, these values varied from 380 to 360 mV in the same temperature range. As the nucleation overpotential decreases with increasing temperature, it can be inferred that rising the temperature favors nickel electrodeposition. Also, comparing the nucleation overpotential observed for each DES, those referring to ChCl:2U were always minor than in ChCl:2EG, indicating that nucleation and growth initiation was more favorable to occur in ChCl:2U than in ChCl:2EG.
It is important to note that in the presence of NiCl2·6H2O, for both media, discharge of solvent occurs
after nickel reduction, having no interference on this process. Besides, increasing temperature leads to a shift in onset potential towards less negative values and no additional process was observed with changing temperature. This means that with increasing thermal
Figure 3. Cyclic voltammograms obtained for ChCl:2U with different amounts of water. vscan = 10 mV s−1.
energy, less potential energy is required for nickel reduction to occur, which is in accordance with theoretical expectations. Also, for the same nickel concentration, electrode area and temperature, current values obtained in ChCl:2EG were always larger than that of ChCl:2U. It can be attributed to the difference of viscosity between these DESs. While viscosities of ChCl:2U vary from 950 mPa s at 25 °C to 42 mPa s at 70 °C, the range for ChCl:2EG is quite shorter, from around 37 mPa s at 25 °C to 10 mPa s at 70 °C.57-59 So, species and charge transports
are much more difficult in ChCl:2U than in ChCl:2EG at studied temperature range, leading the current observed in ChCl:2U to be lower than in ChCl:2EG.
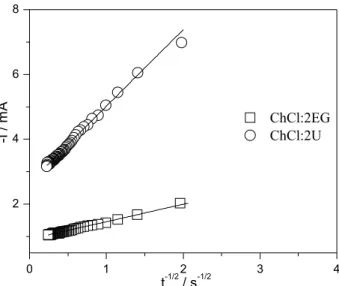
The Cottrell (equation 1) plots56 obtained from
chronoamperometry at 2.0 V and 70 °C in both DES are shown in Figure 5.
(1)
In equation 1, I is the current in A, z is the number of electrons involved in the process, F is the Faraday constant (C mol−1), A is the area of the electrode (cm2), D is the
diffusion coefficient (cm2 s−1), c is the bulk concentration
(mol cm−3) and t is the time (s).
In Figure 5, it can be noted that the obtained correlation coefficients for the |I| vs. t1/2 plots are in good agreement with the linearity predicted by Cottrell equation. So, they were used to calculate the diffusion coefficients of nickel in both DESs, as shown in Table 1.
From Table 1, a rise in diffusion coefficients with increasing temperature for both DESs can be seen, which is
in agreement with the decrease of viscosity of the solvent. At the same temperature, the diffusion coefficients obtained in ChCl:2EG are always higher than that for ChCl:2U, as expected by early explanation on viscosity.
The nucleation and growth processes of nickel onto copper substrate were studied in detail by chronoamperometry at 70 °C. The plots of current-time transients are presented in Figures 6a and 6b for ChCl:2U and ChCl:2EG, respectively. The shape of the transients was in accordance with the expected for the j vs. t relation when new metallic phase nucleation occurs.60 As can be
seen in Figure 6, the current density increased during a defined period till a maximum and, then, decreased due to overlapping of diffusion zones around the nuclei formed.2,60 Equations 2 and 3 are the basis of analyzing
experimental current-time transients obtained at a certain applied potential.
(2)
(3)
In equations 2 and 3, F, D and t have the same meaning as in equation 1. M is the molar mass of the deposit (g mol−1), ρ is the specific weight of the deposit (g cm−3).
For the progressive nucleation (equation 2), AN∞ is the
rate of nucleation each cm2per s. For the instantaneous
nucleation (equation 3), N is the number of nuclei formed per cm2.
According to current-time transients of Figure 6, the growth current density was dependent on the magnitude of the applied potential, since the former increases with increasing the latter. It implies that the AN∞ and N were
potential dependent, too. So, the major the potential, the major are the AN∞ and N and the shorter the time for
overlapping to occur, as observed in Figure 6.60
For current-time transients obtained in ChCl:2U, the current density j followed a linear correlation with t3/2 and
with t1/2 for those obtained in ChCl:2EG, which means
Figure 5. Cottrell plots obtained from chronoamperometry at 70 °C for
0.2 mol L−1 NiCl
2·6H2O in ChCl:2U and ChCl:2EG at large overpotential.
Table 1. Diffusion coefficients (D) calculated from Cottrell’s equation for Nickel at Cu substrate in ChCl:2U and ChCl:2EG at different temperatures
T / °C D / (cm
2 s−1)
ChCl:2U ChCl:2EG
25 2.2 × 10⁻⁹ ± 0.2 × 10⁻⁹ 1.3 × 10⁻⁸ ± 0.1 × 10⁻⁸
45 1.5 × 10⁻⁸ ± 0.2 × 10⁻⁸ 3.0 × 10⁻⁸ ± 0.2 × 10⁻⁸
that nickel nucleation is progressive in ChCl:2U and instantaneous in ChCl:2EG.60,61 Besides, the AN
∞ and N can
be easily calculated from the slope of the j vs. t3/2 or j vs. t1/2
plots for known D and concentration to a certain potential. Thus, the AN∞, and Ncalculated60,61 for the current-time
transients presented in Figure 6 are shown in Table 2, as well as the applied potential, −Estep, the maximum current
density jmax and maximum time tmax obtained.
From this, it can be noted that there is an increase in the rate of nuclei formation, for ChCl:2U, and in the number of nuclei, for ChCl:2EG, when potentials became more negative.60
Figure 7 displays the normalized coordinates of experimental current-time transients with the corresponding theoretical curves for progressive (equation 4) and instantaneous (equation 5) nucleation for ChCl:2U (Figure 7a) and ChCl:2EG (Figure 7b) according to Scharifker-Hills model.61
(4)
(5)
In equations 4 and 5, jmax is the maximum value
of the current transient in A cm−2; and t
max is the time
corresponding to jmax.
As it can be seen, the experimental curves fit well with the theoretical profile for progressive nucleation in ChCl:2U and for instantaneous nucleation theoretical curve in ChCl:2EG.
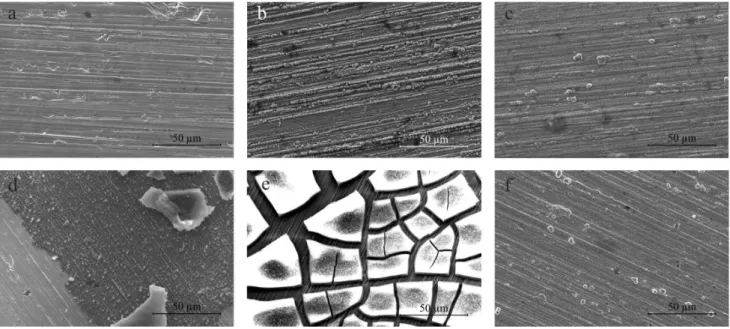
Morphological surface characterization
Figure 8 shows the SEM micrographs corresponding top view of Ni deposits obtained by galvanostatic mode from ChCl:2U (Figures 8a-8c) and ChCl:2EG (Figures 8d-8f) on copper substrate at 25 °C (Figures 8a and 8d), 45 °C (Figures 8b and 8e) and 70 °C (Figures 8c and 8f).
It can be observed that coatings obtained from ChCl:2U exhibited a similar morphology characteristic for thin films of Ni electrodeposited at 25, 45 and 70 °C.62 The Ni coatings
Figure 6. Current-time transients resulting from chronoamperometry
at 70 °C for 0.2 mol L−1 NiCl
2·6H2O in ChCl:2U (a) and ChCl:2EG (b).
Table 2. Analysis of the current-time transients considering the nucleation processes of nickel at copper substrate at 70 °C in ChCl:2U and ChCl:2EG System −Estep / V tmax / s −jmax × 103 / (A cm−2) AN∞ × 10−6 / (cm−2 s−1) N × 10−6 / (nuclei cm−2)
ChCl:2U
0.80 7.99 3.52 3.48 −
0.85 5.12 3.98 4.50 −
0.90 3.13 4.75 4.63 −
0.95 1.88 6.29 8.85 −
ChCl:2EG
0.70 10.44 2.67 − 1.40
0.75 3.43 4.33 − 2.88
0.80 1.64 6.01 − 4.18
0.85 0.99 8.39 − 6.52
were dense and adherent at all temperature studied, which were consistent with previous works.12,62 For Ni coatings
deposited at 25 °C, no nodule was observed in SEM micrograph, suggesting the formation of a very thin film. At 45 °C, the nodular morphology was revealed and, finally, for Ni deposits obtained at 70 °C, the nodular morphology was maintained, but the size of the nodules was noticeably smaller than that observed at 45 °C. These changes in morphology indicated that the increasing temperature favored the Ni nucleation onto Cu and that the coating was more homogeneously distributed when obtained at 70 °C.
On the other hand, the Ni coatings obtained from ChCl:2EG at 25, 45 and 70 °C can be seen in SEM micrographs presented in Figures 8d-8f, respectively. It is obviously seen that the surface morphology of Ni deposits changed significantly as the nature of DES at 25 and 45 °C, but not at 70 °C. For ChCl:2EG, a heterogeneous film with different morphologies was obtained at 25 °C. At 45 °C, the film presented many cracks like dry lake morphology. The crack formation in Ni films can be induced by the internal stress due to the rapid nucleation during the coating formation. 63 As evidenced in Figure 6, the current densities
obtained in transients for nickel in ChCl:2EG are always major than in ChCl:2U and the tmax in Table 2 is always
minor in ChCl:2EG than in ChCl:2U, which implies that the nucleation is faster in the former than in the latter and result in the internal stress accumulation on Ni deposits obtained from ChCl:2EG and consequently promote the cracks formation. These results are in accordance with the instantaneous nucleation observed for Ni electrodeposition in ChCl:2EG and not observed for ChCl:2U in the present study. Although, at 70 °C, no cracks were observed and the morphology was very similar with the deposit obtained in ChCl:2U.
Figure 7. Comparison of dimensionless experimental current-time transients with the theoretical models for three-dimensional nucleation in the 0.2 mol L−1 NiCl
2·6H2O in ChCl:2U (a) and ChCl:2EG (b) solutions at 70 °C.
Electrochemical corrosion tests
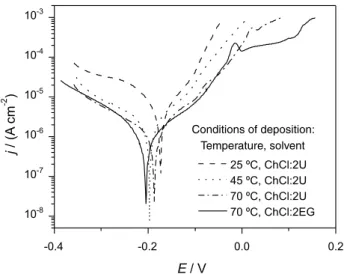
As the coatings obtained from ChCl:2EG at 25 and 45 °C were cracked, corrosion studies were carried out only for Ni deposits obtained at 70 °C in ChCl:2EG and for all obtained in ChCl:2U. Thus, Figure 9 shows the polarization curves for the Ni electrodeposits obtained at 25, 45 and 70 °C from ChCl:2U and at 70 °C from ChCl:2EG.
For all selected Ni electrodeposited coatings, the shapes of the polarization curves were in accordance with those already reported in the literature for Ni electrodeposits in chloride medium.64,65 In addition, with the increasing
of electrodeposition temperature, a more pronounced reduction in the slope of anodic branch was observed. So, it can be inferred that the higher the temperature, the higher the amount of Ni deposited and the improvement of the corrosion resistance of the coating with a more stable protective film. From previous calculation of diffusion coefficient of nickel in ChCl:2U (Table 1), the higher the temperature, the easier the diffusion of nickel ions from bulk DES to double layer region. It leads to a higher amount of nickel available at double layer region in a given time period to be deposited and, since the electrodeposition is diffusion controlled, the coating process is favored. Also, as the nucleation of Ni onto Cu from ChCl:2U is progressive (Figure 7a), it is directly related with the nucleation rate constant, that increases at higher temperatures.56 The
deposit obtained in ChCl:2EG had a behavior very similar to that obtained in ChCl:2U.
The values of polarization resistance (Rp), corrosion
current (jcorr) and corrosion potential (Ecorr) obtained for
polarization curves are in Table 3. From that, Rp values
rise with increasing deposition temperature and the Rp
value for the deposit obtained from ChCl:2EG is in the same order of magnitude for that obtained from ChCl:2U. Values of jcorr are coherent, since they are major when
Rp is minor. The slight difference in the Ecorr values is in
accordance with the unchanged chemical nature of the obtained deposits.
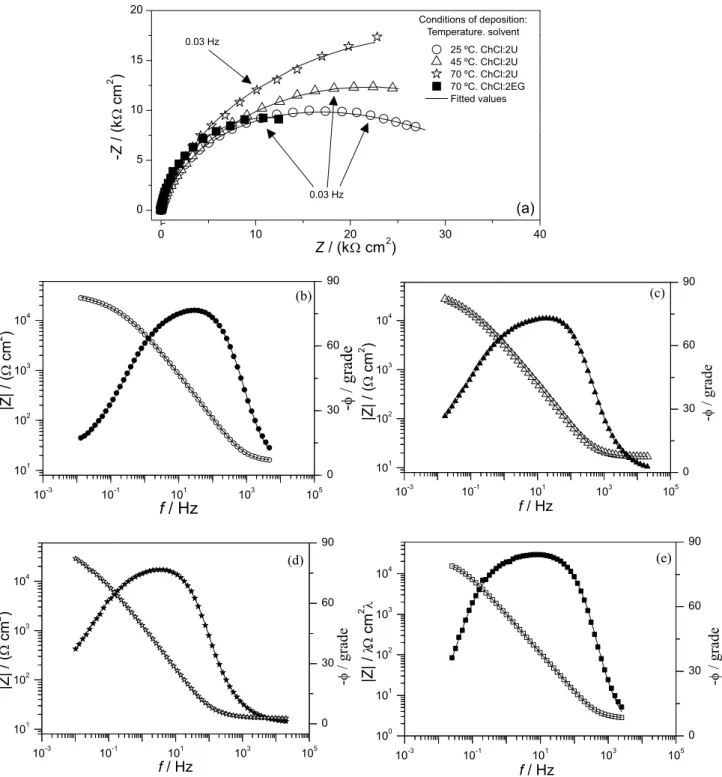
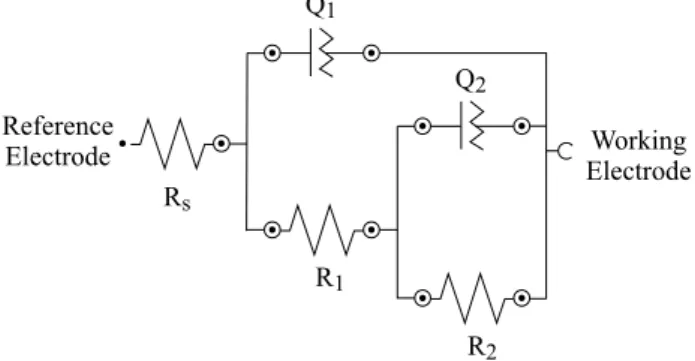
Figure 10 shows the Nyquist (Figure 10a) and Bode (Figures 10b-10e) plots obtained for the Ni electrodeposits obtained at 25, 45 and 70 °C in ChCl:2U and at 70 °C in ChCl:2EG, while the equivalent circuit used to fit the impedance data is shown in Figure 11. In Figure 10, the fitting values correspond to the solid lines, while the values of EEC components, obtained from the best-fits, are presented in Table 4. To best fit the coating surface and its non-ideal capacitive response, it was necessary the introduction of the non-ideal constant phase element (CPE) in the EEC. The impedance of CPE is defined according to equation 6, where Q is the effective CPE coefficient, ω
is the angular frequency and n is an adjustable parameter between −1 and 1.66 Characteristic values to −1, 0, 0.5 and
1 corresponds to inductor, resistor, Warburg impedance and capacitor, respectively.67,68
(6)
EIS diagrams presented a better fit with two time constants for Ni coatings.66,68,69 The appearing of more
than one time constant can be related with the formation of corrosion products on electrode surface during experiment, like as Ni oxides, which responses were quite different from the electrodeposited Ni.70,71 The existence of two time
constants in the impedance diagrams can be better noted in the Bode diagrams (Figures 10b-10e), since the fversusϕ
plots showed a broad maximum which is characteristic for a system with two closely spaced time constants.68
The elements used in the equivalent circuits for nickel were as follows: Rs is the resistance of the 3.5% NaCl
Figure 9. Linear polarization curves obtained in 3.5% NaCl at room temperature (22 ± 1 °C) of Ni deposits obtained from ChCl:2U at 25, 45 and 70 °C and from ChCl:2EG at 70 °C.
Table 3. The polarization resistance (Rp), corrosion current (jcorr) and corrosion potential (Ecorr) values obtained from polarization curves acquired at room temperature (22 ± 1 °C) for the Ni electrodeposits in 3.5% NaCl
Conditions of Ni
electrodeposition Rp / (kΩ cm2) jcorr / (A cm−2) Ecorr / V Solvent / Temperature
ChCl:2U / 25 °C 3.53 2.70 × 10⁻⁶ –0.17
solution, R1 is the charge transfer resistance, Q1 is the
constant phase element related to the capacitance of the double layer, R2 is the resistance of the corrosion products
and Q2 is the constant phase element associated to the
capacitance of the corrosion products film.
It can be noted that the capacitive loops increased with the increase of the temperature of the electrodeposition, indicating that the coatings conferred corrosion protection
to the substrate. The resistance values were listed in Table 4. Values of n close to 0.5 indicated that the processes presented diffusion characteristics at low frequencies.72
Conclusions
Temperature had a significant influence in DESs viscosity and in diffusion coefficients of nickel and in the
Figure 10. Nyquist (a) and Bode (b-e) plots obtained in 3.5% NaCl at room temperature (22 ± 1 °C) of Ni deposits obtained from ChCl:2U at 25 (a,b), 45
morphology of the obtained Ni electrodeposits. Increasing values of the temperature, Ni deposition was favored. The nature of the DESs also influenced in the characteristic of the deposits. In this case, ChCl:2EG led to a cracked coating at low temperatures and a homogeneous nodular coating at 70 °C. In ChCl:2U, no cracks were observed. All deposits obtained in ChCl:2U and the deposit obtained from ChCl:2EG at 70 °C presented corrosion protective properties. Polarization curves and EIS spectra revealed that the Rp values increased with increasing of the DESs
temperature during electrodeposition. It was in accordance with physical characterization, which showed more effective coatings at higher temperatures.
Acknowledgments
The authors gratefully acknowledge the CNPq (projects 303248/2012-2 and 474832/2013-9), CAPES, FINEP and FUNCAP (Brazil) for financial assistance. The authors would like to thank the Central Analítica-UFC/CT-INFRA/ MCTI-SISNANO/Pró-Equipamentos CAPES for technical support and Professor Luiz Gonzaga de França Lopes for useful UV-Vis discussions.
References
1. Uhlig, H. H.; Revie, R. W.; Corrosion and Corrosion Control -
An Introduction to Corrosion Science and Enginerring, 4th ed.;
John Wiley and Sons: Hoboken, USA, 2008.
2. Gamburg, Y. D.; Zangari, G.; Theory and Practice of Metal Electrodeposition; Springer New York: New York, USA, 2011.
3. http://www.insg.org/prodnickel.aspx, accessed in July 2016. 4. Wasekar, N. P.; Haridoss, P.; Seshadri, S. K.; Sundararajan, G.;
Surf. Coat. Technol.2016, 291, 130.
5. Ul-Hamid, A.; Quddus, A.; Saricimen, H.; Dafalla, H.; Mater. Res.2015, 18, 20.
6. Gileadi, E.; Physical Electrochemistry - Fundamentals, Techniques and Applications; Wiley-VCH Verlag GmbH and Co.: Weinheim, Germany, 2011.
7. Babu, B. R.; Bhanu, S. U.; Meera, K. S.; J. Environ. Sci. Health, Part C2009, 27, 155.
8. Simka, W.; Puszczyk, D.; Nawrat, G.; Electrochim. Acta2009,
54, 5307.
9. Fu, F.; Wang, Q.; J. Environ. Manage.2011, 92, 407. 10. Abbott, A. P.; Ryder, K. S.; König, U.; Trans. Inst. Met. Finish.
2008, 86, 196.
11. Smith, E. L.; Trans. Inst. Met. Finish.2013, 91, 241.
12. Yang, H.; Guo, X.; Birbilis, N.; Wu, G.; Ding, W.; Appl. Surf. Sci.2011, 257, 9094.
13. Anicai, L.; Petica, A.; Costovici, S.; Prioteasa, P.; Visan, T.;
Electrochim. Acta2013, 114, 868.
14. Fashu, S.; Gu, C. D.; Wang, X. L.; Tu, J. P.; Surf. Coat. Technol.
2014, 242, 34.
15. Vijayakumar, J.; Mohan, S.; Anand Kumar, S.; Suseendiran, S. R.; Pavithra, S.; Int. J. Hydrogen Energy2013, 38, 10208.
16. Yanai, T.; Shiraishi, K.; Watanabe, Y.; Nakano, M.; Ohgai, T.; Suzuki, K.; Fukunaga, H.; IEEE Trans. Magn.2014, 50, 1.
17. Gong, K.; Hua, Y.; Xu, C.; Zhang, Q.; Li, Y.; Ru, J.; Jie, Y.;
Trans. Nonferrous Met. Soc. China2015, 25, 2458.
18. Abbott, A. P.; Ballantyne, A.; Harris, R. C.; Juma, J. A.; Ryder, K. S.; Forrest, G.; Electrochim. Acta2015, 176, 718.
19. Zhu, Y.-L.; Katayama, Y.; Miura, T.; J. Electrochem. Soc.2015,
162, D371.
20. Li, M.; Gao, B.; Shi, Z.; Hu, X.; Wang, S.; Li, L.; Wang, Z.; Yu, J.; Electrochim. Acta2015, 169, 82.
21. Zhang, Q.; Hua, Y.; Chin. J. Chem. Eng.2013, 21, 1397.
Table 4. Fitted values calculated from equivalent circuits of impedance measurements carried out at room temperature (22 ± 1 °C) for the Ni coatings in 3.5% NaCl
Conditions of Ni electrodeposition Rs / (Ω cm2) Q1 / (µF cm−2 sn−1) n1 R1 / (kΩ cm2) Q2 / (µF cm−2 sn−1) n2 R2 / (kΩ cm2) Solvent / Temperature
ChCl:2U / 25 °C 15.5 26.8 0.9 3.3 39.2 0.4 42.1
ChCl:2U / 45 °C 17.0 45.6 0.9 1.6 45.6 0.8 49.0
ChCl:2U / 70 °C 18.1 143.0 0.9 8.6 85.1 0.5 57.6
ChCl:2EG / 70 °C 16.0 168.3 0.9 5.5 62.8 0.5 19.8
Rs: resistance of the solution; Q1: constant phase element related to the capacitance of the double layer; R1: charge transfer resistance; Q2: constant phase element related to the capacitance of the corrosion products film; R2: resistance of the corrosion products.
22. Gu, C.; Tu, J.; Langmuir2011, 27, 10132.
23. Smith, E. L.; Abbott, A. P.; Ryder, K. S.; Chem. Rev.2014, 114,
11060.
24. Zhang, Q.; De Oliveira Vigier, K.; Royer, S.; Jérôme, F.; Chem. Soc. Rev.2012, 41, 7108.
25. Cojocaru, A.; Mares, M. L.; Prioteasa, P.; Anicai, L.; Visan, T.;
J. Solid State Electrochem.2015, 19, 1001.
26. Bougouma, M.; Van Elewyck, A.; Steichen, M.; Buess-Herman, C.; Doneux, T.; J. Solid State Electrochem.2013, 17, 527. 27. Radošević, K.; Cvjetko Bubalo, M.; Gaurina Srček, V.; Grgas,
D.; Landeka Dragičević, T.; Radojčić Redovniković, I.;
Ecotoxicol. Environ. Saf.2015, 112, 46.
28. Wen, Q.; Chen, J.-X.; Tang, Y.-L.; Wang, J.; Yang, Z.;
Chemosphere2015, 132, 63.
29. Yue, D.; Jia, Y.; Yao, Y.; Sun, J.; Jing, Y.; Electrochim. Acta
2012, 65, 30.
30. Nkuku, C. A.; LeSuer, R. J.; J. Phys. Chem. B2007, 111, 13271. 31. Wang, R.; Hua, Y.; Zhang, Q.; ECS Trans.2014, 59, 505.
32. Ghosh, S.; Roy, S.; Mater. Sci. Eng. B2014, 190, 104. 33. Zhang, J. L.; Gu, C. D.; Fashu, S.; Tong, Y. Y.; Huang, M. L.;
Wang, X. L.; Tu, J. P.; J. Electrochem. Soc.2015, 162, D1. 34. Chu, Q.; Liang, J.; Hao, J.; Electrochim. Acta2014, 115, 499.
35. Li, R.; Hou, Y.; Liang, J.; Appl. Surf. Sci.2016, 367, 449. 36. Abbott, A. P.; El Ttaib, K.; Frisch, G.; McKenzie, K. J.; Ryder,
K. S.; Phys. Chem. Chem. Phys.2009, 11, 4269. 37. Gu, C.-D.; Tu, J.-P.; RSC Adv.2011, 1, 1220.
38. Zhang, N.; Brugger, J.; Etschmann, B.; Ngothai, Y.; Zeng, D.;
PLoS One2015, 10, e0119805.
39. Melchior, A.; Gaillard, C.; Gràcia Lanas, S.; Tolazzi, M.; Billard, I.; Georg, S.; Sarrasin, L.; Boltoeva, M.; Inorg. Chem.2016,
55, 3498.
40. Ying, M.; Yuan, R.; Song, Y.-Q.; Li, Z.-Q.; Analyst1997, 122,
1143.
41. Mizushima, I.; J. Electrochem. Soc.1996, 143, 1978.
42. Wang, X.-C.; Cai, W.-B.; Wang, W.-J.; Liu, H.-T.; Yu, Z.-Z.;
Surf. Coat. Technol.2003, 168, 300.
43. Liu, W.; Migdisov, A.; Williams-Jones, A.; Geochim. Cosmochim. Acta2012, 94, 276.
44. Zhang, N.; Zeng, D.; Brugger, J.; Zhou, Q.; Ngothai, Y.; J. Solution Chem.2015, 44, 1320.
45. Shriver, D. F.; Atkins, P. W.; Overton, T. L.; Rourke, J. P.; Weller, M. T.; Armstrong, F. A.; Inorganic Chemistry, 4th ed.; Oxford
University Press: Oxford, United Kingdom, 2006.
46. Goldcamp, M. J.; Edison, S. E.; Squires, L. N.; Rosa, D. T.; Vowels, N. K.; Coker, N. L.; Krause Bauer, J. A.; Baldwin, M. J.; Inorg. Chem.2003, 42, 717.
47. Baho, N.; Zargarian, D.; Inorg. Chem.2007, 46, 299. 48. Eckert, N. A.; Bones, E. M.; Lachicotte, R. J.; Holland, P. L.;
Inorg. Chem.2003, 42, 1720.
49. Tanabe, Y.; Sugano, S.; J. Phys. Soc. Jpn.1954, 9, 753.
50. Griffiths, T. R.; Scarrow, R. K.; Trans. Faraday Soc.1969, 65, 3179.
51. Sharma, P.; Bhale, J.; Mishra, A.; Malviya, P.; J. Phys.: Conf. Ser.2014, 534, 12044.
52. Shah, D.; Mjalli, F. S.; Phys. Chem. Chem. Phys.2014, 16, 23900.
53. Abbott, A. P.; El Ttaib, K.; Ryder, K. S.; Smith, E. L.; Trans. Inst. Met. Finish.2008, 86, 234.
54. Fletcher, S.; Halliday, C. S.; Gates, D.; Westcott, M.; Lwin, T.; Nelson, G.; J. Electroanal. Chem. Interfacial Electrochem.
1983, 159, 267.
55. Zein El Abedin, S.; Giridhar, P.; Schwab, P.; Endres, F.;
Electrochem. Commun.2010, 12, 1084.
56. Greef, R.; Peat, R.; Peter, L. M.; Pletcher, D.; Robinson, J.;
Instrumental Methods in Electrochemistry; Halsted Press, a division of John Wiley and Sons: New York, USA, 1985. 57. Yadav, A.; Pandey, S.; J. Chem. Eng. Data2014, 59, 2221. 58. D’Agostino, C.; Harris, R. C.; Abbott, A. P.; Gladden, L. F.;
Mantle, M. D.; Phys. Chem. Chem. Phys.2011, 13, 21383. 59. Xing, S.; Zanella, C.; Deflorian, F.; J. Solid State Electrochem.
2014, 18, 1657.
60. Hills, G. J.; Schiffrin, D. J.; Thompson, J.; Electrochim. Acta
1974, 19, 657.
61. Scharifker, B.; Hills, G.; Electrochim. Acta1983, 28, 879.
62. Ali, M. R.; Rahman, M. Z.; Saha, S. S.; Indian J. Chem. Technol.
2014, 21, 127.
63. Gu, C. D.; You, Y. H.; Yu, Y. L.; Qu, S. X.; Tu, J. P.; Surf. Coat. Technol.2011, 205, 4928.
64. Magaña, C. R.; Ángeles, M. E.; Rodríguez, F. J.; Rev. Metal. (Madrid, Spain)2006, 42, 49.
65. Guo, X.; Wang, S.; Gong, J.; Guo, J.; Peng, L.; Ding, W.; Appl. Surf. Sci.2014, 313, 711.
66. Lvovich, V. F.; Impedance Spectroscopy - Applications to Electrochemical and Dielectric Phenomena; John Wiley and
Sons: Hoboken, USA, 2012.
67. Maocheng, Y. A. N.; Jin, X. U.; Libao, Y. U.; Tangqing, W. U.; Cheng, S. U. N.; Wei, K. E.; Corros. Sci.2016, 110, 23. 68. Orazem, M. E.; Tribollet, B.; Electrochemical Impedance
Spectroscopy; John Wiley and Sons: Hoboken, USA, 2008. 69. Tait, W. S.; An Introduction to Electrochemical Corrosion
Testing for Practicing Engineers and Scientists; PairODocs Publications: Racine, USA, 1994.
70. Esmailzadeh, S.; Khorsand, S.; Raeissi, K.; Ashrafizadeh, F.;
Surf. Coat. Technol.2015, 283, 337.
71. Meng, G.; Li, Y.; Shao, Y.; Zhang, T.; Wang, Y.; Wang, F.; Cheng, X.; Dong, C.; Li, X.; J. Mater. Sci. Technol.2016, 32, 465.
72. Umoren, S. A.; J. Mol. Liq.2016, 219, 946.
Submitted: August 16, 2016