Article
Printed in Brazil - ©2015 Sociedade Brasileira de Química 0103 - 5053 $6.00+0.00
A
*e-mail: [email protected]
#Programa de Pós-graduação em Ecologia e Biomonitoramento, Instituto
de Biologia, Universidade Federal da Bahia, Rua Barão de Jeremoabo, 147, 40170-115 Salvador-BA, Brazil
Bulk Atmospheric Deposition of Major Ions and Dissolved Organic Nitrogen in the
Lower Course of a Tropical River Basin, Southern Bahia, Brazil
Taiana G. Araujo,*,#,a Marcelo F. L. Souza,b William Z. de Melloc and Daniela M. L. da Silvad
aPrograma de Pós-graduação em Sistemas Aquáticos Tropicais and bDepartamento de Ciências Exatas e Tecnológicas, Laboratório de Biogeoquímica Marinha, Universidade Estadual de Santa
Cruz, Rodovia Jorge Amado km 16, 45662-900 Ilhéus-BA, Brazil
cDepartamento de Geoquímica, Instituto de Química, Universidade Federal Fluminense, Outeiro de São João Batista s/n, 24020-141 Niterói-RJ, Brazil
dDepartamento de Ciências Biológicas, Laboratório de Biogeoquímica Marinha, Universidade Estadual de Santa Cruz, Rodovia Jorge Amado km 16, 45662-900 Ilhéus-BA, Brazil
Major ionic constituents (Cl–, Na+, K+, Mg2+, Ca2+, NH
4+, NO3–, SO42–) and dissolved organic
nitrogen were determined, from September 2009 to January 2010, in bulk atmospheric deposition in the lower course of Cachoeira River, southern Bahia, Brazil, where studies on this theme are still absent. The high fluxes of Na+, Mg2+ and Cl– observed in the innermost sampling site evidence
the continuity of marine influence in the atmosphere of the city of Itabuna. Concentrations of H+,
Ca2+, SO
42– and NO3– denoted non-marine anthropogenic sources. The contributions of dissolved
organic and inorganic nitrogen were different between the evaluated sites. This region is still subject to little impact by anthropogenic emissions compared to other urban areas in Brazil, according to
estimates of atmospheric fluxes of SO42–, NO
3– and NH4+.
Keywords: atmospheric inputs, natural sources, anthropogenic emission
Introduction
The transference of gases, liquids and solids across the atmosphere-water and atmosphere-soil interfaces represents one of the major mechanisms of cycling and redistribution of various chemical compounds across the Earth’s surface and therefore exerts a key role in continental, coastal and oceanic biogeochemical processes.1 Rainwater contains primary dissolved chemical species, derived directly from air particles, coming mainly from marine spray and continental dust, such as chloride (Cl–), sodium (Na+), potassium (K+), magnesium (Mg2+) and calcium (Ca2+). Secondary chemical species, which originate from gaseous emissions and subsequent reactions into the atmosphere, include ions such as sulfate (SO42–), nitrate (NO3–) and ammonium (NH
4+).2 There are several natural and anthropogenic sources of these elements to the
atmosphere and different processes are involved in their availability and transport. These make the atmosphere an important diffuse source and a direct and significant input route of nutrients and pollutants into terrestrial and aquatic ecosystems.3
The atmosphere behaves as a major source and carrier of nitrogen (N) to several ecosystems. In this way, atmospheric input represents a significant component of the global N cycle, acting as a relatively fast and efficient mechanism by which the N released in a particular compartment of the planet can affect remote areas far from its source region.8 Atmospheric N is traditionally referred as oxidized N and reduced N. The oxidized N comes from emissions of nitrogen oxides (NO and NO2, referred as NOx) which rapidly react (hours) with rainwater to form nitric acid (HNO3), which in turn can react to form nitrate aerosol. It is also important to consider that as HNO3 is extremely soluble, it can be rapidly removed by collision with cloud droplets or ambient particles. The emissions of reduced N are basically dominated by ammonia gas (NH3), which represents a major base in the atmosphere and tends to react quickly and sometimes irreversibly, with acids like HCl, H2SO4 and HNO3.8 The chemical species and sources of organic N to the atmosphere, however, are not yet sufficiently understood. It is believed that the atmospheric fraction of dissolved organic nitrogen (DON) includes a large group of natural compounds from biogenic and oceanic emissions, such as amino acids, polypeptides and urea, and small amounts of synthetic compounds from anthropogenic emissions (e.g., agricultural activities and mainly burning of biomass).9,10
For many years estuaries and coastal seas have been subject of several studies on nutrient inputs as a possible cause for harmful eutrophication processes,11-14 especially because these are already enriched ecosystems since they naturally receive nutrients from many sources.15 Coastal waters are subject to the influence of nutrient inputs not only through the traditionally considered pathways (rivers, effluents and groundwater), but also through atmospheric deposition.13 Despite its importance and contribution, the atmosphere is often overlooked in studies of cycles, fluxes, budget and entry routes of nutrients and other chemical elements, due to sampling difficulties or because it is still considered a compartment of secondary importance.
In Brazil, the lack of studies related to atmospheric nutrient deposition is even more marked, with few studies concentrated in the states of São Paulo,16-18 Rio de Janeiro,1,3,19-21 Rio Grande do Sul22 and in the Amazon region.23-26 The objective of this study was to perform a first characterization of atmospheric deposition in the lower course of Cachoeira River and its estuary, in southern Bahia, northeast Brazil, where studies on this theme are practically absent. Consequently, the bulk deposition of major atmospheric ionic constituents (Cl–, Na+, SO
42–, K+, Mg2+ and Ca2+) were quantified, as well as the bulk deposition of total dissolved nitrogen (TDN), including
the inorganic (DIN: NO3– and NH4+) and organic forms (DON), which comprises reduced and oxidized organic compounds.27 The results were used to determine possible sources of this material to the atmosphere of this region.
Experimental
Site description
The south region of the state of Bahia (northeastern Brazil) comprises a drainage area with a series of small watersheds. The Cachoeira River watershed (Figure S1) has a drainage area of ca. 4,600 km2 located between parallels 14º42’S and 15º20’S and meridians 39º01’W and 40º09’W.28 The Cachoeira River runs across two major urban centers (Itabuna and Ilhéus) in its lower course, with a human occupation of approximately 600,000 inhabitants. Major environmental impacts are related to the discharge of industrial and domestic effluents (treated and in natura) directly to the waters of the river and estuary.29 The study area was the course of Cachoeira River between the cities of Itabuna and Ilhéus (Figure S1).
Sampling procedures
From September 2009 to January 2010, twenty weekly samplings of bulk atmospheric deposition (collectors exposed during seven days to dry and wet deposition) were conducted in four sampling sites distributed along the lower course of Cachoeira River (Figure S1): ITA, the farthest site from the sea, located in Itabuna city, at approximately 50 m from the river course and at an altitude of 80 m; UESC (ca. 11.2 km from ITA), mid site, located in the university campus near the Ilhéus/Itabuna highway, at an approximate distance of 200 m from the river course and at an altitude of 56 m; CZ (ca. 11.5 km from UESC) is located at the entrance of the city of Ilhéus, approximately 100 m from the river course, with an altitude of 45 m; and IOS (ca. 4.5 km from CZ), closest site to the coast, located at the mouth of Cachoeira River in the city of Ilhéus, with collectors placed at a height of about 16 m.
rates and/or rainwater content. A 1 mm mesh nylon net was installed at the lower mouth of the funnel, to prevent the entry of leaves and insects. Samples visibly contaminated by bird excreta were discarded. For sample preservation, ca. 150 mg of thymol [5-methyl-2-(propan-2-yl)phenol] were added to the collector flasks before they were taken to the field. In the weeks with little or no rainfall, ultrapure water was added to the collectors (about 100 mL) and the funnel was thoroughly rinsed to remove all particles that could have been attached to it. Rain volume (when present) and total volume (after ultrapure water addition) were recorded for subsequent calculations.
Analysis procedures
As soon as the samples arrived at the laboratory, pH and electrical conductivity were measured in unfiltered aliquots using a multiparameter WTW pH/Cond 340i/Set. Then, about 100 mL of the sample were filtered through 0.45 µm cellulose acetate membrane filters with diameter of 47 mm. Filtered aliquots were frozen until analysis.
The inorganic rainwater constituents (major ions) were determined by ion chromatography in a DIONEX ICS1000 chromatograph coupled to a conductivity detector. Columns IonPac CG12-A (dimension 4 × 50 mm), CS12-A (dimension 4 × 250 mm) and H2SO4 solution on 15 mmol L-1 as mobile phase (eluent) were used for analyzing cations (Na+, K+, Mg2+, Ca2+ and NH
4+). Anions (Cl–, NO
3– and SO42–) were separated in columns IonPac AG9-HC (dimension 4 × 50 mm) and AS9-HC (dimension 4 × 250 mm), using Na2CO3 solution on 9 mmol L-1 as eluent.
Calibration curves were obtained by dilution of DIONEX multielement standard solutions: combined five anions standard (P/N 037157), containing fluoride (20 mg L-1), chloride (30 mg L-1), nitrate (100 mg L-1), phosphate (150 mg L-1) and sulfate (150 mg L-1), designed for routine anion determinations and combined six cations standard-II (P/N 046070), containing lithium (50 mg L-1), sodium (200 mg L-1), ammonium (250 mg L-1), potassium (500 mg L-1), magnesium (250 mg L-1) and calcium (500 mg L-1) for cations determination.
Blanks were analyzed in every analytical batch, as well as one standard solution each ten samples, in order to control the chromatographic analytical precision. All blanks and standards were prepared and diluted with ultrapure water Milli-Q (Millipore, electrical resistivity 18.2 MΩ cm-1). The linearity of the calibration curves (r2) was around 0.99 for all ions. Quantification limits (LOQ) were calculated based on the calibration curve parameters and are presented in Table 1.
DON was calculated by determining the difference between TDN and DIN. TDN was determined according to Koroleff’s oxidative method, described by Grasshoff et al.31 which consists on the oxidation of all nitrogen species into nitrate by heating under low pressure a potassium persulphate (Merck) solution. The resulting nitrate was reduced to nitrite in a cadmium column and determined, after formation of a diazonium dye, by visible spectrophotometry (PerkinElmer Lambda EZ201) at 540 nm wavelength. Blanks were included in every oxidative procedure and analytical batch.
Calculations performed
Calculation of volume-weighted mean (VWM) concentrations
Concentration of chemical species varies due to differences in the volume of precipitated rain.1,5 One way to standardize the results, preventing the occurrence of very high concentrations in low rainfall situations and the dilution effects that are common in very intense rain, is to express the concentrations in volume-weighted means (VWM)17 (equation 1):
[X]VWM =([X] × V ) + ([X] × V ) + ... + ([X] × V )1 1 2 2 n n
(V + V + ... + V )1 2 n (1)
VWM was calculated by the sum of each species concentrations ([X]) found in the n samples multiplied by its respective volume (V), divided by the sum of all samples’ volumes. In samples where ultrapure water was added, due to the low volume of rain collected during the sampling week, total volume was used for calculations.
Calculation of atmospheric fluxes
Weekly atmospheric fluxes (Fweek in mol ha-1 week-1) and average monthly fluxes (Fmonth in mol ha-1 month-1) of the constituents were calculated using equations 2 and 3, respectively:
Fweek = ([X] × h) × 10-2 (2)
Fmonth = (ΣFweek × 30.4)/155 (3)
was multiplied by the average number of days in a month (365 days/12 months = 30.4 days per month) and divided by the total number of sampling days.
Calculation of excesses
The “excess” or “non-sea-salt” fraction is the parcel of each ion from sources other than sea-salt. It is usually calculated using sodium (Na+) as the reference element, since it is assumed that all Na+ present in the sample is from seawater5 (equation 4)
Xexc = [X] – {(X/Na+) × [Na+]} (4)
where [X] is the concentration of the ion of interest in the sample, (X/Na+) is the ion/sodium molar ratio in seawater and [Na+] is the sodium concentration found in the sample. For this study, the concentrations of the ion of interest in seawater were obtained from Riley and Chester.32
Results and Discussion
pH and electrical conductivity
The pH of bulk atmospheric deposition samples at the four sampling sites varied from 4.04 to 6.43 with overall
mean of 4.95 ± 0.51. 88% of the pH values were below
5.6, reference value resulting exclusively from dissolved atmospheric CO2 in water,19 and 53% were below 5.0, reference value considering the potential contribution of other acidic substances (e.g., HNO3–, H2SO42– and carboxylic acids) naturally present in the atmosphere.20 Mean pH values at the four sampling sites were as follows: 4.83 ± 0.34 (ITA), 4.96 ± 0.49 (UESC), 4.98 ± 0.57 (CZ)
and 5.03 ± 0.59 (IOS).
The average electrical conductivity values exhibited a decreasing gradient from the coastal toward the farthest sampling site from the sea: 66.8 µS cm-1 (IOS), 28.4 µS cm-1 (CZ), 17.9 µS cm-1 (UESC) and 13.5 µS cm-1 (ITA). This
pattern strengthens the influence and contribution of sea-salt aerosols over the composition of atmospheric deposition at the study area.
Concentration of major ions and dissolved organic nitrogen
Concentration values of all studied chemical species are summarized by sampling site in Table 1. In general, the arithmetic mean was greater than the VWM concentration, not only for the major ions, but also for DON, indicating that higher concentrations are usually associated with lower rainfalls.19,20
Table 1. Descriptive statistic for the major chemical constituents investigated in bulk atmospheric deposition samples collect from September 2009 to January 2010 at the lower course of Cachoeira River basin (Bahia, Brazil)
Sampling site Concentration / (µmol L
-1)
NH4+ Na+ K+ Ca2+ Mg2+ NO3– SO42– Cl– DON
ITA
VWMa 8.8 54.2 3.0 13.4 7.0 3.7 7.4 50.1 11.4
mean 7.6 48.4 3.4 17.7 6.3 3.7 8.2 47.9 15.8
SDb 7.2 29.4 1.4 10.6 3.0 2.3 3.4 19.4 13.1
minimum < LOQc 12.9 2.1 1.3 1.1 0.7 2.8 17.1 < LOQ
maximum 27.1 124 7.1 41.7 12.0 11.4 16.1 83.1 43.7
UESC
VWM 9.7 70.6 4.9 5.9 8.5 4.4 7.2 68.9 7.6
mean 7.3 70.9 5.3 6.8 8.2 4.5 7.5 72.1 13.8
SD 7.7 31.8 2.5 4.0 3.9 2.7 3.5 34.0 10.2
minimum 0.3 24.6 2.7 < LOQ 3.0 < LOQ 3.0 23.4 < LOQ
maximum 26.4 157 11.4 14.6 18.4 13.2 19.9 182 29.3
CZ
VWM 9.9 67.4 3.7 3.1 8.2 4.1 7.3 67.8 9.1
mean 9.9 85.6 4.5 5.5 10.6 4.9 9.6 87.3 12.1
SD 8.0 49.0 1.8 4.0 5.4 2.9 4.8 45.2 11.3
minimum < LOQ 26.9 1.4 < LOQ 2.6 1.7 3.7 28.4 < LOQ
maximum 25.7 180 7.5 11.5 20.9 11.6 20.2 175 38.1
IOS
VWM 6.0 279 8.1 11.5 31.3 3.9 19.1 299 14.0
mean 7.3 426 12.6 17.5 47.2 5.1 28.2 468 14.9
SD 11.0 317 8.4 15.1 36.2 3.9 18.0 351 12.9
minimum < LOQ 62.0 2.7 2.2 7.7 1.5 7.2 65.7 < LOQ
maximum 45.5 1,319 30.8 48.9 146 16.8 76.0 1,400 41.1
aVWM: volume-weighted mean; bSD: standard deviation; cLOQ: limit of quantification in µmol L-1, NH
4+ (0.012), Na+ (0.084), K+ (0.039), Ca2+ (0.260),
Mg2+ (0.043), NO
VWM concentrations of Na+ and Cl–, the two major sea-salt constituents, decreased steadily from IOS to CZ, and in lesser extent from the latter to ITA, indicating a considerable influence of sea-salt aerosols over IOS. Mg2+, SO42– and K+ showed similar patterns. In the case of Ca2+, the highest VWM concentration was found at ITA, the farthest sampling site from the coast, and the lowest at CZ, suggesting the influence of continental sources (natural or/and anthropogenic).2,33 The VWM concentrations of DIN were greater than those of DON, except at IOS. The highest VWM concentration of DON occurred at IOS and secondarily at ITA (sampling sites located at two large urban centers in the southern Bahia state). Distinctly, the highest concentrations of NH4+ were found at the intermediate sites (UESC and CZ), while NO3– exhibited VWM values fairly similar at the four sites.
The largest coefficient of variation (standard deviation and arithmetic mean) values were observed for NH4+ followed by DON, what can be associated to the several potential natural and anthropogenic sources of these species. Various authors also pointed out nitrogenous species as being some of the most sensitive constituents in atmospheric deposition samples,9,33,34 arguing that these species are subject to large concentration variability attributed to both, loss/consumption and increase due to internal reactions.5,11
Sea-salt and non-sea-salt contribution
Figure 1 shows the percentage contribution of the investigated ions over atmospheric deposition with respect
to their sea-salt and non-sea-salt (also called excess) sources, except Na+, which is attributed to be exclusively from sea-salt origin, and NH4+ and NO3–, which are not related to sea-salt at all. These calculations were relative to a mean seawater ion/Na+ ratio.32 It is important to highlight that the non-sea-salt sources can be either natural (marine and/or continental) or anthropogenic. The major natural sources include precursor compounds produced by microbiological processes taking place in terrestrial and aquatic systems, atmospheric chemical processes, soil dust and vegetation, while the anthropogenic sources comprise biomass burning, fossil fuel combustion, farming and agricultural activities, industrial processes and untreated sewage disposals.19,35
Na+ and Cl– were assumed to have originated exclusively from sea-salt aerosols at the four studied sites. Considering the Cl–/Na+ molar ratio in seawater (1.16), relative Cl– deficits were observed in bulk atmospheric deposition at the four sampling sites (Figure 1). The Cl–/Na+ ratios, calculated based on the VWM concentration values shown in Table 1, decreased gradually from 1.07 at the coastal site (IOS) to 0.92 at the most inland one (ITA). Accordingly, chloride relative deficit increased continuously from IOS to ITA, suggesting a Cl– loss or a Na+ increase in the atmospheric deposition landward.36
De Mello19 and De Souza et al.21 also found Cl– deficits in the rainwater of a coastal area of the metropolitan region of Rio de Janeiro and in atmospheric fine and coarse particles in São José dos Campos, respectively, attributing this result to a possible loss of this anion from sea-salt aerosol as volatile inorganic Cl gases.37 Alternatively,
additional continental Na+ sources (mainly soil dust) may lead to a decrease in the Cl–/Na+ ratio of atmospheric deposition, hence reflecting in the observed Cl– deficits.36 If that is the case, the non-sea-salt fraction of the other ions would be underestimated as well.
Results shown in Figure 1 also indicate that non-sea-salt contribution of SO42–, Mg2+, Ca2+ and K+ to the atmospheric deposition increased gradually from the coastal site (IOS) to the most inland one (ITA), suggesting continental influences, either natural or anthropogenic, or both.
Sulfate originated mainly from sea-salt aerosols, whose contribution ranged from approximately 60% (CZ and UESC) to almost 90% (IOS), except at ITA where the sea-salt contribution was 44%. In addition to sea-salt, another possible natural marine contribution of SO42– to the atmospheric deposition, especially at IOS, would be the SO42– formed from oxidation of dimethyl sulfide [DMS; (CH3)2S] in the atmosphere. Although there are no studies on this topic in the study area, it is known that this gas of biogenic origin may be released by ocean waters, since its origin is related to the decomposition of dimethylsulfoniopropionate [DMSP; (CH3)2S+CH
2CH2COO−], an osmotic regulator present in algae and marine microalgae.38 It is worth mentioning that sulfuric acid (H2SO4) is formed from both DMS and anthropogenic SO2 oxidation processes, consequently they contribute to acidification of aerosols and rainwater. The VWM concentrations of non-sea-salt SO42- at the lower course of the Cachoeira River basin varied from 2.3 µmol L-1 (IOS) to 4.1 µmol L-1 (ITA), which are lower
than values observed in the metropolitan regions of São Paulo,17 Rio de Janeiro19 and adjacent areas,1,39 however near and above, respectively, to the upper limit of non-sea-salt SO42− concentrations (0.6-2.8 µmol L-1) found in remote continental and oceanic regions.40
Mg2+ was mostly from sea-salt origin, presenting the smaller non-sea-salt percentage. Even at ITA, which presented the highest percentage of non-sea-salt Mg2+, sea-salt aerosols still accounted for 87% of its source. Non-sea salt contribution may be associated with biogenic sources, such as salts resulting from evapotranspiration of terrestrial vegetation (since Mg is a constituent of chlorophyll).24
K+ and Ca2+ presented the most substantial non-sea-salt contribution, especially at ITA where this fraction comprised approximately 60% and 90%, respectively. The non-sea-salt fraction of K+ is usually attributed to emissions of water-soluble particles directly from vegetation and biomass burning (vegetation fires).2,23,41 In a lesser extent, these processes contribute also to the non-sea-salt fraction of Ca2+ and Mg2+ (among others). Soil dust resuspension and cement manufacturing are considered the two major
sources of Ca2+ to the atmosphere in urban areas.18 The greater non-sea-salt Ca2+ found at ITA could be explained to some extent by the rapid growth of civil constructions taking place in last few years in the city of Itabuna. The highest VWM concentration of non-sea-salt Ca2+ found at ITA (12.2 µmol L-1) strengthens this hypothesis. IOS, which is characterized as a coastal-urban site (Ilhéus city), exhibited the second highest VWM concentration of non-sea-salt Ca2+ (5.4 µmol L-1), followed by UESC (4.4 µmol L-1) and CZ (1.6 µmol L-1).
Dissolved inorganic and organic nitrogen contribution
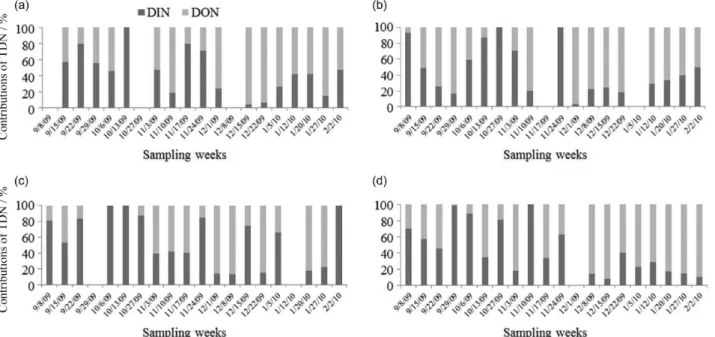
In most samples there was a higher contribution of DON compared to the inorganic nitrogen forms of TDN in the atmospheric deposition. However, a shift between each nitrogen form contribution was observed during the sampling period, with a greater contribution of DIN in the initial period and DON in the final weeks (Figure 2). DON values were below the method detection limit, in the weeks in which DIN accounted for 100% of the contribution. This may be due to the lower analytical detection limits of DIN components.
Based on results of bulk atmospheric deposition presented in Figure 2, DIN prevailed over DON at the intermediate sites and the opposite was observed for the sampling sites located in the two urban centers. DIN comprised 47, 64, 60 and 41% of TDN deposition at ITA, UESC, CZ and IOS, respectively. The highest VWM concentration of DON was found at the coastal-urban site, located in Ilhéus, where it comprised 59% of the TDN. DIN predominated at the intermediate sampling sites (UESC and CZ) located nearby the Ilhéus/Itabuna highway. Nevertheless, the relative distribution of DIN and DON varied spatial and temporally (Figure 2). A similar pattern was found by De Souza et al.42 in southeastern Brazil, with the relative contribution of DIN exceeding that of DON at the non-urbanized sites, but not at the coastal urban one.
Bulk deposition fluxes
Ions originating from sea-salt aerosols (mainly Cl–, Na+, Mg2+, K+ and SO
42–) presented higher accumulated fluxes (during the five months of collection) at IOS. Calcium had an accumulated flux in ITA as high as in IOS (Figures 3a and 3b).
During the five months of collection, accumulated fluxes of NO3– (Figure 3c) were the lowest among the three nitrogen species assessed in this study and for all the four collection sites, ranging from 17 to 25 mol ha-1. The lowest NO3– flux was found at ITA and the highest at UESC and IOS. NH4+ accumulated fluxes were higher and almost equal at the intermediate sites UESC and CZ, (approximately 60 mol ha-1) and lower at ITA and IOS, with values around 40 mol ha-1.
It is believed that NO3– fluxes may be associated with emissions of N oxides from cars that transit along the Ilhéus/Itabuna highway (BR 415). In contrast, NH4+ fluxes may be linked to NH3 emissions from small streams receiving untreated open sewers and/or from the sewage treatment plant (STP) of Ilhéus city located nearby this highway, between UESC and CZ, which returns the treated sewage to the estuarine portion of the Cachoeira River. Silva et al.43 reported high NH4+ concentrations (maximum 50 µmol L-1), high temperatures (above 25 °C) and high pH values (frequently above 8.0 during the morning) in surface waters of the estuarine portion of Cachoeira River near the STP, which may create propitious conditions for NH3 formation. These can be important NH3 sources to the atmosphere and can be responsible for the higher
Figure 2. Relative contribution of DIN and DON on the atmospheric deposition (on a weekly basis) of TDN per sampling site: (a) ITA; (b) UESC; (c) CZ and (d) IOS. The date presented represent the first collection day of the sampling week.
Figure 3. Total accumulated flux (considering the five collection months)
accumulated fluxes of NH4+ observed in these sites. The lowest NO3– accumulated fluxes found at all sites may be indicating less substantial sources of its precursor gases (NO and/or NO2) for the study area, when compared to sources of NH3 (the precursor of NH4+).8
Accumulated DON fluxes were approximately 90 mol ha-1 at IOS, followed by ITA, CZ and UESC with 70, 60 and 50 mol ha-1, respectively. Although the chemical forms and sources of organic N to the atmosphere are not yet sufficiently understood and there is still no consensus on the proportion of natural and anthropogenic contributions over such sources,9,10 the highest fluxes observed at the two sites located in urban centers, suggest that anthropogenic contributions of DON to the region’s atmosphere are perhaps considerable. De Souza et al.42 also found higher DON deposition in a coastal urban site when compared to forested inland sites, suggesting that DON deposition appears to be strongly influenced by marine and urban emissions. In this context, it is important to mention that although the cities of Ilhéus and Itabuna are not highly industrialized, they house some industries that may represent punctual pollution sources of relatively low intensity for the region. The industrial district of Ilhéus mainly consists of computer and food industries, and the latter are mostly geared for processing cocoa and milk for the production of chocolate. In Itabuna, industries are on clothing and footwear sectors. On the other hand, the high DON fluxes observed at IOS suggest some contribution of natural marine sources.
Mean monthly atmospheric fluxes
The highest mean monthly fluxes in mass unit (kg ha-1 month-1; Table 2) of Na+, Mg2+ and Cl– observed at
ITA, when compared to works performed in more internal regions,17,20 shows the extent and importance of marine influence in the atmosphere of Itabuna and perhaps even further into the continent.
The results of mean monthly fluxes found at IOS are close to those found by De Souza et al.1 in a study also conducted in a coastal region. Exceptions were higher SO42– and NO3– values found by De Souza et al.1 probably because their study area was close to a highly urbanized and industrialized region (the metropolitan region of Rio de Janeiro).
When compared to the other work presented in Table 2, the smaller fluxes of SO42–, NO
3– and NH4+ found in the present study suggest that the atmosphere of the lower course and estuary of Cachoeira River is still relatively little impacted by human activities that result in emission of precursor gases of these ions into the atmosphere.
Conclusions
Anthropogenic activities reflected in the composition of atmospheric deposition in the study area were: use of cement in construction, as a probable source of Ca2+ ; fossil fuels combustion as a source of SO42– and NO3–; and emissions from untreated sewage and from the estuarine waters of Cachoeira River as potential sources of NH3 into the atmosphere.
The highest contribution of DIN were observed in non-urbanized and vegetated areas near the highway along the Cachoeira River, while atmospheric deposition of DON was higher in urban areas, suggesting association with anthropogenic sources.
The atmosphere of the lower course of Cachoeira River still suffers little impact from emissions caused by
Table 2. Atmospheric deposition of major ions and DON in different regions of Brazil
Source Year Atmospheric deposition / (kg ha
-1 month-1)
Place Na+ K+ Ca2+ Mg2+ SO
42– Cl– NH4+ NO3– DON
This study 2009 1.45 0.14 0.62 0.20 0.28 2.06 0.12 0.05 0.19 Itabunaa
This studyb 2009 1.96 0.18 0.23 0.25 0.28 2.93 0.17 0.07 0.15 highwayc
This study 2009 8.20 0.39 0.59 0.96 0.78 13.6 0.11 0.07 0.25 Ilhéusd
De Mello19 2001 1.33 0.40 0.56 0.22 0.61 2.22 0.24 0.20 − Niteróie
Leal et al.17 2004 0.35 0.10 0.22 0.06 1.24 0.31 0.70 1.36 − São Paulof
De Mello20 2004 0.11 0.06 0.11 0.03 0.31 0.24 0.24 0.21 − Itatiaiag
De Souza et al.1 2006 5.20 0.39 0.33 0.73 0.95 10.1 0.13 0.25 − Ilha Grandeh
Rodrigues et al.39 2007 − − − − 0.88 − 0.74 0.31 − Serra dos Órgãosi
De Souza et al.42 2015 − − − − − − 0.29 0.33 0.83 Niteróij
aItabuna, ca. 40 km from the sea, bulk deposition; baverage values considering the fluxes of UESC and CZ chighway (BR 415), ca. 15 km from the sea,
bulk deposition; dIlhéus-BA, coastal region, bulk deposition; eNiterói, coastal region in the state of Rio de Janeiro, wet deposition only; fcentral region of
São Paulo, wet deposition only; gItatiaia National Park, boundary between the states of Rio de Janeiro and Minas Gerais, ca. 100 km from the sea, wet
deposition only; hIlha Grande-RJ, coastal region, bulk deposition; iSerra dos Órgãos, Teresópolis-RJ, bulk deposition; jcoastal urban site in the city of
anthropogenic activities, considering that the atmospheric fluxes of SO42–, NO
3– and NH4+ observed in this area are smaller than those reported in studies conducted in more urbanized/industrialized regions of Brazil.
Supplementary Information
Supplementary information (Figure S1 - study area location) is available free of charge at http://jbcs.sbq.org.br as PDF file.
Acknowledgements
This manuscript derived from the first author’s master thesis, who would like to thank Coordenação de Aperfeiçoamento de Pessoal de Nível Superior (CAPES) for the master’s scholarship grant, which represented an important financial support for this work.
References
1. de Souza, P. A.; de Mello, W. Z.; Maldonado, J.; Evangelista, H.;
Quim. Nova2006, 29, 471.
2. Berner, E. K.; Berner, R. In The Global Water Cycle: Geochemistry and Environment; Berner, E. K.; Berner, R., eds.; Prentice-Hall: New Jersey, USA, 1987, ch. 3.
3. Silva Filho, E. V.; Pedlowski, M. A.; Paiva, R. P.; Wasserman, J. C.; Lacerda, L. D. In Environmental Geochemistry of Coastal Lagoon Systems of Rio de Janeiro, Brazil; Knoppers, B. A.; Bidone, E. D.; Abrão, J. J., eds.; EDUFF: Niterói, Brazil, 1999, 71. 4. Dämmgen, U.; Erisman, W.; Cape, N.; Grünhage, L.; Fowler, D.;
Environ. Pollut. 2005, 134, 535.
5. Campos, V. P.; Costa, A. C.; Tavares, T. M.; Quim. Nova 1998,
21, 418.
6. Finlayson-Pitts, B. J.; Pitts Jr., J. N.; Chemistry of the Upper Atmosphere-Theory, Experimental and Applications; Academic
Press: San Diego, 2000.
7. Seinfeld, J. H.; Pandis, S. N.; Atmospheric Chemistry and Physics-from Air Pollution to Climate Change; John Wiley & Sons: Hoboken, 2006.
8. Jickells, T.; Biogeosciences Discuss.2006, 3, 183.
9. Cape, J. N.; Kirika, A.; Rowland, A. P.; Wilson, D. R.; Jickells, T.; Cornell, S.; Scientific World J. 2001, 1, 230. 10. Benítez, J. M. G.; Cape, J. N.; Heal, M. R.; Dijk, N.; Díez, A. V.;
Atmos. Environ. 2009, 43, 4087.
11. Boulart, C.; Flament, P.; Gentilhomme, V.; Deboudt, K.; Migon, C.; Lizon, F.; Schapira, M.; Lefebvre, A.; Estuarine, Coastal Shelf Sci. 2006, 69, 449.
12. Cornell, S.; Rendell, A.; Jickells, T.; Nature1995, 376, 243. 13. Jickells, T.; Science 1998, 281, 217.
14. Paerl, H. W.; Limnol. Oceanogr.1997, 42, 1154.
15. Berlinsky, N.; Bogatova, Y.; Garkavaya, G.; The Handbook of Environmental Chemistry, 5th ed.; Springer Verlag: Berlin, 2005. 16. Lara, L. B. L. S.; Artaxo, P.; Martinelli, L. A.; Victoria, R. L.;
Camargo, P. B.; Krusche, A.; Ayers, G. P.; Ferraz, E. S. B.; Ballester, M. V.; Atmos. Environ.2001, 35, 4937.
17. Leal, T. F. M.; Fontenele, A. P. G.; Pedrotti, J. J.; Quim. Nova
2004, 27, 855.
18. Conceição, F. T.; Sardinha, D. S.; Navarro, G. R. B.; Antunes, M. L. P.; Angelucci, V. A.; Quim. Nova2011, 34, 610. 19. de Mello, W. Z.; Environ. Pollut. 2001, 114, 235.
20. de Mello, W. Z.; Almeida, M. D.; Environ. Pollut. 2004, 129, 63.
21. de Souza, P. A.; de Mello, W. Z.; Mariani, R. L.; Sella, S. M.;
Quim. Nova 2010, 33, 1247.
22. Migliavacca, D. M.; Teixeira, E. C.; Machado, A. C. M.; Pires, M. R.; Quim. Nova2005, 28, 371.
23. Artaxo, P.; Orsini, C.; Nucl. Instrum. Methods Phys. Res. 1987,
B22, 259.
24. Artaxo, P.; Storms, H.; Bruynseels, F.; Van Grieken, R.;
J. Geophys. Res. 1988, 93(D2), 1605.
25. Artaxo, P.; Gatti, L. V.; Leal, A. M. C.; Longo, K. M.; de Freitas, S. R.; Lara, L. L.; Pauliquevis, T. M.; Procópio, A. S.; Rizzo, L. V.; Acta Amaz.2005, 35, 185.
26. Artaxo, P.; Oliveira, P. H.; Lara, L. L.; Pauliquevis, T. M.; Rizzo, L. V.; Pires Júnior, C.; Paixão, M. A.; Longo, K. M.; Freitas, S.; Correia, A. L.; Rev. Bras. Meteorol. 2006, 21, 168.
27. Neff, J. C.; Holland, E. A.; Dentener, F. J.; McDowell, W. H.; Russell, K. M.; Biogeochemistry2002, 57/58, 99.
28. http://www.inema.ba.gov.br/gestao-2/comites-de-bacias/ comites/cbh-leste/, accessed in June 2015.
29. Souza, M. F. L.; J. Ecol. Environ. Sci. 2005, 31, 177. 30. Anderson, K. A.; Downing, J. A.; Water, Air, Soil Poll.2006,
176, 351.
31. Grasshoff, K.; Ehrhardt, M.; Kremling, K.; Methods of Sea Water Analysis, 3rd ed.; Verlag Chemie: Weinheim, Germany, 1999.
32. Riley, J. P.; Chester, R.; Introduction to Marine Chemistry; Academic Press: London, UK, 1971.
33. Krupa, S. V.; Environ. Pollut. 2002, 120, 565.
34. Whitall, D.; Hendrickson, B.; Paerl, H.; Environ. Int. 2003, 29,
393.
35. Guimarães, G. P.; de Mello, W. Z.; Quím. Nova2006, 29, 54.
36. Möller, D.; Tellus1990, 42B, 254.
37. Keene, W. C.; Pszenny, A. A. P.; Galloway, J. N.; Hawley, M. E.;
38. Charlson, R. J.; Lovelock, J. E.; Andreae, M. O.; Warren, S. G.;
Nature 1987, 326, 655.
39. Rodrigues, R. A. R.; de Mello, W. Z.; de Souza, P. A.; Quim. Nova 2007, 30, 1842.
40. Galloway, J. N.; Likens, G. E.; Keene, W. C.; Miller, J. M.;
J. Geophys. Res.1982, 87, 8771; Galloway, J. N.; Gaudry, A.; Atmos. Environ.1984, 18, 2649; Andreae, M. O.; Talbot, R. W.; Andreae, T. W.; Harriss, R. C.; J. Geophys. Res.1988, 93, 1616;
Galloway, J. N.; Keene, W. C.; Likens, G. E.; J. Geophys. Res.
1996, 101, 6883.
41. Yamasoe, M. A.; Artaxo, P.; Miguel, A. H.; Allen, A. G.; Atmos. Environ.2000, 34, 1641.
42. de Souza, P. A.; Ponette-González, A. G.; de Mello, W. Z.; Weathers, K. C.; Santos, I. A.; Atmos. Res.2015, 160, 126.
43. Silva, M. A. M.; Souza, M. F. L.; Abreu, P. C.; Braz. J. Oceanogr. 2015, 63, 1.
Submitted: October 15, 2014