Article
Printed in Brazil - ©2017 Sociedade Brasileira de Química0103 - 5053 $6.00+0.00
*e-mail: [email protected]
Synthetic Niobium Oxyhydroxide as a Bifunctional Catalyst for Production of
Ethers and Allyl Alcohol from Waste Glycerol
Henrique S. Oliveira,*,a Jarbas M. Resende,a Patterson P. Souza,b
Patricia S. O. Patríciob and Luiz C. A. Oliveiraa
aDepartamento de Química, Universidade Federal de Minas Gerais,
Av. Antônio Carlos, 6627, Campus Pampulha, 31270-901 Belo Horizonte-MG, Brazil
bCentro Federal de Educação Tecnológica de Minas Gerais (CEFET-MG),
Av. Amazonas, 5253, 30421-169 Belo Horizonte-MG, Brazil
A synthetic niobia was modified by treatment with hydrogen peroxide to be used as a catalyst for converting glycerol into petrochemical compounds. The catalytic properties of niobium oxyhydroxide were obtained by generating acidic and oxygenated groups (peroxo groups) on the solid surface. Compounds like ethers and allyl alcohol were obtained. A very active H2O2-modified catalyst showed high activity for the oxidation and dehydration of 91% of glycerol conversion using H2O2 and 46% of allyl alcohol selectivity in volatile phase. The product was analyzed by gas chromatography-mass spectrometry (GC-MS), thermogravimetry-mass spectrometry (TGA-MS) and nuclear magnetic ressonance (NMR). These results strongly suggest that the reactions involve acid and oxidizing species generated after the reaction of niobium with H2O2. 1H and 13C multidimensional NMR spectroscopy confirmed the results obtained with GC-MS and showed the production of several compounds after niobia treatment.
Keywords: nobium, oxyhydroxide, glycerol, ethers, allyl alcohol
Introduction
Brazil is a country that stands out for its great capacity to produce renewable energy, starting with the Proálcool program for the use of ethanol as a fuel alternative to gasoline.1 The country currently has a national program
for the gradual inclusion of biodiesel in diesel fuel2 (2%
at the beginning of the program, 5% from 2010 and 7% nowadays).3 Biodiesel appears as a promising energy source
that would cause less environmental impact,4 especially by
reducing CO2 emissions.5
The most appropriate way to yield such diesel fuel is by converting the triacylglyceride structure of vegetable oils or animal fats into fatty acid mono-alkyl esters standardized as biodiesel when meeting the requirements of ASTM D 6751 and Euro norm EN 14214.6 The production of biodiesel by
transesterification of triacylglycerides yields glycerol as a byproduct. The large amounts thus produced have turned glycerol from a specialty chemical into a commodity. Unfortunately, the production of this fuel has certain
limitations, such as the generation of large amounts of glycerol as a byproduct. Although glycerol is widely used as a raw material in various industrial applications, the material is nevertheless produced in much larger amounts than needed.6 However, to be used as a renewable raw
material to replace petrochemicals in the production of important or promising chemical intermediates like epichlorohydrine (ECH), propylene glycol (PG), acrylic acid or 1,3-propanediol,7,8 the forecasted by-product volumes
would be largely insufficient. Currently, the Brazilian market consumes approximately 40,000 tons year-1 of
glycerol, however, the production with the introduction of B2 (2% of biodiesel in regular diesel) in 2008 was 80,000 tons year-1 of glycerol.9 In 2014, Brazil produced
390,000 tons of crude glycerin from biodiesel.10 This
increase shows that the viability of the biodiesel program is directly related to the ability to produce economically feasible materials from the residual glycerol.
Various studies aimed at producing new compounds from glycerol.11-14Thus, US patent 5,387,72015showed that
additives has also been studied,16 but the drastic conditions
and the difficult separation of the homogeneous catalyst from the reaction medium make the process expensive. Some studies on glycerol conversion have involved heterogeneous catalysis, mainly using materials with acidic properties such as zeolites, aluminosilicates and niobium oxide.17 Other interesting works have studied the conversion
of glycerol into polyglycerols and polyglycerol esters that could be used for the production of surfactants, lubricants, cosmetics or food additives.12
In recent years, niobium compounds have received special attention due to their catalytic activities in several important chemical processes, particularly when both acidic and oxidizing properties are required in the method.18-24 Nb
2O5 has been widely used as a catalyst
for dehydration, hydration, etherification, hydrolysis, condensation, dehydrogenation, alkylation, photochemical, electrochemical polymerization and oxidation reactions.25-28
A niobium oxyhydroxide was synthesized and modified by hydrogen peroxide treatment to generate a bifunctional catalyst. The catalysts were tested for the simultaneous dehydration/oxidation of glycerol to obtain compounds that could be employed as bio-additives for fuels.
Experimental
Synthesis and characterizations
Niobium oxyhydroxide was prepared by treating NH4[NbO(C2O4)2(H2O)]·(H2O)n with NaOH (50 mL,
1 mol L-1), followed by heating at 60 °C for 72 h. This
material was used as a precursor (pure Nb2O5) for the
preparation of treated niobia (Nb2O5/H2O2), obtained by
treating pure niobia (300 mg) with hydrogen peroxide (30% v v-1, 4 mL) in water (80 mL) for 30 min. The yellow
solid was then filtered, washed with distilled water and dried at 60 °C for 12 h.
Fourier transform infrared (FTIR) measurements of the catalyst were carried out with a Shimadzu Prestige 21 spectrophotometer equipped with an attenuated total reflectance (ATR) accessory. The spectra of the samples were obtained in the region from 4000 to 240 cm-1 using
a CsI crystal and 150 signal-averaged scans. The textural properties were investigated by nitrogen physisorption at 77 K to determine the specific surface area and total pore volume using a Quantachrome model Autosorb-1. The samples were previously outgassed at 200 °C and the specific surface area was obtained using the Brunauer-Emmett-Teller (BET) method. The experimental setup thermogravimetry-mass spectrometry (TGA-MS) consists of a thermogravimetric analyzer (STA 409 PC/PG, Netzsch
Instruments, Germany) coupled with a quadrupole mass spectrometer (QMG 422, Pfeiffer Vacuum Technology, Germany). In the thermogravimetric analyzer, high purity nitrogen (99.9995%) at a flow rate of 60 mL min-1 was
used as the carrier gas to provide an inert atmosphere and to remove the gases. About 8 mg of sample (particle size small than 60 µm) were pyrolyzed in TGA from room temperature to 900 °C with a heating rate of 20 °C min-1.
The released gases were purged immediately to the mass spectrometer to obtain the evolution curves. The transfer line and gas cell were pre-heated to 200 °C in order to avoid cold spots and to prevent the condensation of semi-volatile products. The mass spectrometer was operated in electron ionization mode with 70 eV of electron energy. The mass range m/z 10-300 was scanned with scan rate of 5 scans s-1.
Catalytic tests
Glycerol conversion was performed using H2O2
(30% v v-1) as the oxidizing agent. The catalytic tests were
performed at 250 °C, using 20 mL concentrated glycerol and 50 mg catalyst in the presence of H2O2 (1.0 mL) in a
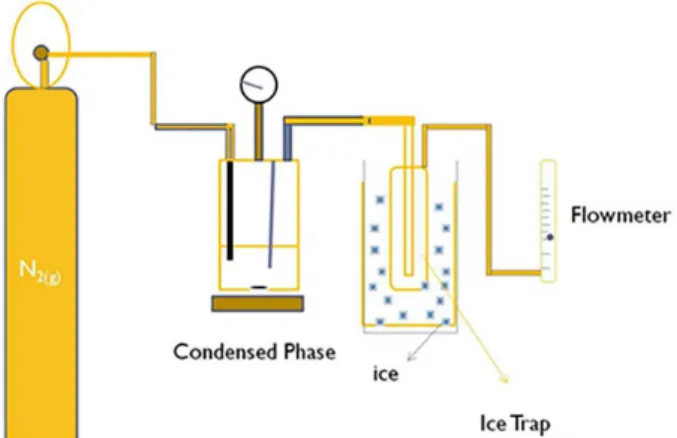
batch reactor for 1, 3 and 6 h. Two distinct liquid phases were collected from the reaction. The first one (the heavier phase) was collected directly from the reactor after a given time and reaction conditions, called the condensed phase (CP sample). The other liquid phase (rich in low molecular mass compounds) was collected through a condenser attached to the reactor, called the volatile phase (VP) (Figure 1). The products of the reaction were analyzed by gas chromatography-mass spectrometry (GC-MS) (Agilent Instruments, Santa Clara, CA, USA).
the condensed phase were as follows: injector temperature at 250 °C, injection volume of 0.2 mL, flow rate of 1.4 mL min-1 and a HP-5 (5% polimetilfenilsiloxane)
column. A heating curve of 80 °C for 5 min, followed by 3 °C min-1 until 250 °C, was used. In order to achieve a
better separation of the compounds, a different method was developed for the analysis of the volatile phase.
The oven temperature was held at 50 °C for 5 min and then increased to 250 °C at 3 °C min-1. The carrier
gas (He) was used at a flow rate of 1.2 mL min-1. A series
of alkanes (C8-C22) was analyzed using the same method
to establish retention indices in order to tentatively identify the compounds by comparison with the literature (either from the National Institute of Standards and Technology (NIST) 2008 library or from other literature sources). When using the NIST library, only probabilities greater than 90% were considered.
The NMR (nuclear magnetic ressonance) samples of the aliquots were prepared in methanol-d4. These aliquots were
collected after 3 and 6 h (CP-3h and CP-6h, respectively) for the condensed phase and after 6 h for the volatile phase (VP-6h). All the NMR spectra were recorded at 300 K on a Bruker Avance DRX 400 MHz spectrometer operating at 9.4 T. A 5 mm inverse detection gradient probe was used for the acquisition of the 1H, 1H-13C HSQC (heteronuclear
single-quantum correlation) and HMBC (heteronuclear multiple bond correlation) spectra, while a 13C-1H direct
detection 5 mm dual probe was employed for the acquisition of the 1H-decoupled 13C and DEPT-135 (distortionless
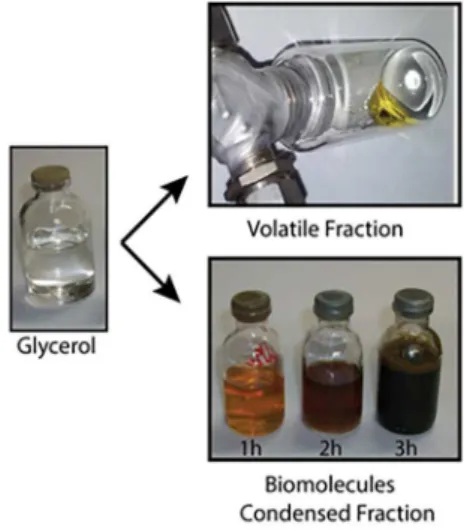
enhancement by polarization transfer) spectra. The products of the reaction are shown in Figure 2.
Results and Discussion
Catalytic tests
The analyses of the condensed fraction showed glycerol conversion rates of 18, 57 and 91% after 1, 3 and 6 h, respectively. The catalytic activity exhibited by the materials in this work was comparable with others reported in the literature. Sánchez et al.29 obtained a glycerol
conversion rate of 78% in gas phase with GHSV (gas hourly space velocity) of 1190 h-1 at 340 °C using γ-alumina/Fe
catalyst and allyl alcohol yield was 4.3%. Different catalysts with alkali metals, including Na, K, Rb, and Cs, were supported on ZrO2-FeOx and all of them gave impressively
higher allyl alcohol yields and suppressed glycerol dehydration due to the reduced catalyst acidic property.30
With achieved K-supported ZrO2-FeOx (K/ZrO2-FeOX),
the allyl alcohol yield remarkably increased up to 27 mol% C at the K content of 3-5 mol%.
The reaction containing only H2O2 (without the
catalyst) showed low activity, exhibiting a conversion of approximately 11%. In the absence of hydrogen peroxide (catalyst only), the conversion rate was 45.9% (at 6 h of reaction), showing the importance of the oxidizing agent to regenerate the catalyst in situ. After 6 h, almost all of the glycerol was converted into new products, mainly diglycerol and ethers in the condensed phase and allyl alcohol in the volatile phase. This work presents, in volatile phase, the selectivity of allyl alcohol (46% at 6 h of reaction) and (CP) ether compounds (selectivity 25%) from glycerol using a niobium oxyhydroxide compound directly as a catalyst without an active phase such as a noble metal.
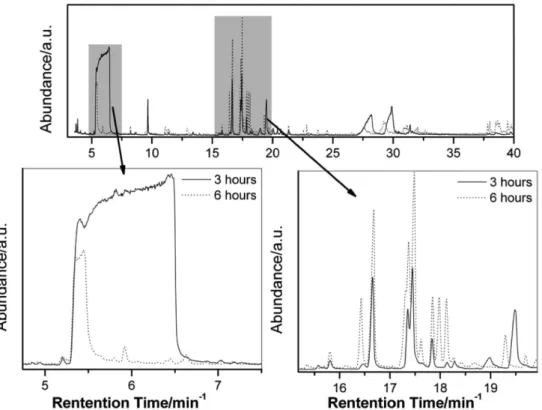
To identify the molecules formed in the condensed and volatile phases, the samples were analyzed by GC-MS (Figures 3 and 4, respectively). The details in Figure 3 show the difference in the glycerol conversion and the formation of ethers. After 3 h, ethers as di- and triglycerols are preferably formed. These compounds appear close to 28 min in the GC-MS trace and were confirmed by Kovats retention index. The triglycerols were obtained in low amounts as shown in the chromatography analyses. This difference may be due to the difficulty of volatilizing these molecules.
The compounds with retention times between 16 and 19 min (the major compounds) were determined to be 6-carbon cyclic ethers. The mechanism for the formation of these cyclic ethers was shown by Barrault et al.31
Another way to generate these cyclic compounds is by the dimerization of 3-hydroxypropionaldehyde proposed by Suprun et al.32 and Oliveira et al.33 using electrospray
analysis, and presented a predominance of di- and triglycerols in the condensed phase from the conversion of glycerol with catalyst based on nioubium compounds.
identification using NMR to corroborate the analysis by chromatography. Along with allyl alcohol, acetone and butanedione were also obtained, the latter being 10% of the total area in the volatile phase analysis. In fact, the results show that the reaction with H2O2-modified niobium
oxyhydroxide was more effective and more selective than the reaction using unmodified niobium oxyhydroxide (data not shown) because a higher conversion was obtained. We attributed this phenomenon to the surface oxidizing species (i.e., peroxy groups formed with the H2O2 treatment of the
catalyst). Peroxo and acidic groups are shown to be the active species in the conversion of glycerol promoting the formation of ethers and ketones.23,34 The proposed structures
of the compounds obtained in the condensed phase are displayed in Figure 5.
Chieregato et al.35 showed that W/V/Nb catalytic
systems produce in minor amounts of acetic acid, allyl alcohol, acetone and hydroxyacetone from glycerol reactions. In another study, the authors report the formation of cyclic ethers from glycerol reactions using acid catalysts,36 however, there is the possibility of
occuring a oxidative cleavage of glycerol and triggering the formation of by-products that usually is leaded under strictly reducing conditions. The mechanism of allyl Figure 3. Chromatogram of the condensed phase obtained after 3 and 6 h of reaction (50 mg of niobium oxyhydroxide, 1 mL de H2O2 and 250 oC).
Figure 4. Profile of volatile products obtained after 6 h of reaction (50 mg of niobium oxyhydroxide, 1 mL de H2O2 and 250 oC).
alcohol formation is well reported via hydrogen transfer through the potential donor in the reaction medium.37
The conversion of glycerol to allyl alcohol and cyclic ethers from the reaction of the mixture of niobium and vanadium oxides with hydrogen peroxide has been described.28 Oliveira et al.28 showed a glycerol oxidative
cleavage under oxidizing conditions producing formic acid, which is able to mediate the formation of both allyl alcohol and cyclic ethers. For this, the formic acid acts as intermediate product reacting with unreacted glycerol yielding 4-hydroxymethyl-1,3-dioxolane. The formic acid may react immediately when is produced because it is not observed in the GC-MS and neither 1H NMR analyses.
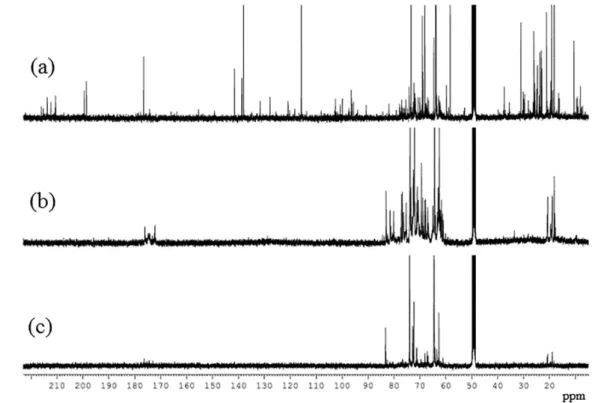
The 13C NMR spectra obtained from the samples
CP-3h, CP-6h and VP-6h are presented in Figure 6. In these spectra, relatively intense signals were observed at 63.97 and 73.53 ppm, which correspond to the 13C resonances of
unreacted glycerol. Nevertheless, many other resonances were observed in the three spectra, suggesting that glycerol was converted into many other species. By comparing the spectrum of CP-6h to that of CP-3h, the glycerol signal intensities were observed to decrease compared to other signals, indicating that higher degrees of conversion require longer reaction times. A significantly higher number of NMR signals observed in the 13C NMR spectrum of
CP-6h confirmed the formation of several compounds and a much greater consumption of glycerol. When the
13C NMR spectra obtained from the volatile and condensed
phase samples were compared to each other (CP-6h and VP-6h), many different resonance signals indicated that these two phases were composed of distinct compounds. It suggests that a detailed analysis of these samples is required to determine their compositions.
Among these substances, many useful high-value chemicals were expected to be found. Many resonances were observed between 58 and 85 ppm, indicating the presence of many ether compounds in both the volatile and condensed phases (C–O resonances). The presence of these signals along with resonances between 171 and
176 ppm (–C(O)O– resonances) in the CP-6h 13C NMR
spectrum indicates the conversion of glycerol into esters in the condensed phase. Interestingly, in the VP-6h
13C NMR spectrum, many signals of nonhydrogenated
carbons (confirmed by DEPT-135 spectrum, see the Supplementary Information (SI) section) were observed between 198 and 217 ppm, hereby indicating the presence of ketones in the volatile phase. These observations demonstrate that the two phases are composed of different classes of carbonyl compounds. Whereas the condensed phase is mainly composed of esters, ketones are most common in the volatile phase. It is also worth mentioning that many resonances were seen between 100 and 165 ppm, demonstrating the presence of unsaturated compounds (either olefins or aromatic compounds) in the volatile phase. In particular, the intense signals observed at 115.8 and 138.1 ppm confirm a high allyl alcohol yield.
Figure 6. 13C NMR spectrum (100 MHz, CD
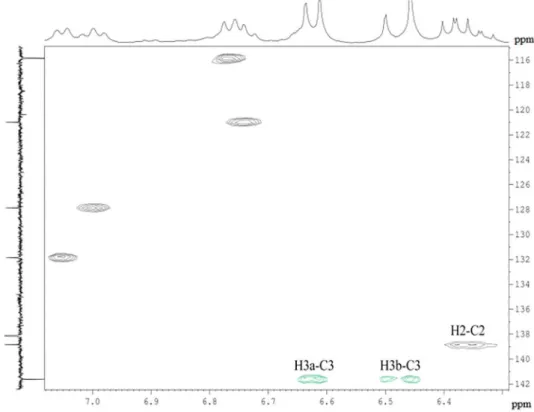
The analyses of the NMR spectra unequivocally confirmed all of the compounds identified by GC-MS in both the condensed and volatile phases. Other than acetone, butanone, 2,3-butadione, propyl alcohol and allyl alcohol, other compounds such as acrolein and dimethyldioxane were identified in the NMR spectra of the volatile phase (see the SI section). These assignments were performed by the simultaneous analysis of 13C, DEPT-135,
edited 1H-13C HSQC and HMBC spectra. Expansions
of the 1H-13C HSQC and HMBC contour plots with the
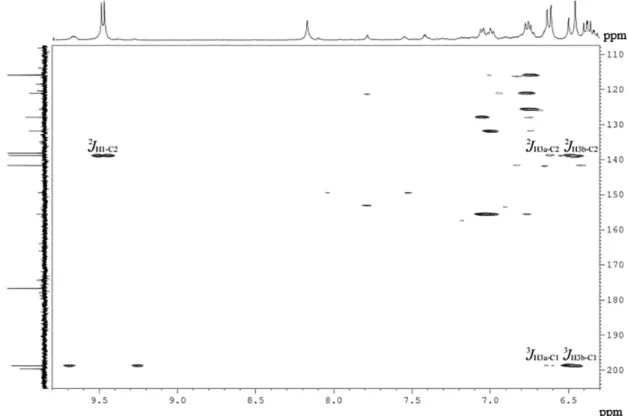
correlations of the acrolein highlighted resonances are presented in Figures 7 and 8.
In the 1H-13C HSQC spectrum, the negative phase signals
represent correlations between the diastereotopichydrogens and the respective carbons of the methylene group, whereas the positive phase signals represent the correlation between the hydrogen and the carbon of acrolein. In the
1H-13C HMBC contour plot, the resonances of the olefinic
groups were connected to each other, as well as to the carbon and hydrogen of the formyl group, which possessed signals at 198.9 and 9.47 ppm, respectively.
As mentioned above, the high number of constituents observed in both the volatile and condensed phases hampered the detailed analysis of these spectra. Therefore, we partially fractionated these products and then analyzed them with NMR to determine the identities of the possible compounds with potential industrial applications.
A glycerol standard (Figure 9a) and the products formed after 6 h (Figure 9b) were studied by TGA-MS. In the TGA-MS analysis of the glycerol standard, only ions at
m/z 18 and 28 were observed at high intensity. These ions may be due to water or carbon monoxide, which could be created by the degradation of glycerol.
From the mass spectrometry data of allyl alcohol obtained in the volatile fraction, ions at m/z 31, 39 and 57 were observed, as typically observed for this compound. Interestingly, these ions do not appear in the glycerol standard or in the products, indicating that allyl alcohol does not come from pyrolysis of glycerol or its products, but as a result of the catalytic process.
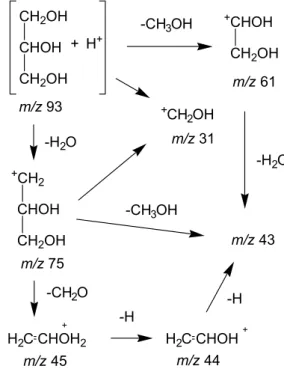
Figure 10 presents ion fragments of products from glycerol. These ion fragments are similar to the ones reported by Dass39 in mass spectrometry studies. In turn,
the metastable ions of protonated glycerol fragment principally via the loss of a water molecule producing extensive fragmentation from m/z 75. The ions of m/z 45, 44 and 43 involve the losses of elements of CH2O, CH3O
and CH4O from the ion of m/z 75. The glycerol protonated
ion undergoes a loss of a CH3OH molecule to yield m/z 61,
that can loss of a water molecule to yield ion m/z 43.
Characterization of the materials
The physical characteristics of the niobia catalysts
Figure 7. Partial 1H-13C HSQC contour plot (400 MHz, CD
3OD-d4) of VP-6h at 300 K. The positive phase is presented in black, and the negative phase
were determined by N2 adsorption/desorption. The
materials presented specific surface area values of 19 and 11 m2 g-1 for niobium oxyhydroxide before and after
H2O2-treatment, respectively. The profile of the isotherms
suggests a nonporous material with type II isotherms according to the IUPAC (International Union of Pure and Applied Chemistry) classification. Interestingly, prior treatment of niobia with H2O2 causes a slight decrease of
the BET specific surface area of the material. This probably happened due to the agglomeration of particles.
The FTIR spectra of the materials are shown in Figure 11. The absorption bands at approximately ca. 3412 and ca. 3140 cm-1 are assigned to the O–H stretching
frequencies in different regions of the catalyst structure (i.e., the surface and bulk structures, respectively).
To obtain more detailed information about the hydroxyl groups involved in the formation of peroxy groups, a deconvolution approach using a Gaussian adjustment was performed on the spectra of Figure 12.
Due to band overlapping, this procedure improved the resolution of each individual band. The obtained curve fit (Figure 12) showed the presence of five components, but only the two main, with higher frequencies, were investigated. The index value (Is) calculated by the ratio
of the band areas at 3412 and 3140 cm-1 was used to
express the relative quantity of the different hydroxyl groups.
After reacting niobium oxyhydroxide with hydrogen peroxide, the Is value decreased from 0.49 (pure Nb2O5)
to 0.43 (Nb2O5/H2O2), indicating a decrease in the amount
of surface hydroxyl groups in relation to the bulk hydroxyl groups. As observed in the FTIR spectra of niobium oxyhydroxide after H2O2-treatment (Figures 12a and 12b,
respectively), the band at 3140 cm-1 becomes more intense
than the others present in this region compared to the spectrum for niobium oxyhydroxide before H2O2-treatment.
This result suggests that the surface hydroxyl groups are preferentially involved in the formation of peroxo groups. In addition, the formation of peroxo groups is evidenced in the FTIR spectrum of Nb2O5/H2O2 by the appearance of
shoulders in the band at ca. 537 cm-1, assigned to the O–O
asymmetrical stretching bonded to the metal (Nb–O2), and
at 868 cm-1 associated with the stretching vibration of the
peroxo group (O–O), as highlighted in Figure 11.
Conclusions
In this work, new potentially useful organic compounds were obtained from waste glycerol that may be used as fuel additives or in other possible industrial applications. These compounds were formed by the reaction of waste glycerol with peroxo groups generated on the surface. These modified catalysts showed great potential for the conversion of glycerol using H2O2 as an oxidant.
Figure 8. Partial 1H-13C HMQC contour plot (400 MHz, CD
analyses were also used to identify products from the conversion of glycerol, and these results corroborate the chromatograph analyses, which showed the formation of mainly ethers in the condensed phase and ketones and allyl alcohol in the volatile fraction. The results presented here Figure 9. Thermogravimetric analysis coupled with mass spectrometry
of the (a) glycerol standard and (b) products obtained after 6 h.
Figure 10. Scheme of glycerol fragmentation.
Figure 11. ATR-FTIR spectra (KBr) of niobium oxyhydroxide before and after H2O2-treatment.
Figure 12. Hydroxyl stretching regions of the deconvoluted FTIR spectra (KBr) of niobium oxyhydroxide (a) before and (b) after H2O2-treatment.
show that useful petrochemical products can be obtained using synthetic niobium oxyhydroxide as a catalyst by modifying the metal surface to generate both oxidizing and acidic groups.
Supplementary Information
Supplementary data are available free of charge at http://jbcs.sbq.org.br as PDF file.
Acknowledgments
This work received the financial support from FAPEMIG, CNPq, CAPES and Pró-Reitoria de Pesquisa da Universidade Federal de Minas Gerais.
References
1. Lehtonen, M.; Biomass Bioenergy2011, 35, 2425.
2. Mota, C. J. A.; da Silva, C. X. A.; Gonçalves, V. L. C.; Quim. Nova2009, 32, 639.
3. http://agenciabrasil.ebc.com.br/economia/noticia/2014-05/ medida-provisoria-deve-aumentar-percentual-de-biodiesel-ao-diesel, accessed in April 2017.
4. Hosseini, S. E.; Wahid, M. W.; Renewable Sustainable Energy Rev.2016, 57, 850.
5. Suganya, T.; Varman, M.; Masjuki, H. H.; Renganathan, S.;
Renewable Sustainable Energy Rev. 2016, 55, 909.
6. Dinjus, E.; Arnold, U.; Dahmen, N.; Höfer, R.; Wach, W.;
Green Fuels: Sustainable Solutions for Transportation, RSC Green Chemistry Series No. 4; RSC Publishing: Cambridge, UK, 2009.
7. Matyjaszewski, K.; Möller, M.; Polymer Science: A Comprehensive Reference, vol. 10; Elsevier Inc.: Amsterdam, The Netherlands, Oxford, UK, Waltham, MA, USA, 2012.
8. Liu, L.; Wang, B.; Du, Y.; Zhong, Z.; Borgna, A.; Appl. Catal., B
2015, 174-175, 1.
9. Mota, C. J. A.; Silva, C. X. A.; Gonçalves, V. L. C.; Quim. Nova
2009, 32, 639.
10. http://atlas.media.mit.edu/en/visualize/tree_map/hs92/export/ bra/show/152090/2014/, accessed in April 2017.
11. Betiha, M. A.; Hassan, H. M. A.; El-Sharkawy, E. A.; Al-Sabagh, A. M.; Menoufy, M. F.; Abdelmoniem, H.-E. M.; Appl. Catal., B
2016, 182, 15.
12. Soares, A. V. H.; Salazar, J. B.; Falcone, D. D.; Vasconcellos, F. A.; Davis, R. J.; Passos, F. B.; J. Mol. Catal. A: Chem.2016,
415, 27.
13. Farnetti, E.; Crotti, C.; Catal. Commun.2016, 84, 1.
14. Pagliaro, M.; Rossi, M.; The Future of Glycerol, 2nd ed.; RSC
Publications: Cambridge, UK, 2010, p. 1-147.
15. Neher, A.; Haas, T.; Arntz, D.; Klenk, H.; Girke, W.; US pat. 5,387,7201993.
16. Hernandez, D.; Fernandez, J. J.; Mondragon, F.; Lopez, D.;
Fuel2012, 92, 130.
17. Prado, N. T.; Oliveira, L. C. A.; Appl. Catal., B 2017, 205, 481. 18. Guimarães, I. R.; Oliveira, L. C. A.; Queiroz, P. F.; Ramalho,
T. C.; Pereira, M.; Fabris, J. D.; Ardisson, J. D.; Appl. Catal., A
2008, 347, 89.
19. Silva, A. C.; Oliveira, D. Q. L.; Oliveira, L. C. A.; Anastácio, A. S.; Ramalho, T. C.; Lopes, J. H.; Carvalho, H. W. P.; Torres, C. E. R.; Appl. Catal., A 2009, 357, 79.
20. Kreissl, H. T.; Nakagawa, K.; Peng, Y. K.; Koito, Y.; Zheng, J.; Tsang, S. C. E.; J. Catal.2016, 338, 329.
21. Rodrigues, R.; Mandelli, D.; Gonçalves, N. S.; Pescarmona, P. P.; Carvalho, W. A.; J. Mol. Catal. A: Chem.2016, 422, 122. 22. Yue, C.; Zhu, X.; Rigutto, M.; Hensen, E.; Appl. Catal., B2015,
163, 370.
23. Ziolek, M.; Sobczak, I.; Decyk, P.; Sobańska, K.; Pietrzyk, P.; Sojka, Z.; Appl. Catal., B 2015, 164, 288.
24. Oliveira, L. C. A.; Ramalho, T. C.; Gonçalves, M.; Cereda, F.; Carvalho, K. T.; Nazzarro, M. S.; Sapag, K.; Chem. Phys. Lett.
2007, 446, 133.
25. Esteves, A.; Oliveira, L. C. A.; Ramalho, T. C.; Goncalves, M.; Anastacio, A. S.; Carvalho, H. W. P.; Catal. Commun.2008, 10, 330.
26. Chagas, P.; Oliveira, H. S.; Mambrini, R.; Le Hyaric, M.; de Almeida, M. V.; Oliveira, L. C. A.; Appl. Catal., A 2013,
454, 88.
27. Oliveira, L. C. A.; Ramalho, T. C.; Souza, E. F.; Gonçalves, M.; Oliveira, D. Q. L.; Pereira, M. C.; Fabris, J. D.; Appl. Catal., B
2008, 83, 169.
28. Oliveira, H. S.; Souza, P. P.; Oliveira, L. C. A.; Catal. Today,
in press, DOI: 10.1016/j.cattod.2016.09.012.
29. Sánchez, G.; Friggieri, J.; Keast, C.; Drewery, M.; Dlugogorski, B. Z.; Kennedy, E.; Stockenhuber, M.; Appl. Catal., B 2014,
152-153, 117.
30. Konaka, A.; Tago, T.; Yoshikawa, T.; Nakamura, A.; Masuda, T.; Appl. Catal., B 2014, 146, 267.
31. Barrault, J.; Pouilloux, Y.; Clacens, J. M.; Vanhove, C.; Bancquart, S.; Catal. Today2002, 75, 177.
32. Suprun, W.; Lutecki, M.; Haber, T.; Papp, H.; J. Mol. Catal. A: Chem.2009, 309, 71.
33. Oliveira, L. C. A.; Portilho, M. F.; Silva, A. C.; Taroco, H. A.; Souza, P. P.; Appl. Catal., B 2012, 117-118, 29.
34. Souza, J.; Souza, P. M. T. G.; Souza, P. P.; Sangiorge, D. L.; Pasa, V. M. D.; Catal. Today2013, 213, 65.
35. Chieregato, A.; Soriano, M. D.; Basile, F.; Liosi, G.; Zamora, S.; Conspción, P.; Cavani, F.; Nieto, J. M. L.; Appl. Catal., B
2014, 150-151, 37.
37. Liu, Y.; Tüysüz, H.; Jia, C. J.; Schwickardi, M.; Rinaldi, R.; Lu, A. H.; Schmidt, W.; Schüth, F.; Chem. Commun.2010, 46, 1238.
38. Arceo, E.; Marsden, P.; Bergman, R. G.; Ellman, J. A.; Chem. Commun.2009, 23, 3357.
39. Dass, C.; Org. Mass Spectrom.1994, 29, 475.