0103 - 5053 $6.00+0.00
Article
*e-mail: [email protected]
Study of poly(
o
-Ethoxyaniline) Interactions with Herbicides and Evaluation of Conductive
Polymer Potential used in Electrochemical Sensors
Nelson Consolin Filho,* Fábio de Lima Leite, Eduarda Regina Carvalho, Everaldo Carlos Venâncio, Carlos Manoel P. Vaz and Luiz Henrique C. Mattoso
Embrapa Instrumentação Agropecuária, CP 741, 13560-970, São Carlos-SP, Brazil
Foram investigadas as interações entre os pesticidas atrazina, imazaquin, metribuzin e paraquat com o polímero condutor poli-(o-etoxianilina)-POEA, utilizando-se as técnicas de
microscopia de força atômica (AFM), espectrofotometria de ultravioleta visível (UV-Vis) e espectroscopia de impedância eletroquímica. Os estudos de microscopia de força atômica em filmes automontados mostraram um aumento na rugosidade do filme polimérico, quando exposto aos pesticidas atrazina, imazaquin e metribuzin e uma diminuição na rugosidade do filme polimérico exposto ao pesticida paraquat. Isso evidencia a existência de interação química, provavelmente, ligação iônica entre o nitrogênio presente na POEA e os grupos presentes nos pesticidas estudados. Os estudos de ultravioleta visível mostraram uma maior interação entre a POEA e o pesticida imazaquin. Por meio de medidas elétricas realizadas (espectroscopia de impedância eletroquímica) com um sensor formado por filme de POEA, foi possível distinguir e determinar o limite de detecção dos pesticidas em solução aquosa, o que corrobora com os estudos por AFM e UV-Vis.
Interactions of four aromatic nitrogen-heterocyclic herbicides (atrazine, imazaquin, metribuzin and paraquat) with the conductive polymer poly(o-ethoxyaniline)-POEA, were studied
with atomic force microscopy (AFM), UV-visible spectrophotometry (UV-Vis) and electrochemical impedance spectroscopy. AFM profiles of self-assembled (SA) films of POEA revealed that the polymer surface became rougher (on the nanoscale) when exposed to atrazine, imazaquin and metribuzin, but slightly smoother in contact with paraquat. This suggested that specific chemical interactions, possibly electroscopic, have occurred between nitrogen atoms in the polymer chain and the dissimilar groups in the various herbicide molecules, during adsorption of the latter onto the film. The UV-Vis analyses indicated a stronger interaction of POEA in solution with imazaquin, that has a special importance for the intended application. Sensors produced by coating microelectrodes with SA films of POEA were used to perform impedance spectroscopy in aqueous solutions of each herbicide. With the resulting data, it was possible to distinguish and set detection limits for each herbicide in water, corroborating AFM and UV-Vis results.
Keywords: interaction, conductive polymers, poly(o-ethoxyaniline), POEA, sensors,
herbicides, detection limits
Introduction
The electrical conductivity of materials derived from
polyaniline, (PANI), such as poly(o-ethoxyaniline),
(POEA), can be considerably enhanced. Some other properties can also be altered by doping the material with proton-releasing acids, owing to changes in the structure or morphology of the polymer or protonation of its
backbone nitrogens.1 For POEA case, the polymer can be
dissolved in water, which is advantageous in a conducting polymer, as it allows thin films deposit and a better pH control of the polymer solution. The latest research on POEA has involved ultra-thin films, made with self-assembly (SA) technique, used in liquid systems analyses
with impedance spectroscopy.2,3
Although SA is a very recent technique, many
articles on this subject have already been published.4-20
nanoarchitecture is built up, whose succeeding layers are held together by electrostatic forces. Films can thus be fabricated with 5 to 100 Å thickness. Research in this field focuses on deposition conditions, adsorption of molecules on the substrate, pH and concentration of the polyelectrolyte solution and the degree of doping
of the polymer matrix.21-23
When AFM was applied to morphological study of conducting polymers, it turned out to be an invaluable technique, giving data on the structure and organization
of thin films that, until then, had been unavailable.24-28
Notable examples of polymeric materials features studied by AFM are: surface morphology, nanostructure, packing and conformation of polymer chains, tribology, distribution of polymer phases (topographical map or spatial variation in the elastic modulus), nanodents, mechanisms of wear, porosity, roughness, epitaxy, mapping of electrical charge and force profiles of specific chemical interactions. Recent work has shown that the method of preparation of conjugated polymer thin films
determines their final morphology.24,29,30 Characterization
of the morphological differences among films can afford valuable information for the design of film-based sensors and other applications.
When pesticides are sprayed on crop fields, they may evaporate or be washed into the soil by rain or irrigation water. In the soil, they can be degraded by light, heat, interaction with soil particles, bacteria or other factors, giving rise to residues, inoffensive or otherwise. The pesticides and their breakdown products may be transported in surface run-off to rivers or may be retained, adsorbed by the soil. In the latter case, these pollutants can percolate down to the water table, contaminating drinking water at source.
The real possibility of water and food contamination with products known to be dangerous to health, means that it is essential to monitor both products environ-mental levels and their derivatives, increasingly often. Permitted levels of pesticide residues are expressed as maximum residue limits (MRLs) in each country that possesses relevant legislation. Since these limits may not always agree, some published scientific studies refer to MRLs set by international bodies, such as, the European Union (EU) and the Codex Alimentarius (‘food code’) Commission jointly created by the UN Food and Agriculture Organization (FAO) and the World
Health Organization (WHO),31 as well as, MRLs issued
by the US Environmental Protection Agency (EPA). In Brazil, MRLs are established in administrative rules of the National Council for the Environment (CONAMA).
An analyte detection limit with a given method is defined as the smallest quantity of the analyte that can be reliably detected (at a chosen level of statistical confidence) with that method. According to IUPAC, LOD, defined in terms of concentration or mass of analyte, is given by the equation:
LOD = k SB / S
where S = sensitivity of the method, SB = standard
deviation of the background (blank signal) and k is a
constant (IUPAC recommends k = 3).32 The LOD depends
not only on the sensitivity and background noise of the detecting device, but also, as for example, on the amount of sample and measuring time.
The herbicides used to test the system described in this article were four aromatic N-heterocyclic compounds (NHCs): atrazine, imazaquin, metribuzin and paraquat, whose chemical structures are shown in Figure 1.
Pesticides are mainly analyzed by chromatographic methods, mainly liquid and gas chromatography. While such methods are very precise, selective and sensitive, they are also very expensive and laborious, demanding well-equipped laboratories and highly-qualified technicians. In response to the high costs associated with chromatography, an alternative analytical approach is increasingly being applied to pesticides analysis -electroanalytical techniques, in which electrochemical tests, such as, measurements of electrochemical impedance are used to detect analytes traces. In this context, the present study is an evaluation of the capacity of a POEA film-based sensor to detect the four herbicides shown in Figure 1, by impedance spectroscopy. The interactions of each analyte with POEA were also investigated by UV-Vis and AFM methods.
Experimental
POEA was synthesized by oxidative polymerization
of o-ethoxyaniline, using the previously published
method,37 in which an excess of the monomer is treated
with (NH4)2S2O8 (ammonium persulfate) in 1.0 mol L-1
HCl. The herbicides were from Bayer® (atrazine,
imazaquin), Du Pont® (metribuzin) and Zeneca Ag
Products® (paraquat). Aqueous solutions of POEA and
herbicides were prepared in Milli-Q ultrapure water
(Millipore®). Glass substrates used for self-assembly
were of Suprasil® quartz previously washed as described
by Kern.38 Herbicide solutions were made up in a
concentration range from 0.1 to 10 mg L-1 and pH
adjusted to 5.0 with HCl. Before use, the monomer
o-ethoxyaniline (Aldrich) was purified by low-pressure
distillation. Self-assembly of POEA films was carried
out as described elsewhere.39
Before AFM experiments with POEA films, they were
in contact with a solution of herbicide (10 mg L-1) for 3 h,
then washed with water (adjusted to the same pH) for 15 min and air dried for 24 h. Following this treatment, films were analyzed by AFM in contact mode, using a TMX2010 Topometrix Discoverer AFM, equipped with
scanners of 7×7 and 70×70 µm2 scanning areas.
The spring constant, k, of the silicon nitride AFM
cantilever was 0.13±0.01 N m-1. The stem lengths and
radii of the tips were measured by scanning electron microscopy. The radius of curvature of the tips was 80±10 nm. The roughness and fractal dimension of the surface were calculated from its profile, obtained by AFM, by dedicated software: WSxM 4.0, Develop 4.4,
Nanotec Electrónica S.L. (Copyright© November 2003)
and Scanning Probe Image Processor (SPIP) 3.1.0.1 (Image Metrology A/S 2003).The dimensions of the cantilevers and radii of tips of similar size did not deviate more than 15% from the mean value for all the cantilevers. Images were collected at scan rates below 2 Hz and during this process some precautions were taken, such as, set point adjustment to the lowest possible value, to ensure that small forces were applied to the surface.
UV-Vis spectra were collected in a Shimadzu spectrophotometer, model UV 1601PC, at wavelengths range of 190-1100 nm. In these experiments, POEA was
dissolved in water at 1.0×10⁻⁵ mol L-1, which was adjusted
to pH 5.0 and herbicides in aqueous solution were added to aliquots of this solution in various amounts, to obtain
final concentrations from 0.5×10⁻⁵ to 8.0×10⁻⁵ mol L-1 for
each herbicide. After 15 min of contact between the POEA and test compound, the UV-Vis spectrum was recorded.
Impedance spectroscopy was performed with a Solartron SI 1260 frequency response analyzer interfaced with a microcomputer, in which data were handled by a proprietary data acquisition program developed at Embrapa Instrumentação Agropecuária (São Carlos, SP, Brazil). Frequency scans were carried out in the interval from 1 Hz to 1 MHz and the working frequency was fixed at 1000 Hz, with an input signal of 50 mV. The solution pH was 5.0 throughout. For these tests, an interdigitated microelectrode was coated
with a very thin film of POEA (by dipping in a 1×10⁻⁵
mol L-1 solution at pH 5.0) and this sensor used to
measure the electrochemical impedance of herbicide solutions at concentrations ranging from near the LOD
up to 10 mg L-1.
Results and Discussion
Atomic Force Microscopy (AFM)
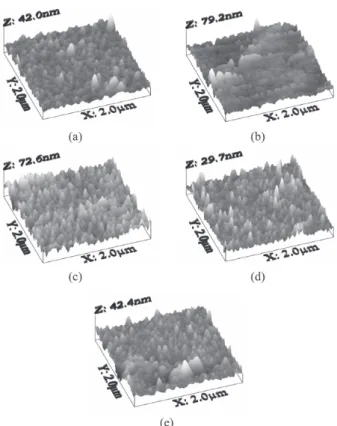
The morphological changes in the topography of the POEA film that occur through contact of the film with solutions of the various herbicides can be seen in Figure 2. In order to understand the nature of the interaction between the conducting polymer film surface and the test herbicide, first, it is necessary to study the adsorption of these films onto the substrate and their disposition (profile) on the glass surface. The film growth can be qualitatively
described as consisting of two steps: (i) molecular
adsorption of polymer chains from the evaporating
solution followed by (ii) two-dimensional cluster
organization.
The 2D clustering can be analyzed in terms of processes governed by two time-scales. It is conjectured that during the initial moments (say for 30s) the first chains to be adsorbed occupy free sites, arranging themselves in small nuclei on the glass surface. As adsorption continues, all the available sites are eventually occupied and thus the nucleation process tends to saturate, so that, the initially-formed nuclei begin to grow. This hypothesis is consistent with a growth mechanism consisting of nucleation, growth and coalescence of islands, in which the molecules remain aligned perpendicularly to the surface (or nearly so)
and form dense clusters.40 Lvov and Decher41 postulate
Interactions between the herbicides and the conducting polymer can be demonstrated by examination of the cross-section. Figure 3(a) shows the topographical profiles of POEA films adsorbed on glass, after contact with air alone or with solutions of imazaquin or atrazine. The intensity of interaction can be observed in the morphological changes and in this figure it can be seen that the imazaquin interacted more strongly than atrazine with the POEA film, in agreement with the UV-Vis results. In Figure 3(b), the weaker interactions of paraquat and metribuzin with the polymer film are visualized.
To further elucidate the effects of the herbicides on the film surface, the AFM data were quantitatively analyzed to obtain information on its roughness and degree of order. In Figure 4, the relative roughness of the POEA film surface, before and after immersion in the herbicide solutions, is graphically displayed.
It can be seen that after exposure to all the herbicides except paraquat, the film became significantly rougher. This effect was most marked with imazaquin. All the test compounds can undergo ionization in water, but imazaquin is uniquely a weak acid, possessing the carboxylic acid group, –COOH (see Figure 1(b)), which should be largely ionized at pH 5. When the imazaquin ion comes in contact
with the POEA film, the –COO– group interacts strongly
with the protonated N-atoms of the polymer.
Alone, the roughness of the POEA film is around 2.5 nm, varying by 20% from place to place on the surface. When brought into contact with imazaquin, its roughness rises to about 8.3 nm. On the other hand, interaction with paraquat has the opposite effect: the roughness falls to 2.1 nm. This herbicide is a salt with an active cation (Figure 1(d)), while those which had an intermediate effect (atrazine and metribuzin) are weak bases.
Real solids may exhibit complicated shapes with a high degree of irregularity or disorder. In these cases fractal geometry has proved useful in the analysis of rough
surfaces. Here we will describe the so-called lake analysis,
which is based on measuring the perimeter, L and area, A,
Figure 3. AFM cross-section analysis of POEA films in contact with (a) imazaquin and atrazine and (b) paraquat and metribuzin.
0.0 0.5 1.0 1.5 2.0
0 5 10 15 20 25 30 35
POEA Imazaquin
Height/nm
Height/nm
Imazaquin (a)
(b)
Atrazine POEA
Atrazine
topographical profile
in
te
ra
ct
io
n
le
ve
l
0.0 0.5 1.0
Interaction
level
1.5 2.0
0 5 10 15 20 25 30 35
Imazaquin
Paraquat Paraquat Metribuzin POEA
POEA Metribuzin
topographical profile
Figure 4. Values of roughness for POEA films after the immersion in pesticide solution. 1 – POEA; 2 – atrazine; 3 – imazaquin; 4 – paraquat e 5 – metribuzin.
of the spaces between the grains of a polymer film, so as to investigate the fractal character of its surface at the nanometric level and estimate the corresponding fractal
dimension. The program WS×M 4.0 (Nanotec Electrónica
S.L. 2003) was used to calculate these dimensions. We adopted a simple method to obtain the fractal dimension of surfaces on a nanoscale, which can be applied to self-similar or self-affine fractal surfaces. It is based on the fact that the intersection of a plane with a self-similar or self-affine surface generates self-similar ‘lakes’ or ‘islands’. The mathematical description of a surface should accurately reflect its nature and, at the same time, be compatible with diverse theoretical models that relate to the surface structure, such as thin-film growth models. With this in mind, we will analyze the topography of POEA and its interaction with the herbicides in terms of fractal geometry, the branch of modern mathematics that uses fractional dimensions to describe objects of disorder. The method of fractal geometry is particularly useful here because the model of fractal contact makes use of topographical parameters that are independent of the resolution of the instrument involved. Moreover, fractal surfaces possess the continuity properties, self similarity and self affinity. The fractal similarity dimension remains
within the range 2 ≤DSd ≤ 3, where a planar surface has
DS = 2 and an increase in this parameter represents an
increase in the roughness of the surface.
Ultraviolet visible spectrophotometry (UV-Vis)
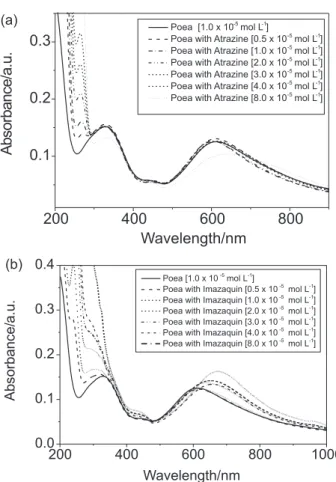
AFM analyses indicated that the herbicides interacting most strongly with POEA films were atrazine and imazaquin. Hence, these two compounds were used in the subsequent experiments on their interactions with POEA in aqueous medium. The latter are shown in Figure 5.
Working at an intermediate pH for POEA doping (pH 5.0), we note (Figure 5(a)) that the polaronic band exhibited by POEA around 600 nm suffers a shift to a higher wavelength in the presence of a large amount of
atrazine (8×10⁻⁵ mol L-1), indicating that POEA doping
occurs in the presence of this concentration, but not at
4×10⁻⁵ mol L-1 atrazine. At the same pH, imazaquin also
shifts the polaronic band to higher wavelengths (Figure
5(b)), but in this case the effect is perceptible from 2×10⁻⁵
mol L-1 imazaquin and becomes stronger at 8×10⁻⁵ mol L-1,
showing that imazaquin causes doping more readily than atrazine.
This interaction is due to a change in the conformation of chromophores in POEA, which occurs when these herbicides are added to the medium and is of great importance as far as the intended application is concerned.
Electrochemical impedance spectroscopy
The technique of electrochemical impedance spectroscopy was first used to select the working frequency (1000 Hz) and amplitude (50 mV) of the input signal to the POEA-coated electrode used as a probe to determine the herbicide concentrations in aqueous solution. The sensitivity of the probe was tested on atrazine, imazaquin, metribuzin and paraquat, at pH 5.0.
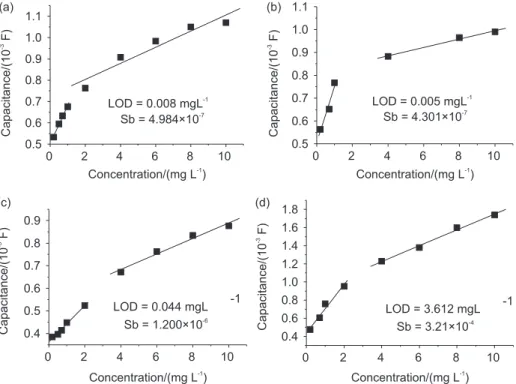
Working curves were constructed from the capacitance (F) data obtained with each herbicide and Figure 6 shows examples of curves used to determine the limit of detection (LOD) for each herbicide.
The LOD was calculated by the formula:
S S LOD 3 b
=
Once the LODs were calculated for the sensor and for each herbicide, arithmetic means were taken over the three measurement. These LODs of the POEA sensor for each herbicide are displayed in Table 1. These values
correspond only to the slope of the first straight line (readings at lower concentrations), as these had lower LODs.
It can be seen in Figure 6 that for each herbicide the working curve exhibits two different slopes, indicating that some change occurs in the surface interaction, within the concentration range tested. At lower concentrations the resulting system is dominated by the pre-concentration, controlled by adsorption, but as the concentration rises, this contribution becomes less significant and diffusion of the analyte to the surface becomes more important. In the LOD determining, the lower concentration range used
was 0 to 2 mg L-1, corresponding to the first (steeper)
gradient of the working curve; also the linear equation and correlation coefficient of the analytical curve were calculated from these data, since this range gave the lower LOD for each of the herbicides tested. It can be seen that the best (lowest) limits of detection were obtained for imazaquin and atrazine, corroborating the evidence of the
AFM images, in which the POEA films in contact with these two herbicides exhibited greater roughness and thus stronger interactions.
According to EPA (the US Environmental Protection
Agency),43 the pesticide permitted levels in question, in
soil or in water, are: atrazine = 0.2 mg L-1 , imazaquin =
0.1 mg L-1, metribuzin = 0.1 mg L-1, paraquat = 0.1 mg L-1.
This shows that these sensors are effective for the determination of pesticides atrazine, imazaquin and metribuzin, as their LODs are below the permitted values.
Conclusions
The herbicide that gave the best interaction with POEA was imazaquin, as can be seen in the results from atomic force microscopy (film roughness), UV-Visible spectrophotometry (POEA doping) and electrochemical impedance spectroscopy (LOD). AFM images showed that the POEA film became roughest in the presence of
Table 1. Results obtained in the calibration of the analytical curves*
Herbicides Slope (S) Standard dev. (Sb) Limit of Detection (LOD)/ Limit of Detection (LOD)/
(mg L-1) (mol L-1)
Atrazine 1.801×10⁻⁴ 4.984×10⁻⁷ 0.008 3.847×10⁻⁸
Imazaquin 2.481×10⁻⁴ 4.301×10⁻⁷ 0.005 1.665×10⁻⁸
Metribuzin 8.053×10⁻⁵ 1.200×10⁻⁶ 0.044 2.085×10⁻⁷
Paraquat 2.666×10⁻⁴ 3.210×10⁻⁴ 3.612 1.404×10⁻⁵
*corresponding to the gradient of the line at lowest detectable concentrations.
imazaquin, this effect probably being related to its molecular structure (type of ring structure, functional groups, etc.). In the UV-Vis spectra, as the concentration of this herbicide was raised in a solution of POEA, it was observed that doping of the polymer occurred, indicated by a shift of its polaronic band from around 600 nm towards longer wavelengths. This effect is due to a conformational change (probably following protonation of the N atoms linking the polymer chain) in the chromophore groups in POEA, caused by interaction with imazaquin. Such interactions are of supreme importance in the application of this type of sensor. Finally, the measurement of electrochemical impedance with the prototype sensor, in herbicide solutions of the, afforded a direct estimate of the LOD of each one with the POEA probe, and once again the lowest (and best) LOD was
obtained for imazaquin (0.005 mg L-1). The sensor proved
effective for the measurement of the three herbicides (atrazine, imazaquin and metribuzin), the detection limits being below the concentrations permitted by the EPA.
Acknowledgments
The authors acknowledge the financial support from Fundação de Amparo à Pesquisa do Estado de São Paulo (FAPESP – Proc. 02/07724-0), Embrapa Instrumentação Agropecuária and Conselho Nacional de Desenvolvimento Científico e Tecnológico (CNPq).
References
1. Macdiarmid, A. G.; Epstein, A. J. In Proceedings of the European Physical Society Industrial Workshop Science and
Applications of Conducting Polymers, Salaneck, W. R.; Clark, D. T., eds.; IOP Publishing: Norway, 1990.
2. Taylor, D.M.; MacDonald, A.G.; J Phys D: Apply. Phys, 1987,
20, 1277.
3. Macdonald, J.R.; Impedance Spectroscopy, Emphasizing Solid Materials and Systems, Wiley: New York, 1987.
4. Decher, G.; Hong, J. D.; Ber. Bunsenges; Phys. Chem. 1991,
95, 1430.
5. Lvov, Y.; Decher, G.; Mohwald, H.; Langmuir 1993, 9, 481. 6. Mattoso, L. H. C.; Paterno, L. G.; Campana Filho, S. P.; Oliveira
Jr., O. N.; Synth. Met. 1997, 84, 123.
7. Raposo, M.; Pontes, R. S.; Mattoso, L. H. C., Oliveira Jr., O. N.; Macromolecules 1997, 30, 6095.
8. Raposo, M.; Mattoso, L. H. C.; Oliveira Jr., O. N.; Thin Solid Films 1998, 327, 739.
9. Decher, G.; Science 1997, 277, 1232.
10. Hoogeveen, N. G.; Stuart, M. A. C.; Fleer, G. J.; Langmuir
1996, 12, 3675.
11. Stockton, W. B.; Rubner, M. F.; Macromolecules 1997, 30, 2717.
12. Pontes, R. S.; Raposo, M.; Camilo, C. S.; Dhanabalan, A.; Ferreira, M.; Oliveira Jr., O. N.; Phys. Solid State. A 1999,
173, 41.
13. Lvov, Y.; Ariga, K.; Ichinose, I.; Kunitake, T.; Thin Solid Films
1996, 284, 797.
14. Decher, G.; Hong, J. D.; Schmitt, J.; Thin Solid Films1992
210, 8311.
15. Decher, G.; Lvov, Y.; Schmitt, J.; Thin Solid Films 1994, 244, 772. 16. Cheung, J. H.; Fou, A. F.; Rubner, M. F.; Thin Solid Films 1994,
244, 985.
17. Cheung, J. H.; Fou, A. F.; Ferreira, M.; Rubner, M. F.; Polym. Prepr. 1993, 34, 757.
18. Fou, A. C.; Ellis, D.; Ferreira, M.; Rubner, M. F.; Polym. Prepr.
1994, 35, 221.
19. Ferreira, M.; Cheung, J. H.; Rubner, M. F.; Thin Solid Films
1994, 244, 806.
20. Cheung, J. H.; Stockton, W. B.; Rubner, M. F.; Macromolecules
1997, 30, 2712.
21. Decker, G.; Science1997,277, 1232.
22. Clark, S.; Hammond, P.T.; Adv. Mater. 1998, 10, 1515. 23. Li, D.; Jiang, Y.; Wu, Z.; Chen, X.; Li, Y.; Thin Solid Films
2000,360, 24.
24. Ram, M.K.; Adami, M.; Faraci, P.; Nicolini, C.; Polymer2000, 41, 7499.
25. Silk, T.; Hong, Q.; Tamm J.; Compton, R.G.; Synth. Met.1998, 93, 59.
26. Kovtyukhova, N.I.; Gorchinskiy, A.D.; Waraksa, C.; Mater. Sci. Eng., B2000, 69, 424.
27. Riul, Jr A.; Mattoso, L.H.C.; Telles, G.D.; Herrmann, P.S.P.; Colnago, L.A.; Parizoto, N.A.; Baranauskas, V.; Faria, R.M.; Oliveira, Jr O.N.; Thin Solid Films1996, 177, 284.
28. Riul, Jr A.; Dhanabalan, A.; Cotta, M.A.; Herrmann, P.S.P.; Mattoso, L.H.C.; Macdiarmid, A.G.; Oliveira, Jr O.N.; Synth. Met. 1999, 101, 830.
29. Ram, M.K.; Adami, M.; Sartore, M.; Salerno, M.; Paddeu, S.; Nicolini, C.; Synth. Met. 1999, 100, 249.
30. Angelopoulos, M.; Dipictro, R.; Zheng, W.G.; Macdiarmid, A.G.; Synth. Met. 1997, 84, 35.
31. Torres, C.M.; Pico, Y.; Mañes, J.; J. Chromatogr. A1996, 754, 301.
32. Rupp, E. B.; J. Agric. Food Chem. 1992, 40, 2016.
33. http://extoxnet.orst.edu/pips/atrazine.htm accessed in October 2004.
34. http://extoxnet.orst.edu/pips/imazaqui.htm accessed in October 2004.
35. http://extoxnet.orst.edu/pips/metribuz.htm accessed in October 2004.
37. Mattoso, L.H.C.; Manohar, S.K.; MacDiarmid, A.G.; Epstein, A.J.; J. Polym. Sci.: Part A: Polym. Chem. 1995, 33, 1227. 38. Kern, W.; Semicond. Int. 1984, 94.
39. Paterno, L.G.; Mattoso, L.H.C.; Polymer 2001, 42, 5239. Constantino, C. J. L.; Oliveira Jr., O. N.; Colloids Surf., B 2002, 23, 257.
40. Leite, F. L., Paterno, L. G., Borato, C. E., Herrmann, P. S. P., Oliveira, O. N., Mattoso, L. H. C., Polymer2005, 46, 12503.
41. Lvov, Y.; Decher, G.; Crystallogr. Rep.1994, 39, 628. 42. Ikkala, O.; Pietila, L. O.; Ahjopalo, L.; Osterholm, H.;
Passiniemi, P. J.; J. Chem. Phys. 1995, 103, 9855. 43. http://www.epa.gov/pesticides/ accessed in October 2004.
Received: October 31, 2006
Web Release Date: April 27, 2007