0103 - 5053 $6.00+0.00
Review
*e-mail: [email protected]
Laser Induced Breakdown Spectroscopy
Celio Pasquini,* Juliana Cortez, Lucas M. C. Silva and Fabiano B. Gonzaga
Instituto de Química, Universidade Estadual de Campinas, CP 6154 13084-971 Campinas-SP, Brazil
Esta revisão descreve os aspectos fundamentais, a instrumentação, as aplicações e tendências futuras de uma técnica analítica que se encontra em seu estágio de consolidação e que está em vias de estabelecer o seu nicho entre as técnicas espectrofotométricas modernas. A técnica é denominada Espectroscopia de Emissão em Plasma Induzido por Laser (em inglês, Laser Induced Breakdown Spectroscopy, LIBS) e sua principal característica está no uso de pulsos de laser como fonte de energia para vaporizar a amostra e excitar a emissão de radiação eletromagnética, a partir de seus elementos e/ou fragmentos moleculares. A radiação emitida é analisada por meio de instrumentos ópticos de alta resolução e as suas intensidades são medidas, usualmente com detectores rápidos de estado sólido. Em conjunto, esses dispositivos permitem a geração e a medida de um espectro de emissão de faixa ampla do fenômeno induzido pelo pulso de laser. O espectro registrado contém informação qualitativa e quantitativa que pode ser correlacionada com a identidade da amostra ou empregada na determinação da quantidade de seus constituintes. Essa revisão é dividida em quatro partes. A primeira aborda aspectos históricos da técnica e os conceitos teóricos relevantes associados com LIBS; então, os aspectos práticos de diversas abordagens experimentais e instrumentais empregadas na implementação da técnica são revistos de forma crítica; as aplicações encontradas na literatura, incluindo aquelas que empregam quimiometria, são classificadas e exemplificadas por meio de trabalhos relevantes recentemente publicados. Finalmente, uma tentativa de estabelecer uma avaliação global e as perspectivas futuras para a técnica é apresentada.
This review describes the fundamentals, instrumentation, applications and future trends of an analytical technique that is in its early stages of consolidation and is establishing its definitive niches among modern spectrometric techniques. The technique has been named Laser Induced Breakdown Spectroscopy (LIBS) and its main characteristic stands in the use of short laser pulses as the energy source to vaporize samples and excite the emission of electromagnetic radiation from its elements and/or molecular fragments. The emitted radiation is analyzed by high resolution optics and the intensities are recorded, usually by fast triggered solid state detectors. Together, these devices allow producing and registering a wide ranging emission spectrum of the short-lived phenomenon induced by the laser pulse. The spectrum contains qualitative and quantitative information which can be correlated with sample identity or can be used to determine the amount of its constituents. This review is divided in four parts. First, the relevant historical and theoretical concepts associated with LIBS are presented; then the main practical aspects of the several experimental and instrumental approaches employed for implementation of the technique are critically described; the applications related in the literature, including those making use of chemometrics, are classified and exemplified with relevant and recently published work. Finally, an attempt to portray an overall evaluation and future perspectives of the technique are presented.
Keywords: Laser Induced Breakdown Spectroscopy, LIBS, atomic emission spectroscopy
1. Introduction
Analytical techniques based on emission of electromagnetic radiation produced after excitation of atoms, ions or molecules present in a sample have been
samples and some type of treatment must precede their presentation for analysis. Although the measurement step is rapid, precise and sensitive, sample treatment is often slow, cumbersome and prone to induce errors due to contamination and losses. Furthermore, the necessity of sample treatment limits the use of these techniques in the field, a requirement increasingly under investigation to match the interests of the Environmental Chemistry, Process Analytical Chemistry, Forensic Analysis, Archaeological Analysis and many others areas of science that present sound arguments to make a reality of the dream of take the instrument to the untouched sample and not the inverse.
Of course many efforts have been devoted to minimize or even eliminate the necessity of sample treatment. A good example is the use of electrical arcs or sparks for vaporization and excitation of conductive samples such as metallic alloys. With the limitation of applicability to conductive samples, the technique of the classic spectrography, carried out with modern instrumentation, is capable of producing impressive results and portable instruments have been developed to permit in situ analysis
with high precision and accuracy, although with only moderate detectivities.
This review describes a modern analytical technique based on emission spectroscopy that employs a short pulse of high energy radiation generated by a laser focused on a sample, in order to attain representative vaporization and excitation. The technique is named Laser Induced Breakdown Spectroscopy (LIBS) and numerous reviews1-11 and three recent text books12-14 have already been published addressing both general and specific aspects, in the relatively short period after the technique had undergone a renewed interest in the beginnings of the eighties. On the other hand, the technique has recently experienced an exponential growth in interest, reflected by an increasing number of publications, and, apparently, its niche in the general field of Analytical Chemistry are ready to be defined. Therefore, the expectation of the present review on the fundamentals, instrumentation and applications of LIBS, including most recent achievements, is to help those who want to be introduced to the technique while providing up-to-date information on instrumentation, applications and its real potential for micro and remote essentially non-destructive and direct analysis.
1.1. LIBS technique outline
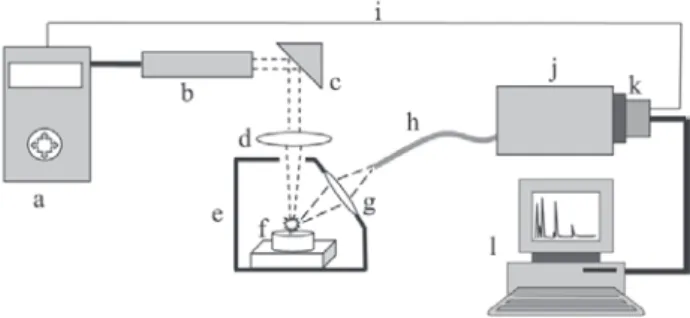
Simplicity is one of the main characteristics of a LIBS system. The necessary instrumentation can be summarized
as depicted in Figure 1, as a short duration (ca. 5 ns or
shorter) pulsed laser, a focusing lens, collecting optics for the emitted radiation, a wavelength analyzer and a detector, all computer controlled. The simplest way to produce the analytical information (spectral lines of emission generated by the analytes) using LIBS is to fire a single laser pulse on a solid sample. The impinged radiant energy of the pulse must be higher than the breakdown energy for the sample material. Thus, in the first instants, the atomic and molecular structure of the sample will be broken and heated, causing vaporization of a small fraction of the material (from hundreds of ng to a few µg). This vaporized material may contain free neutral atoms, ions, molecular fragments and free electrons. Further the incoming energy of the same laser pulse can sustain high temperature plasma (> 10,000 K) in which the vaporized species can be excited and return later to their less energetic levels by emitting electromagnetic radiation. These wavelengths can be selectively associated to the presence of the analytes and whose intensity is proportional to their content in the sample. Despite being generated by distinct phenomena, data analysis and interpretation are made much in the same way as in the old arc/spark excitation spectroscopy as well as in modern ICP OES instruments. Of course, the sample, in the case of LIBS, does not need to be conductive.
1.2. Historical summary
The laser is the fundamental and distinctive part of the LIBS instrument. Therefore, this technique’s history passes, initially, by the theory of stimulated emission of radiation proposed by Einstein early in 1917,15 which later made the laser existence possible. The first insight on a laser operating in the visible spectrum range was due to Shawlow and Townes in 1958.16 Maiman constructed the first ruby laser employing optical pumping in 196017 and
two years later Brech and Cross detected, for the first time, the spectrum of a plasma induced in a material vaporized by a ruby laser.18 However, an auxiliary spark source was employed to produce the plasma and subsequent spectral emission. The first direct spectral analysis made by LIBS can be attributed to Runge et al. in 196419 and the first model for the laser breakdown of a gas was proposed only one year later by Zel’dovich and Raizer.20
The first commercial instruments were fabricated by Jarrell-Ash and Carl Zeiss in the beginning of the 70’s. However it should be mentioned that these instruments employed the energy of the laser pulse only to ablate the sample while excitation was made by an electric arc.
The advent of more stable, fast and robust lasers, with better beam quality, high resolution/wide spectral range dispersion optics (such as the echelle based spectrographs), and sensitive gated image detectors based on arrays of intensified charge coupled devices (ICCD) provided strong impulses towards improving and applying LIBS since the beginning of the 80’s.21,22
The last 26 years have witnessed the results of the efforts made by a number of companies and research laboratories towards the development of commercial instruments, of new applications and of theoretical models providing a profound insight into the fundamentals of LIBS and associated phenomena. In the last decade, for instance, the number of papers related to fundamentals and applications of LIBS reached about 600. The number of papers published on LIBS during the year of 2005 was about 350 and an exponential growth may be foreseen for this technique.23
1.3. The LIBS concept and related phenomena
1.3.1. Initiation of the induced plasma
Recently, it has been accepted that the acronym LIBS should be used to refer to the spectroscopic technique that employs a laser pulse as the only source of energy to simultaneously prepare the sample and produce an emission spectrum of analytical value. The name of the technique does not include a “plasma” term. The main reason for this omission is in the fact that the LIBS is not always characterized by plasma formation. A Debye number with values equal or higher than unity (in order to achieve a plasma condition) is not always observed in a LIBS experiment. Therefore the acronym LIPS where the “P” states for “plasma” is not recommended,23 although it is still possible to find, in the specialized literature, papers employing this acronym for the same technique as LIBS.
The LIBS concept, which distinguishes the technique from others based on induced spectral emission, is that of
using a laser pulse to ablate a minute quantity of the material to a condition that may then be excited by the energy supplied by the same pulse or by a subsequent pulse. This latter case involves the double-pulse technique, also described in this work. Of course, if the material is already in the gaseous phase, part of the energy does not need to be spent in sample vaporization. Many of the distinct characteristics of LIBS, such as its quasi-non-destructive and micro-analytical character, speed, in field and remote applications for both conductive and non-conductive samples, which can be liquids, solids and gases or even in aerosol forms, come from this concept.
The basic phenomena that need to be considered to understand and control a LIBS experiment for its evolvement into a useful analytical tool are: first, those related with the laser interaction directly with the sample; then, later, the laser interaction with the ablated material (electrons, molecules, atoms, ions and tiny particles) and the coupling of its remaining pulse energy are of primordial importance to reach a condition of reproducible and sensitive excitation and spectral emission.
The irradiance is a very important paramenter regarding the effects caused by the laser interaction with the sample and plasma evolution. The average irradiance of a stigmatic collimated pulsed laser beam at the focusing area (beam waist) is given by:
If = πELD2/ 4τLf2λ2(M 2)2 (1)
where If is the irradiance (usually expressed in W m-2), E L
is the energy of the laser pulse, D is the diameter of iluminated aperture of the focusing lens (or the laser beam diameter), τL is the pulse duration, f is the lens focal length,
λ is the laser wavelength, and M2 is the the beam
propagation ratio. For a beam ideally Gaussian, M2 is equal to 1. Typical values for beams produced by Nd:YAG lasers are between 2 to 10. Fluence is the time integrated
value in J m-2.
composition and to the composition and pressure of the atmosphere surrounding the sample, as well as, to the laser wavelength.
The breakdown of the target material, occurring at the initial moments after the laser pulse strikes the sample target (up to few ps), is reached when the density of free carriers (electrons) reaches about 1018 cm-3. The existence of such a quantity of free electrons promotes a high optical absorption in the plasma, allowing it to be extended in direction of the beam which sustains it for the remainder of the laser pulse.9,12
Researchers committed to studying this stage of laser-sample interactions agree that the way the plasma is initiated differs for different media. If the target material is a gas, seed electrons will be generated by multiphoton absorption or cascade ionization. The tunnel effect can contribute when irradiances above 1012 W cm-2 are employed. Cascade ionization will start if, at least, one free electron is present in the path of the laser beam. This electron can be produced by the effect of cosmic ray ionization or by means of a breakdown induced in a gas impurity. This electron will gain energy by means of inverse bremsstrahlung (photon
energy from the laser beam transferred to continuously increase the kinetic energy of the electrons).24 The energetic electrons will induce, by collision, the ionization of other atoms whose electrons will continue to absorb energy from the laser, causing an exponential increase in the number of free electrons.
Multiphoton absorption causes ionization if the sum of the energy of the absorbed photons is greater than the ionization potential of an atom. Only short wavelength photons can supply such energy as the ionization potential for most gases are greater than 10 eV. Meanwhile, the probability of simultaneous absorption of photons decreases with the number of photons necessary to cause ionization. Therefore, this phenomenon can play a relevant role in the generation of free electrons only if the laser beam is of short wavelength or if the gas is at low density when the collision-based cascade ionization diminishes. When the target sample is a liquid, the mechanism of
breakdown is not as well known as in the gas case. The liquid is treated as an amorphous solid and its electron movement is quite complex.25 However, the formation of an initial number of free electrons is described by the same type of interactions, based on cascade ionization or multiphoton absorption.
For solid samples their conductive (metallic) or non-conductive (isolator) nature is relevant to define the mechanism of initiation of the laser-induced plasma. For metallic samples, electrons of the conduction band absorb laser photons and the energy of excited electrons is dissipated by their collisions with the lattice of the material. This is a thermal conductivity phenomenon. Direct absorption of the laser energy by the ions in the lattice is prevented by the dielectric screening provided by the electrons.
In semiconductor and isolator solids the creation of electron-hole pairs by multiphoton absorption, instead of the electron heating that occurs in metals and their recombination, among other electron-lattice interactions, is considered one of the main mechanisms of energy dissipation acting during the initialization of the plasma in this type of material.26
1.3.2. Plasma evolution and termination
Although the initial phenomena involved in the establishment of the initial breakdown plasma differ as a function of the nature of the target sample, its further evolution apparently occurs in a similar way. The ablated material expands at supersonic velocities producing a shock wave which propagates from the surface towards the surrounding atmosphere. The laser plume continues to absorb energy from the laser during the duration of the pulse, the species are excited producing an emitting plasma that is visible to the naked eye. Then the plume starts to reduce its velocity of propagation due to collisions with the surrounding gas, and slows down to speeds close to that of sound. The plasma will then cool down by self absorption (quenching) and recombination between electrons and ions, generating neutral species and clusters after plasma extinction.
A typical time elapsed since the initiation of the process of plasma formation, shortly after the laser pulse reaches the sample surface, till its extinction, is from a few tenths of microseconds to a few milliseconds.
1.3.3. Ablation
Ablation is the sampling process of the LIBS analytical technique when applied to solid or liquid samples.27 It limits the amount of constituents (analytes) that will be detached from the sample by the laser pulse and introduced into the
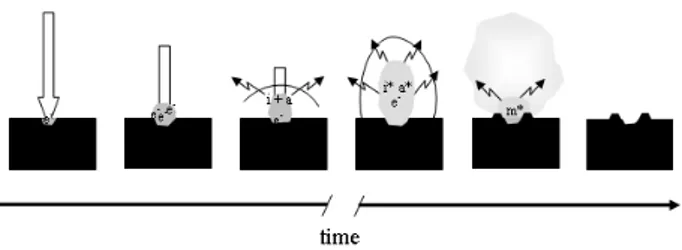
Figure 2. Sequence of events following the striking of a focused short
laser pulse (ca. 5 ns) on the surface of a solid sample. The thick arrow represents the laser pulse and its length the pulse duration. e-, free
induced plasma, contributing to its formation and expansion by supplying the neutral and ionic species that, together with the free electrons, will sustain the plasma by means of laser absorption (multiphoton ionization or inverse
bremsstrahlung). In fact, if a plasma is formed in a
surrounding medium of gaseous species with high ionization potential (helium, for instance) the only way it can be sustained is by means of the presence of the ablated material. Similar to any other analytical sampling process, the ablated portion of the sample should be representative of the original sample, independent of whether micro or bulk analyses are being considered. It means that this process can not induce fractionation of the sample constituents, altering their composition in the ablated material in relation to that in the original sample. Of course, adequate calibration can overcome this problem by correlating the composition of the ablated material with that of the sample by means of the use of reference standards which match the samples.
Ablation has been the subject of many studies, both theoretical and experimental, whose main objectives are to understand the relationship between the various instrumental parameters (pulse duration, laser wavelength and pulse irradiance and fluence), sample characteristics (thermal conductivity, thermal diffusivity, surface reflectivity, optical absorption coefficient, melting and boiling point), environmental atmospheric composition and the amount of ablated material.28,29 Remarkable differences are observed when the pulse duration is reduced from nanoseconds to pico and femtoseconds.28 For the shorter pulses the time scale approaches or is below the phonon relaxation time. It means that the energy of the laser pulse must be transferred to the material before it can reach the thermal equilibrium. The ablation process is more related to photo-physical rupture of bond than to the thermal melting, boiling and vaporization found with the nanosecond time scale. It is advocated that ablation produced by such short laser pulses can avoid or minimize fractionation and contribute to the reproducibility of the LIBS signal. Another interesting characteristic of the femtosecond pulses is that the induced plasma expands very quickly (at least at an order of magnitude faster than with the nanosecond scale) because it is not reheated by absorption of the laser beam. The emission line intensities, of course, also decay faster and over a negligible background (low bremsstrahlung emission) eliminating
the necessity of using time resolved detectors.
1.3.4. Plasma shielding
Another relevant phenomenon occurring during plasma expansion is related to its capacity of impeding the
remainder of the laser pulse energy from reaching the sample surface. The phenomena is called plasma shield and its immediate effect is to reduce or stop the ablation of the sample after plasma induction.30 If the plasma shielding occurs too early, the mass ablated may not be enough to produce a measurable analytical signal. The main process leading to plasma shielding is absorption of the laser energy by the electrons (inverse bremsstrahlung) and multiphoton
ionization (mainly for shorter laser wavelengths). For instance, if the atmosphere surrounding the sample is argon (a gas with a low ionization potential), the plasma shielding is stronger than if helium (high ionization potential) is employed. Emission signals about 16 times higher were observed for copper emission from a pure metallic sample when helium replaces argon as the atmosphere gas in a LIBS experiment.31 The crater volume eroded in the sample is proportionally higher for the experiment made in a helium atmosphere. The presence of an easily ionizable gas assists by increasing the electron density of the plasma due to collisions between ablated atoms, electrons and ambient gas. The increased electron density intensifies the laser absorption, causing shielding.
The large reduction of interactions among neutral and ionized species and electrons when ultra-short (fs) pulses are employed explains the low plasma shielding observed for LIBS carried out with laser pulses in the range of hundreds of femtoseconds.7, 9
In principle the plasma shield can be taken as an undesirable phenomenon preventing LIBS from reaching better detectivity, by decreasing the ablated mass from a sample. However, it should be pointed out that when the absorption of the laser radiation occurs in the shielding process, it gives rise to a higher plasma temperature which can increase the emission intensity and dissociate any tiny particle that has been ablated.
The collective behavior of the optically dense plasma obtained at high power density defines a plasma resonant frequency, υp, given by
υp = (4πnee2 / me)½ = 8.9 x 10³ (ne)½ (2)
in which ne is the electron density (cm-3), in the plasma,
e, is the electron charge, and me, is the electron mass.
There could be a critical electron density for what the plasma frequency equals the laser frequency, υl, (υp =υl). At this point the laser radiation is strongly absorbed by the plasma. When υl <υp, the laser radiation is reflected by the plasma. Both phenomena reduce the mass ablated from the sample.
Considering the critical electron density for the wavelength 1064 nm is about 1021 cm-3, the remainder of a typical fundamental Nd:YAG laser pulse (5 ns, 1064 nm) will be reflected by the plasma surface as long as this density can be sustained.
1.4. Theoretical studies and calibration-free LIBS
Theoretical studies related to LIBS are carried out by means of models proposed to account for the effect of relevant factors associated with laser parameters, the sample and its environment.29,32-37 Then, the results predicted by models can be evaluated against experimental data.29,32
There are two motivations to theoretically study plasma formation and its optical properties. One is to better understand the phenomenon of plasma formation and evolution and the generation of the analytical spectral emission signal. A good model should be able to predict accurately the spectral distribution of the emitted radiation. The other is related with the search for absolute analysis, the so-called “calibration-free LIBS”.
The models continue to be improved and more and more effects are added to improve comparisons with the experimental results. For instance, in a recent paper28 a model to describe the role of laser-induced melting and vaporization of metals during LIBS analysis considered: (i) laser-solid interaction, melting and evaporation of the
metallic sample, which is described with a 1-D heat conduction equation; (ii) vapor plume expansion at an
ambient pressure of 1 atm, calculated with fluid dynamics equations, such as continuity equations of vapor mass density, total mass density (vapor + atmospheric gas), momentum (Navier-Stokes) and energy; (iii) plasma
formation in the expanding vapor plume, where (because of the collisional regime) the local thermal equilibrium (LTE) approximation was made, which allows the degree of ionization to be calculated with the Saha equation; (iv)
laser-plasma interaction due to inverse bremsstrahlung and
photo-ionization, which results in plasma shielding of the incoming radiation of the laser pulse. However, the authors recognized that other processes such as nanoparticles formation, splashing of the molten target and explosive boiling of the target, may play an important role in the way that the laser interacts with the sample and that the plasma evolves. Probably these and many other factors will be included in future papers addressing theoretical studies of LIBS in order to describe the induced plasma more accurately.
Models that include the capacity of predicting the temperature, electron density, dominant broadening mechanism (collision or stark), the temporal evolution of
the plasma temperature, the spatial and temporal distributions of atom, ion, electron densities and the plasma spectrum in a pre-selected wavelength window are now being developed.38,39 These models, which supply a theoretical way to link the observed spectral features to the plasma composition, make absolute analysis (calibration-free LIBS) a more and more realistic issue.
The plasma experimental parameters are usually estimated from spectroscopic data generated by the plasma itself, namely by the line intensities and their ratio which reflect the relative population of neutral or ionic excited species in the plasma. The more relevant parameters are the plasma temperature (T), and electron density (ne).
The plasma temperature can be estimate from the Boltzmann and Saha equations. The first applies for the relative population of energy levels of one species, while the second applies for the neutral and its ionic forms distribution. The use of the Boltzmann distribution results in the following equation,
I’/I = (λg’A’/ λ’gA) exp[-(E’- E)/kT) (3)
where I’and I are the line intensities (or integrated line intensities) for a given species, g and g’ are the statistical weights of the levels, E and E’ are the levels energy corresponding to the emission lines, k is the Boltzmann
constant, A is the transition probability, and T is the plasma tenperature. Equation 2 can be employed to determine the temperature by the two line intensities method. However, the measurement of relative intensities is difficult to access with precision. Therefore, the temperature can be found more precisely if multiple measurement of lines intensities are made and a graph is produced as result of the equation below,
ln(Iλ/gA) = -E/kT – ln(4πZ/hcNo) (4)
where I is the line intensity, λ, is the line wavelength, E is the energy of the upper state, Z is partition function usually taken as the statistical weight of the ground state, h is the
Planck constant, c is the light speed, and No if the population of the ground state. The graph of the rigth term against E will result in a straight line whose slope is -1/kT.
The Saha equation also can be employed for the estimation of the plasma temperature. The equation is,
N(Z,0)ne/N(Z-1,0) = 2g(Z,0)/g(Z-1,0)(mkT/2π’2)3/2
exp(∆E/kT) (5)
ion stage Z-1, m is the electron mass, ∆E is the ionization energy of stage Z relative to stage Z-1 and ne is the electron density of the plasma. In order to make use of this equation ne must be estimated from other experimental data.
The experimental estimation of the electron density of the plasma is made by means of measurements of some emission line widths. The effect of the electron density on the line width, knowing as Stark effect, allows relating these parameters by the equation,
wtotal≈ [1 + 1.75 P(1 – 0.75r)](ne/1016)w (6)
where wtotal is the line half-width at half maximum
(HWHM), P is a parameter giving the ion contribution, r
is the ratio of the mean distance between ions to the Debye radius and w is the HWHM Stark width caused by the
electron density. The values for w can be found in the
literature for P = 0 and ne = 1016 electrons cm-3.
In the field of calibration-free LIBS, it is possible to find some papers employing the experimental results (line emission intensities, for instance) to directly infer the constituent concentrations of the ablated sample. For instance, it has been demonstrated that the analysis of 9 elements in an aluminum alloy can be carried out by employing the spectral line intensities detected from all constituents of the sample over a wide spectral wavelength range and plotting a family of Boltzmann curves.40 An improved procedure was developed to account for line self absorption (a effect that induces non-linearity to the analytical curve) and applied to the analysis of steel, with even more success.41
Research in the field of calibration-free LIBS will certainly continue to grow and it represents a very interesting aspect of the technique with respect to overcoming one of its drawbacks related to severe matrix effects the characteristics of the sample can impose on the emission spectra.
One important factor to be considered in calibration-free analysis by LIBS is fractionation. If the relative composition of the analytes in the plasma is altered by the ablation process (something that is more than reasonable) then only theoretical models capable of including such effects will permit accurate calibration-free applications. However, this sort of drawback may be minimised, in the future, via instrumentation, by employing shorter pulse (fs) lasers that minimize fractionation.42
1.5. LIBS analytical signal
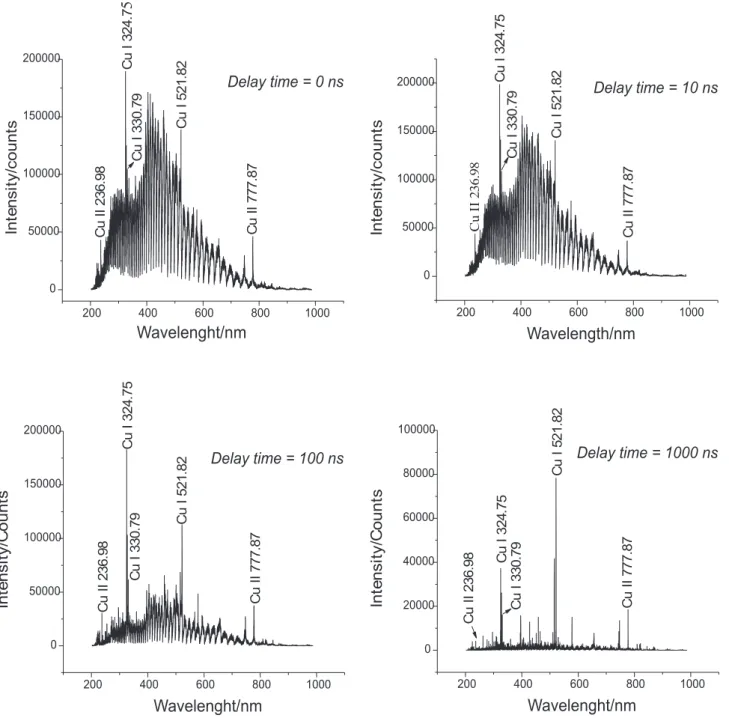
Figure 3 shows typical LIBS signals obtained by shooting pulses of 5.5 ns of a Nd:YAG laser of 120 mJ at
an irradiance of about 16.7 x 10¹⁰ W cm-2 onto the surface of a sample of copper foil. The signals were obtained by integrating the emitted radiation for 1 µs after 10, 100, 1,000, 2,500 ns of the laser shooting.
The intense continuous background, due to the major
bremsstrahlung emission mechanism, predominates at the
first instants of the plasma life. Emission lines are broad mainly due the stark effect caused by the high density of free electrons. However, after a few hundreds of nanoseconds, characteristic atomic lines can be very clearly distinguished as the free electrons start to be captured by ions and neutral atoms and the highly excited species decay to lower energy levels. At the same time, line narrowing is observed as the major effects causing line broadening (collision and stark) become weaker. As the plasma expands and cools the relative intensities of the emission lines can change due to energy distribution among the plasma species. Finally after a while, the emission signal is representative only of the most persistent lines of the elements present in higher concentrations in the sample.
The ability to monitor the emitted radiation with time resolution of nanoseconds results in a useful way to select the most informative and reproducible sampling time window of the whole life time of the plasma. Some authors have named this technique Time-Resolved Laser Induced Breakdown Spectroscopy (TRELIBS).43,44 Modern detectors, described in the next section, based on ICCD technology are capable of achieving such temporal resolution and are contributing to make LIBS into a more useful analytical tool. With common lasers such as Nd:YAG and with pulse durations in the range of few nanoseconds, TRELIBS has become the most popular way to improve the analytical performance of the laser induced plasma spectrometry.
The use of time-integrated spatially resolved LIBS (TSRELIBS) has also been employed to sample the plasma plume in a region where background radiation is not intense.45 Despite this approach can simplify the LIBS instrumentation by preclude the use of expensive gated detectors, it has not achieved the same popularity of TRELIBS due the physical instrumental modifications (positioning of the collecting optics) that need to be implemented during signal optimization. On the other hand, the control of the delay time after shooting the laser pulse is, by far, simpler and already included in the software of the gated cameras.
Therefore, data treatment is very simple for most of the applications. The severe effects of the sample matrix can be overcome by employing matched standards, while the lack of reproducibility of the emission intensity associated with instrumental variations can be corrected by the use of an internal standard, where intensity ratios (analyte/ internal standard) are used to construct the analytical curve instead of absolute peak heights.
2. Instrumentation
Song et al.6 have recently published a review
specifically about the instrumentation used in LIBS, though several other reviews1-11 about LIBS applications also discuss the instrumentation related to this technique. In addition, reviews about general spectroscopic instrumentation, detectors for spectrometry, and lasers are
Figure 3. Set of spectra obtained for a time resolved LIBS experiment after six laser pulses fired on a fresh surface of a 1.0 mm thick copper foil. Each spectrum was obtained by integrating the emitted radiation for 1 µs after a variable delay time had elapsed after the laser pulse was applied. Laser: Nd:YAG, 120 mJ pulse-1. Pulse duration: 5.0 ns. Irradiance estimated at the sample surface: 16.7×10¹⁰ W cm-2. Wavelength selector: Echelle Andor 5000. Detector:
very useful for understanding the principles of operation of some devices used in LIBS instrumentation.46-54 As a typical LIBS instrument is made up of well defined parts, including a laser source for sample ablation and excitation, an optical system for driving and collecting the laser and plasma radiations, a wavelength analyzer, and a detection system, the following sections will describe the instrumentation in this sequence, highlighting the technological advances of recent years. Two additional sections describe mobile instruments, due to the increasing interest in this area, and commercial instruments, which, after a premature commercialization in the 1960s and 1970s, have only recently become available again.
2.1. Lasers
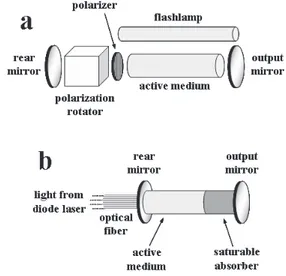
A laser source is basically constituted of an active medium, where the laser radiation is generated (by energy decay of an excited species) and amplified by a process called light amplification by stimulated emission of radiation (giving origin to the acronym LASER), and an excitation source for this active medium. The active medium is placed between two dielectric coatings (mirrors), constituting the so-called laser cavity, where one of them is highly reflecting at the laser radiation wavelength (rear mirror) and the other one is partially reflecting (output mirror) so that the laser beam can be extracted. As a result, the generated radiation passes through the active medium several times, re-exciting it and, if the energy losses in this process are lower than the gain, the final emitted radiation is amplified. The active medium can be a gas, such as CO2, N2, a combination of He/Ne, or excimers (a halogen bonded to a noble gas); a liquid, such as an organic dye solution, giving origin to dye lasers; or even a solid, such as ruby (a Cr3+-doped aluminum oxide crystal), Ti:saphire (a Ti3+-doped aluminum oxide crystal), Nd:YAG (a Nd3+-doped yttrium-aluminum garnet crystal), giving origin to solid state lasers. The active medium can be excited, for instance, by an electrical discharge, common for gas lasers, or the incidence of photons, more used in solid state lasers. The excitation by photons is made using lamps, called flashlamps (such as a xenon glow discharge lamp), and, more recently, another laser, such as a diode laser (a laser whose cavity is placed within a light emitting diode).5,51-54
As the LIBS technique involves the application of a laser pulse on a sample surface, the laser source must employ some mechanism to extract a pulse of radiation with a reproducible duration time, also called pulse duration, from the laser cavity. This can be made simply by pulsing the flashlamp, where the laser pulse will be
produced as long as the energy amplification in the cavity is above its losses until the end of the flashlamp pulse, or, in a more complex way, by techniques such as mode-locking, much employed in ultra-short pulse lasers (discussed later), and Q-switching. Both can be active or passive. Q-switching is based on preventing radiation amplification from successive traveling in the active medium by increasing the energy losses and, suddenly, enabling emission by fast loss reduction.51-55
In active Q-switching, the variation of the energy losses is made by a combination of a polarizer and some device for polarization rotation inside the laser cavity, between the active medium and the rear mirror.51 Therefore, after the initially generated radiation passes through the polarizer, becoming polarized, the switching between no polarization rotation and 90o rotation enables fast switching between activation and deactivation of the laser beam, allowing the production of laser pulses with a few nanoseconds of pulse duration, up to tens of hertz of pulse repetition rates, and up to hundreds of millijoules of pulse energy. The polarization rotation can be made by an electro-optical device (used in almost all papers employing active Q-switching) such as Pockel’s cell or an acousto-optical device,56 which are based on the interaction between the electromagnetic radiation and an electrical or acoustic wave, respectively, propagating in a crystalline medium.
repetition rate, leaving the other pulse parameters unchanged, such as the pulse energy and the pulse duration, which are extremely stable. Microchip lasers present lower pulse to pulse amplitude variation (by one order of magnitude), higher repetition rates (up to tens of kilohertz), and lower pulse durations (low to hundreds of picoseconds) than do solid state actively Q-switched lasers.55,57,62 On the other hand, they produce pulses with lower energies (generally up to hundreds of microjoules for each pulse), which can be partially compensated by the high laser beam quality (described by the beam propagation ratio, M2, discussed below), allowing focusing
to a micrometer sized spot (compared to spots of tens of micrometers generally obtained with solid state actively Q-switched lasers),57,63 which increase the energy and power delivered per surface area (called fluence and irradiance, respectively).
Recently, Noll23 proposed that papers dealing with LIBS should report, in addition to such basic information about the laser source as the wavelength and pulse duration, at least the irradiance, the beam diameter at the sample surface, and the detection timing (discussed in the section called Detecting Systems). The beam diameter describes the extent of an energy density distribution in a cross section of the beam at an axial location. As the laser beam is commonly conducted to the sample surface using some kind of convergent lens, several papers also inform the beam diameter at the focus, called beam waist diameter, and the position of the beam waist in relation to the sample surface, called beam waist position. Another important parameter of a laser source is the beam propagation ratio, which is related to the quality of the laser beam produced. The beam propagation ratio of a laser attains the minimum value 1 for an ideal Gaussian distribution of the energy density at the cross section of the laser beam (highest beam quality). Lasers typically used in LIBS present beam propagation ratio values ranging from 2 to 10. In relation to the laser pulses, it is also important to report the number of warming-up pulses, used to stabilize the thermal state of the laser (blocked so as not to irradiate the sample), the number of pre-pulses, applied to the sample in order to remove surface contaminations or surface layers, and the number of measuring pulses, employed to generate plasmas whose emission is acquired and analyzed.
Historically, different kinds of laser have been used for LIBS applications. The initial LIBS experiments were carried out using a 694 nm ruby laser with 50 ns pulse duration by Brech and Cross in 1962.18 The lack of control of pulse to pulse stability of these laser sources led to the development of gas lasers and, in 1980s, solid state lasers.5
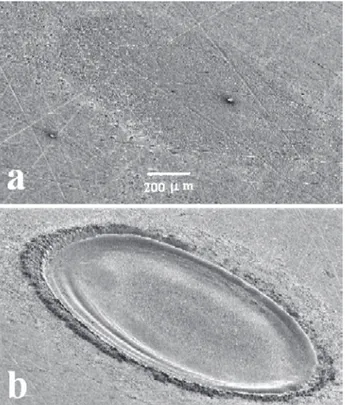
Nowadays, although several LIBS applications employing gas lasers can be cited,64-68 and, in spite of the advantages of using ultra-short pulse lasers (discussed later), the more used laser source in LIBS is the Nd:YAG solid state laser, especially the actively Q-switched one. In addition, the use of diode pumped Nd:YAG laser sources instead flashlamp pumped ones is increasing, even with the higher costs of the diode pumped ones, due to their reduced dimensions, better pulse-to-pulse reproducibilities and lower beam propagation ratios (down to 1.3).23 Illustrations of a flashlamp pumped actively Q-switched solid state laser and a diode pumped microchip laser are shown in Figure 4 and photographs of craters produced by one and one thousand consecutive laser pulses on a surface of a steel sample, by a flashlamp pumped actively Q-switched Nd:YAG laser (1064 nm, 5 ns pulse duration, 120 mJ pulse energy), are shown in Figure 5. For the microchip laser represented in Figure 4, the rear mirror must be transparent to the wavelength of the radiation emitted by the diode laser (different from the wavelength of the radiation produced by the microchip laser), so that the active medium can be excited.
The laser wavelength depends on the transitions from higher to lower energy levels in the laser cavity, resulting in emission of radiation, which depends on the composition of the active medium. For instance, CO2 lasers emit in the mid-infrared (MIR) spectral region,64 excimer and N2 lasers emit in the ultraviolet (UV) region,65-68 and Nd:YAG lasers emit in the near-infrared (NIR) region. One paper illustrates the energy transitions in the Nd:YAG active medium showing the main transition that gives origin to the radiation at 1064 nm.50 The laser wavelength
Figure 4. Illustrations of (a) a flashlamp-pumped actively Q-switched
can also be changed to lower values by simply placing a wafer of an appropriate non-linear optical crystal, such as potassium titanium oxide phosphate (KTP) or beta barium borate (BBO), at the output mirror of the laser.55,69 This is very useful with solid state lasers, such as the Nd:YAG laser, where the frequency of the laser radiation can be multiplied, enabling wavelength conversion from NIR down to the UV region, by placing one or more optical modules, each containing a piece of an appropriate non-linear optical crystal, at the laser output. Reviews about non-linear optical crystals used for laser wavelength conversion can be found in literature.70,71 In LIBS, the laser wavelength, or the photon energy of the laser, affects the processes taking place in the formation of plasma, such as the creation of initial free electrons, and the laser-plasma interaction. It is recognized that the leading part of the laser pulse produces the plasma while the trailing part interacts with it by means of laser absorption. The formation and growth of free electrons and plasma initiation occur mainly by multiphoton ionization when using lasers emitting in the UV region whereas cascade ionization is the prevalent mechanism when using lasers emitting in the infrared (IR) region. After plasma formation, absorption of the laser radiation in the plasma occurs mainly by inverse bremsstrahlung absorption,
which increases as the laser wavelength increases.24,72-74
As a result, a UV laser pulse favors higher increasing rates of surface temperature and higher maximum surface temperatures (higher energy reaching the sample surface) and an IR laser pulse allows higher maximum plasma temperatures, higher maximum electron densities and higher plasma expansion (higher energy absorption by the plasma and greater laser-plasma interaction).75,78 This leads, in general, to a higher ablation efficiency (amount of mass removed per unit energy delivered) and reproducibility, a lower fractionation and a lower background continuum emission when using UV lasers, as described by several papers,27,76-79 and lower threshold fluences (minimum fluence to achieve ablation or a measurable emission signal) when using IR lasers, as described by Cabalín and Laserna80 in the analysis of different metals and by Gómez et al.81 in a study of
removing graffitis from urban buildings. They also reported lower matrix effects due to different melting points of the metal samples and a higher removal efficiency of graffitis when using IR lasers in comparison with UV lasers. In addition, a UV laser beam generally can be focused to lower spot diameters on the sample surface.80,82 That is why UV lasers are more used when a higher spatial resolution is required, as in microanalysis for surface mapping.83 In spite of these differences, Cabalín
et al.82 reported similar analytical figures of merit
(analytical curves, correlation coefficients, linear dynamic ranges, analytical precision and accuracy) when comparing the use of UV and visible laser radiation for the quantitative analysis of 4 minor elements in stainless steel samples when internal standardization (using a Fe line) was employed. In addition to several papers dealing with comparisons between laser wavelengths ranging from UV to NIR for LIBS applications, cited previously, Detalle
et al.84 published one of the few papers comparing a Nd:YAG laser at its fundamental emission (1064 nm) with a laser emitting at a higher wavelength, in this case a 2940 nm Er:YAG laser, using air and helium atmospheres. Although the pulse durations of the lasers were very different, which notably influenced their comparison, they reported a higher increase of emission lines and a higher increase of the maximum plasma temperature by changing from air to a helium atmosphere and a higher linearity when using the Er:YAG laser for the quantitative analysis of Mg and Si in aluminum alloy samples.
The laser pulse duration is given by the full width at half maximum (FWHM) of the pulse profile (laser energy versus time).23 In LIBS, the pulse duration also affects plasma formation and properties and, therefore, the analytical results. Although most papers dealing with LIBS still employ lasers with pulse durations on the order of
Figure 5. Photographs of aluminum samples showing the ablation
nanoseconds, using gas lasers and, mainly, Nd:YAG lasers, lasers with pulse durations on the order of femtoseconds, called ultra-short pulse lasers, have became available in recent decades and their application in LIBS have increased over the last years. These lasers generally employ mode-locking techniques in order to extract the ultra-short laser pulses. Initially, active and passive mode-locking techniques were used, which are similar to those of active and passive Q-switching, but employing a periodic variation of the energy losses (loss modulation) above and below the constant cavity gain, with a shorter time below the gain (which defines the pulse duration) and a period depending on the cavity length and the propagation velocity of the laser pulse (cavity round-trip time).52-54 The first mode-locked lasers were developed in the mid-1960s using ruby or a Nd:Glass (a Nd3+-doped silicon oxide crystal), enabling the production of laser pulses with durations on the order of picoseconds for the first time.85,86 The first femtosecond lasers were colliding-pulse mode-locked dye lasers, which also employ a dye-chain amplifier for energy amplification, developed in 1980s, and allowing pulse durations down to 30 fs.87,88 However, self mode-locked (a kind of passive mode-locking using the called Kerr lens inside the laser cavity) Ti:sapphire lasers, which are easier to use and now allow application of laser pulses with pulse durations down to a few femtoseconds, are replacing dye lasers for ultra-short pulse applications ever since their development in the early 1990s.89,90 In addition to the improvements in the laser cavity and in the mode-locking techniques, energy amplifiers based on the technique of chirped pulse amplification have replaced the dye-chain amplifiers used in the past. Chirped pulse amplification is based on stretching the laser pulse, which leads to a reduction in its maximum intensity, followed by its amplification and a subsequent recompression back to the femtosecond scale.52,90,91 In recent years, most papers dealing with ultra-short pulse lasers applied to LIBS use the self mode-locked Ti:saphire lasers employing chirped pulse amplification.75,92-96 In LIBS, when a laser pulse with a duration on the order of femtoseconds is applied to the sample, as this time is shorter than the thermal coupling time constant in matter (about 1 picosecond), the mechanisms leading to plasma formation are dominated by multiphoton ionization over thermal decomposition, with a subsequent plasma decrease without further interaction with the laser pulse.97 This results, for LIBS applications, in comparison with nanosecond lasers, in higher ablation efficiencies, lower maxima and faster decreases in plasma temperatures.98,99 In addition, as the pulse energy is delivered over a very short time duration, higher irradiances are achieved with lower ablation threshold energies.92,100 The higher ablation efficiencies are
due to a precise material removal by explosive ejection of matter practically without any thermal (such as melting) or mechanical damage to the sample surrounding the ablated region,101,102 leading to higher repeatabilities on successive ablations and lower relative standard deviations (RSD) on emission measurements. The lower plasma temperatures lead to lower blackbody (fourth power temperature dependent) and background emissions,94,95 allowing the detection to start earlier after the application of the laser pulse (sometimes without any time delay),93,94 and practically negligible emission from the surrounding atmosphere.92,95 As thermal decomposition does not take place in plasma formation and the melting and boiling points of several compounds are not achieved by the lower plasma temperatures, a differential thermal evaporation of the compounds present in a solid sample, for instance, is minimized, and lower matrix effects also might be expected. In addition, although Rohwetter et al.92 have reported higher crater diameters and higher mass removal rates from ablation using femtosecond pulses, the lower ablation threshold energies in femtosecond laser pulses allow the use of lower pulse energies, decreasing the diameters of the ablation-produced craters and increasing the space resolution in microanalysis for surface mapping.96 Another feature, reported by Baudelet et al.,95 is the production of more molecular species by femtosecond pulses than by nanosecond ones, leading to the observation of more molecular bands in the emission spectra, which is very interesting for applications using biological samples. In spite of these advantages, Le Drogoff et al.,94 in a comparison between 3 pulse durations ranging from femtosecond scale to hundreds of picoseconds, reported the occurrence of a higher self-absorption for some emission lines in copper and aluminum alloy samples when using the femtosecond pulse, similar limits of detection (LOD) for the different pulse durations when using gated detection in optimized conditions, and lower LOD for 2 ps pulse duration when using non-gated detection (no time delay between the laser pulse and start of detection; see section on Detecting Systems for a detailed description of gated detection). Rieger et al.103 reported similar background emission and line intensities for pulse durations of 50 ps and 10 ns at energies significantly above the breakdown threshold in silicon and aluminum samples. In addition, Sirven et al.93
reported similar background and line intensity-related temporal decays for a given fluence using pulse durations of 100 fs and 10 ns, in spite of the higher maximum background intensity when using the nanosecond laser pulse, in aluminum samples.
costs, complexity, power demands and skill requirements still limit a wider use of them in LIBS. An alternative approach for improving some figures of merit of the LIBS technique is the use of double-pulse or multi-pulse excitation. In double-pulse LIBS, a second laser pulse is applied after a delay time from the first laser pulse, called interpulse separation,23 re-exciting the region where the plasma generated by the first pulse was created and, sometimes, also the sample surface. There is some controversy in the literature about the maximum interpulse separation required for the effectiveness of double-pulse excitation. Although it was demonstrated that the long relaxation time of nitrogen oxides produced by the first laser pulse in air could prolong the existence of hot air in the region where the plasma was generated up to the millisecond scale,104 Noll23 proposed an interpulse separation up to 200 µs in order not to re-achieve a physical equilibrium in the region irradiated by the first pulse, whereas Scaffidi et al.105 propose a time up to 100 µs, and Gautier et al.106 suggest a time up to about 50 µs in order
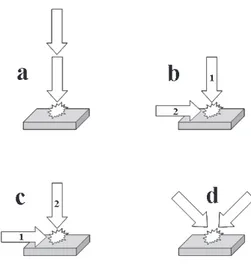
to produce emission enhancements in double-pulse LIBS. Double-pulse excitation can be applied by using two laser sources and some electronic device, such as a delay generator (see section on Detecting Systems for details), to trigger the application of the pulses and control the interpulse separation (used in the most papers), by using just one laser source emitting pulses at high frequency (to achieve the required low interpulse separations),107 or by using just one laser source emitting just one pulse, which is divided by a beam splitter, with the application of one of the resulting two pulses optically delayed in relation to the other pulse.108 Double-pulse LIBS also can be employed in different configurations, represented in Figure 6, concerning the direction of propagation of the laser pulses and their temporal sequence.23,105 The orthogonal configurations differ from each other according to the sequential order of the pulses. In orthogonal re-heating, the first laser pulse is applied on the sample surface, perpendicular to it, and the second pulse, horizontal with respect to the surface, is focused slightly above it, in the region were the first plasma was created. In orthogonal pre-ablation, the first laser pulse is driven horizontally to the sample surface, being focused slightly above it, and the second pulse is applied on the surface, perpendicular to it, right below the region where the first plasma was created. Collinear is the configuration used in the most papers, because it enables an easier alignment of the laser beams, while the crossed beam configuration is the least used, though a recent paper effectively using this configuration can be cited.109 Double-pulse excitation was first reported by Piepmeier and Malmstadt110 in 1969 and
Scott and Strasheim111 in 1970,but only in 1985 was a study demonstrating improvements in LOD using double-pulse LIBS made by Cremers et al.112 All used the collinear
configuration. Since then, several papers dealing with double-pulse LIBS have reported, mainly, higher intensities of emission lines, typically up to 2 orders of magnitude, and lower LOD, down to parts per billion (ppb) or sub-ppb, in comparison with single-pulse LIBS. 107,113-124 The first papers employing orthogonal configurations in re-heating and pre-ablation modes for double-pulse LIBS date from 1991 and 2000, respectively.115,116 Although most papers dealing with multi-pulse excitation employ the double-pulse approach, a recent paper have demonstrated emission measurements after seven excitation pulses, using a microchip laser with 25 µs of interpulse separation, reporting up to 129 fold line emission enhancements in comparison with the single-pulse approach.107 It is important to point out that the analytical advantages of double or multi-pulse excitation cannot be explained just in terms of a higher total delivered energy due to the application of more than one pulse instead of just one, because some papers have also reported these improvements even when the total energy of a double or multi-pulse was the same of that of a single-pulse.117,118 Although the mechanisms leading to the analytical improvements of double-pulse excitation in LIBS are not yet completely understood, there is agreement in the literature about three possible main sources of these emission enhancements: (i) higher ablated mass; (ii)
re-excitation of the material ablated in the first laser pulse by the second laser pulse with consequent higher plasma temperature and electron density in the second plasma;
and (iii) physical and energetic effects associated with
the formation of the first plasma, such as lower atmospheric pressure and atmospheric number density in the region where the first plasma was created and a higher sample temperature with the application of the second pulse, leading to a lower ablation and/or plasma threshold energy, also improving the ablation and increasing the plasma temperature.105,119 Besides, orthogonal re-heating and pre-ablation configurations appeared as attempts to study the second and third emission enhancement sources, respectively, separately, though there are indications that all of them coexist even in these configurations. Some papers also made use of laser pulses with different wavelengths or different pulse durations in double-pulse LIBS.118,120-122 Gautier et al.118 employed two Nd:YAG laser sources, emitting at 532 and 1064 nm, for a comparative study between the two orthogonal configurations for double-pulse LIBS, always using the visible laser pulse for ablation (first pulse in the re-heating mode and second pulse in the pre-ablation mode). They described, for the analysis of several metals in aluminum alloy samples, different optimal interpulse separations according to the configuration used, 200 ns for the re-heating mode and 15 µs for the pre-ablation mode, and observed a higher detectivity when using the re-heating mode. St-Onge et al.120 employed two Nd:YAG laser sources for the study
of Si and Mg lines (four atomic and ionic lines) in aluminum alloy samples by double-pulse LIBS in collinear configuration, varying the wavelength of the first and second pulses (UV + NIR, NIR + UV and NIR + NIR). Although they observed higher emission intensities using any of the double-pulse configurations in comparison with the single-pulse approach, they reported higher emission intensities for almost all lines studied and higher crater diameters when using the UV + NIR sequence, proving a higher ablation efficiency of the UV laser pulse and a higher re-excitation of the material ablated in the first pulse by the NIR pulse. Surprisingly, for one of the emission lines studied, they also applied the UV + NIR pulses simultaneously, without interpulse separation, obtaining emission enhancements similar to those of sequential pulse. Both papers cited here for double-pulse LIBS using different laser wavelengths also reported higher intensity enhancements as higher the energy of emission lines.118,120 Scaffidi et al.121,122 have employed a femtosecond laser pulse followed by a nanosecond pulse for the analysis of Fe and Cu in brass samples by double-pulse LIBS in orthogonal pre-ablation and collinear configurations. In the orthogonal pre-ablation configuration, they reported a decrease in the intensities of nitrogen and oxygen lines related to the presence of air
associated with an increase of the atomic lines related to the ablated brass with an interpulse separation of up to 140 µs. In the collinear configuration, they studied two focusing positions, on the sample surface and slightly above it, reporting emission intensity enhancements correlated to the first plasma lifetime and correlated to nitrogen and oxygen atomic emission reductions, respectively. For underwater analysis, the analytical improvements of double-pulse LIBS are still more evident due to the strong confinement of plasma formation and to the much weaker emission signals in single-pulse mode.123 In the double-pulse mode, the first laser pulse creates a gaseous cavity in the water above the sample surface, which is excited by the second pulse, increasing detectivity to a level comparable to that of single-pulse LIBS in air,124 making the double-pulse LIBS also potentially useful for marine research.
2.2. Optical components and other parts
In addition to the laser source, to excite the samples, and the wavelength selector and detecting system, to analyze radiation emitted from the plasma in order to characterize the sample, a LIBS instrument requires optical components, used mainly to direct the laser radiation onto the sample surface and to collect the radiation emitted by the plasma and direct it into the wavelength selector.
and wavelength selector.84,119,120 In the case of the dichroic mirror, the laser beam is reflected by it and redirected to the focusing lens and sample surface, while the collecting optics is disposed behind the mirror.103,127 The inverse is also possible, with the laser beam passing through the dichroic mirror and emitted radiation being reflected by it and redirected to the collecting lens and wavelength selector.128 The dichroic mirror must be highly reflective at the laser wavelength and highly transparent in the wavelength range of the selector, or vice-versa. The dichroic mirror also can be used to allow the perpendicular acquisition of plasma images by a camera (see section on Detecting Systems for details) and in the application of double-pulse excitation in the collinear configuration by using two laser sources.83,103,107,122,124 In the latter case, one laser beam passes through the dichroic mirror while the other one is reflected by it and redirected to the sample surface. Another kind of beam splitter also can be used to collect a fraction of the laser radiation during the application of the laser pulse, which can be redirected to a photodiode for triggering the detection in relation to the laser pulse (see section on Detecting Systems for details),81 for instance, or to divide the emitted radiation, one part being used for plasma imaging and the other part redirected to the collecting lens and wavelength selector.103 Another kind of optics used in LIBS, for focusing the laser beam and for collecting the radiation emitted by the plasma, are those of telescopes, allowing the samples to be placed several meters away from the instrument, which is very useful for remote analysis.92,129
Several papers have employed optical fibers in LIBS applications, in conjunction with the previously cited optics, either for directing the laser or collecting the radiation emitted by the plasma, or for both. Their use for collection of the emitted light, associated with a collecting lens and coupled to the wavelength selector, is more frequent than for drive the laser radiation. When employed for both operations, either one or two optical fiber cables can be used. In the case of using just one optical fiber cable, a dichroic mirror (or another kind of beam splitter) must be used so that the laser radiation can be focused on the optical fiber, and the emitted radiation, traveling in the opposite direction, can be directed to the wavelength selector.128,130 When using two optical fiber cables, the laser and the radiation emitted by the plasma travel through different fibers.131,132 When the laser pulse is directed by optical fibers, two lenses are used at the output side (directed towards the sample surface) of the optical fiber cable, one collimating and the other focusing the laser radiation.131,132 The collection of the radiation emitted by the plasma can also be made by using two lenses, one
collimating and the other focusing the emitted radiation on the collecting optical fiber cable or directly onto the entrance of the wavelength selector.75,119
In addition to the optics, moveable sample stages (rotating or X-Y stages, sometimes under computer control), for changing the surface region under analysis and for surface mapping applications,83,95,107,119 and sample chambers, for analysis under vacuum or gas insertion, simulating specific atmospheres or atmospheric pressures,133,134,135 have been used.
2.3. Wavelength selectors
Spectrographs based on different set-ups of diffraction gratings, lenses and mirrors, such as the well known Czerny Turner and Paschen Runge designs, have been intensively employed in LIBS for many years and are still used.94,132,136-138 However, due to the high complexity of LIBS spectra, with multiple emission lines (many sometimes at very close wavelengths) from the vacuum ultraviolet to the near infrared (according to the elements present in the sample), an ideal wavelength selector for LIBS should have the capability of covering large wavelength ranges simultaneously and with high resolution, which is not the case with conventional grating spectrographs. These wavelength selectors can either cover a short wavelength range with high resolution, decreasing the capability of multielement detection, or cover a wide wavelength range with lower resolution, sometimes resulting in problems of detection of specific emission lines due to their overlapping with other lines. In order to overcome these limitations and to avoid more expensive instrumentation, Body and Chadwick136 employed up to four grating-based spectrographs, simultaneously covering different spectral regions with high resolution, to analyze the radiation emitted by the plasma. In spite of the limitations, grating spectrographs are still important in designing low cost instruments, such as that described by Neuhauser et al.137 using a Paschen Runge design in a Rowland circle type spectrograph. Another important feature is the capability to be compacted in miniaturized devices coupled to detecting systems composed of a linear array of sensors (discussed later). These kinds of spectrometers, available commercially, have been used in many works.57,138
spectrometer covering a wide range of wavelengths (commonly from 200 up to 1000 nm) with a high resolving power (λ/∆λ up to above 10000). The echelle technology has been developed since about the early 1950s,141,142 and the first applications of echelle spectrographs in LIBS date from the late 1990s.143,144
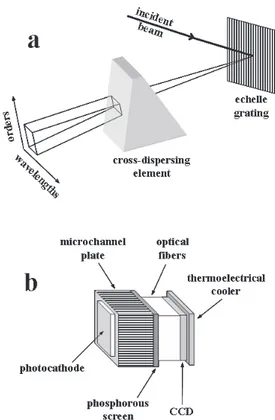
The echelle spectrograph employs a grating containing grooves having a step like profile with one highly reflecting facet for each groove. The angle between the facet perpendicular and the grating perpendicular is called the blaze angle and the largest efficiency for diffraction by an echelle grating is obtained at wavelengths satisfying the condition for reflection from the groove facets. In a simplified way, when an incident beam of radiation is diffracted by an echelle grating, a linear dispersion of high resolution is produced in the focal plane, which is constituted by several continuous wavelength ranges (called spectral orders) superimposed on each other. Therefore, in each direction containing emerging beams from the diffraction grating, there could be radiation of several wavelengths, each from a different spectral order. This means that the spectral images of several wavelengths coincide in the focal plane. In this way, an echelle spectrograph also employs a cross dispersing element (also called the order sorter), either a second grating or a prism placed at 90o in relation to the echelle grating, in order to separate the different orders by shifting them orthogonally to the dispersion of the echelle grating, generating a high resolution bi-dimensional dispersion of wavelengths versus spectral orders (Figure 7a). Therefore, the echelle spectrographs must be used with detecting devices composed of a bi-dimensional array of sensors (discussed later), placed at the focal plane of the bi-dimensional dispersion. The emission signals are acquired, compiled and the rows of the different orders are linked together in a linear spectrum. Lindblom145 provided a good explanation of the basic principles related to echelle spectrographs. Modern echelle spectrographs are capable of generating a dispersion with a high diffraction efficiency in all orders and with a practically constant spectral resolution over the whole wavelength range.
Florek et al.146 described the development of a stand-alone echelle spectrometer. By changing the echelle grating (specific groove density and blaze angle) and the cross-dispersing prism, their echelle spectrograph can generate a bi-dimensional dispersion of any rectangular shape to match bi-dimensional detecting systems of different areas, placed outside the spectrograph housing. Sabsabi et al.147 described a comparison between two commercial echelle spectrometers (ESA 3000 from LLA Instruments and Mechelle 7500 from Multichannel
Instruments) in terms of detectivity and precision for determination of Be, Mg, Si, Mn, Fe and Cu in Al alloy samples, concluding that both presented similar performances.
Unlike the dispersive spectrographs, optical filters are less employed as wavelength selectors in LIBS mainly because of their lower resolution and the selection of virtually only one wavelength at their exit, limiting the number of emission lines that can be simultaneously detected to one line per filter and, therefore, reducing the capability of multielement detection. However, due to the higher throughput of optical filters (there is no slit) in relation to dispersive spectrographs, modern tunable filters, such as acousto-optical tunable filters (AOTF), have been used in LIBS for plasma imaging, at a particular line emission, using bi-dimensional detecting systems. 45,148-150 An AOTF is an optical band pass filter based on a diffraction of the radiation by an acoustic wave, whose frequency determines the selected wavelength, propagating through an isotropic or anisotropic crystal medium (depending on the wavelength range of the AOTF).151 Plasma imaging using AOTF has been used for investigating the spatial and temporal distribution of atomic and ionic lines,45 the effect of the focusing lens, the lens to sample distance, the angle of incidence of the laser pulse onto the sample,45,148 and the effect of
Figure 7. Illustrations of (a) an echelle spectrograph and its generated