Printed in Brazil - ©2007 Sociedade Brasileira de Química 0103 - 5053 $6.00+0.00
A
r
ti
c
le
*e-mail: [email protected]
Determination of Losartan Associated with Chlorthalidone or Hydrochlorothiazide
in Capsules by Capillary Zone Electrophoresis
Manoela R. Balesteros, Adriana F. Faria and Marcone A. L. de Oliveira*
Departamento de Química, Universidade Federal de Juiz de Fora - UFJF, 36036-330 Juiz de Fora-MG, Brasil
Uma metodologia alternativa por eletroforese capilar de zona (ECZ) é proposta para a análise de losartan potássio (LOS) associado com clortalidona (CTD) ou hidroclorotiazida (HCT) em cápsulas, usando 50 mmol L-1 de tampão carbonato de sódio com detecção em 226 nm. O
sistema de eletrólito foi otimizado, levando em consideração o perfil do pico, resolução, tempo de análise, estabilidade da linha base e repetibilidade (ausência de adsorção). O método foi aplicado com sucesso na análise de formulações farmacêuticas adquiridas em farmácias de manipulação. Os analitos apresentaram boa separação na linha base em menos de 5 min. Os resultados obtidos não apresentaram diferença signicativa no intervalo de 95% de confiança em relação ao valor de referência. O método pode ser aplicado para a análise destes compostos ou empregado em outros formulações framacêuticas similares contendo estas drogas.
An alternative methodology by capillary zone electrophoresis (CZE) is proposed for the determination of losartan potassium (LOS) associated with chlorthalidone (CTD) or hydrochlorothiazide (HCT) in capsules, using 50 mmol L-1 of sodium carbonate buffer with
detection at 226 nm. The electrolyte system was optimized, taking into account peak profiles, resolution, run times, baseline stability and repeatability (adsorption absence). The method was successfully applied to the analysis of pharmaceutical formulations purchased in manipulation drugstores. The analytes were baseline separated in less than 5 min. The results did not present significant difference in the 95% confidence interval in relation to the label claim values. The method can be applied to analyze these compounds and could also be employed in other similar formulated products containing these drugs.
Keywords: losartan, antihypertensive, diuretics, pharmaceutical analysis, capillary electrophoresis
Introduction
Hypertension is a disease that affects millions of people all over the world, causing devastating action over time. High blood pressure causes serious consequences such as cardiovascular accidents and kidney diseases. The treatment to avoid hypertension targets a healthy lifestyle, even though 60% of the people with hypertension need medicine help.1
Physicians and scientists try to make a more effective treatment through the association of antihypertensive with diuretic drugs. The first one is a pressure regulator, while the second keeps liquid retention under control. By associating these two pharmaceuticals with different action mechanisms, it is possible to use low doses and to minimize their side effects.1
Losartan is a powerful and selective antihypertensive administered orally, blocking the interaction between angiotensin II and the receptors with the advantage of not affecting bradicinina. It also acts as an independent antagonist of the local angiotensin II formation.2
The thiazidic diuretics, such as hydrochlorothiazide (HCT), increase the rate of urinary excretion of sodium and water by sodium reabsorption inhibition in the renal tubules. Although chlorthalidone (CTD) does not have a thiazidic structure, it presents the same effects of the thiazidic diuretics.2 The LOS/HCT association is
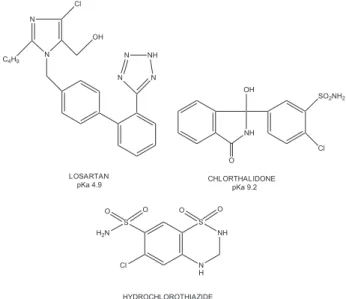
commercially available from pharmaceutical industry or can be manipulated, while LOS/CTD association is available in manipulation drugstores. Figure 1 shows the chemical structure for LOS, CTD and HCT.
importance of antihypertensive and diuretics asso-ciations in the hypertension treatment. Among the analytical methodologies used, the following can be stressed: super-critical fluid chromatography,3 high
performance liquid chromatography (HPLC),4 and
UV-Visible spectrophotometry.5 The analysis of
anti-hypertensive and diuretic drugs by capillary electro-phoresis (CE) presents different ways of separation, such as, capillary zone electrophoresis (CZE)6 and
micellar electrokinetic capillary chromatography (MEKC).7
In the CE methodologies published for simultaneous analysis of LOS/HCT association, analysis time is higher than 5 min, or use additives such as cyclodextrins or sodium dodecylsulphate (SDS) in the running buffer,8,9 or were carried out through the capillary
electrochromatography (CEC).8 Despite the existing
literature for simultaneous analysis of CTD and HCT,10
there are not studies for LOS/CTD association yet. Therefore, this paper presents an alternative separation performance for analysis of LOS associated with CTD or HCT by CZE using diode array detection (spectral confirmation) with baseline separation in less than 5 min, through a simple aqueous electrolyte system constituted of 50 mmol L-1 carbonate buffer (pH 10.3).
The development and optimization of the methodology was based on the study from a graph of effective mobility curve (µeff) versus pH. The proposed method was successfully applied to the analysis of phar-maceuticals purchase at the local manipulation drugstores.
Experimental
Instrumentation and electrophoretic procedures
The experiments were carried out in a capillary electrophoresis system (model HP3d CE, Agilent Technologies, Palo Alto, USA) equipped with a diode array detector set at 226 nm, a temperature control device (maintained at 25 °C) and acquisition and treatment data software (HP ChemStation, rev A.06.01). Samples were hydrodynamically injected (12.5 mbar, 5 s) and the electrophoretic system was operated under normal polarity and constant voltage conditions of +20 kV. Fused-silica capillaries coated with polyacrylate (Microtube, Araraquara, São Paulo, Brazil) 48.5 cm (40 cm effective length) × 75 µm I.D. × 375 µm O.D. were used.
The absorption measurements were carried out in a Visible spectrophotometer system (model UV-1601PC, Shimadzu, Kyoto, Japan) equipped with double-beam in time. All electronic spectra were obtained by dissolving standards in methanol with the reading being performed in quartz regular cells of optical way equal to 1.00 cm.
Analytical procedures
When a new capillary was used, it was washed by pressure flush of 1.0 mol L-1 NaOH solutions (30 min),
deionized water (5 min) and electrolyte solution (10 min). Between runs the capillary was washed with electrolyte solution (3 min, pressure flush).
Reagents and chemicals
Losartan was purchased from APEX-DRUGS (India), Hydrochlorothiazide from WHYTE International Limited (China) and Chlorthalidone from Galena (Brazil).
All reagents were of analytical grade; sodium carbonate, sodium bicarbonate, phosphoric acid and sodium hydroxide were purchased from Vetec (Rio de Janeiro, Brazil); glycine was purchased from Plusone (Munich-Germany). Methanol was obtained from Quimex (Rio de Janeiro, Brazil).
All buffers were prepared with deionized water proceeding from Millipore System (Milli-Q system, Millipore, Bedford, MA, U.S.A.).
Standard solutions
Stock solutions containing 230 mg of LOS, 160 mg of CTD and 160 mg of HCT were separately dissolved in Figure 1. Chemical structure of LOS, HCT and CTD.
N N
Cl OH
N N
N NH
C4H9
LOSARTAN pKa 4.9
N H
NH S
O O S
O O
H2N
Cl
HYDROCHLOROTHIAZIDE pKa 7.0 and 9.2
NH O
OH
SO2NH2
Cl CHLORTHALIDONE
10.0 mL of methanol and stored in the freezer. The standard mixture containing 5.0 mmol L-1 of LOS, 5.0
mmol L-1 of CTD and 5.0 mmol L-1 of HCT was dissolved
in methanol and used for optimization of the separation performance.
Internal standard solutions
CTD 1.0 mmol L-1 was used as internal standard (IS)
for LOS/HCT association while HCT 1.0 mmol L-1 was
used for LOS/CTD association.
Electrolyte system preparation
The salts were weighed, mixtured and diluted in volumetric flasks: 100 mmol L-1 of glycine and 50 mmol
L-1 of sodium hydroxide resulted in a glycine buffer 50
mmol L-1 (pH 9.7); 25 mmol L-1 sodium carbonate and 25
mmol L-1 of sodium bicarbonate resulted in a sodium
carbonate buffer 50 mmol L-1 (pH 10.3) and 250 mmol
L-1 sodium hydroxide and 100 mmol L-1 of phosphoric
acid resulted in a sodium phosphate buffer 100 mmol L-1
(pH 12).
Analyses of capsules
Five capsules of the association 1 (50 mg LOS/ 12.5 mg HCT) and association 2 (50 mg LOS/ 12.5 mg CTD) were separately weighed and dissolved in 25 mL of methanol in a volumetric flask. After sonication for 10 min, the suspensions were filtered through a 0.45 µm
Millipore filter (São Paulo, Brazil) to obtain clear solutions. The sample solutions were diluted to ca. 400 mg L-1 to LOS and 100 mg L-1 to HCT and CTD before
injection.
Results and Discussion
pH selection
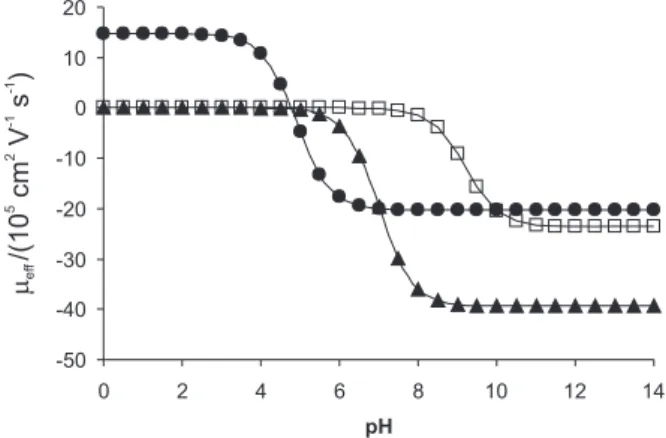
Due to CTD, HCT and LOS chemical features, their migration time is highly influenced by pH, which is a determinant for their presenting positive, neutral or negative charge. It is possible to choose between an alkaline or acid buffer, which has the key role of influencing the separation by affecting the charge of the compounds, as well as the electroosmotic flow (EOF). As it can be observed in Figure 2, simultaneous separations of the three drugs by CZE between pH intervals 2.5 to 8.5 presents poor selectivity because CTD remains uncharged and migrates together with a neutral
marker. A possible alternative would be the use of MEKC mode, such as the electrolyte system consisting of 55 mmol L-1 sodium phosphate buffer (pH 6.5) with 15
mmol L-1 SDS, reported by Hilaert et al.7 to the
simultaneous determination of HCT together with some angiontensin-II-receptor antagonist. Theoretically, the separation could be suggested between intervals pH 8.5 to 9.5. However, the literature reports that by using borate buffer (pH 9.0) the HCT adsorbs inside the internal wall of the capillary. In order to make the analysis possible, addition of sodium dodecyl sulfate (SDS) or cyclodextrin in the running buffer is necessary.6 Therefore, with the
aim of studying the simultaneous separation performance of CTD, HCT and LOS by CZE mode through the use of simple electrolyte system, glycine buffer (pH 9.7), carbonate buffer (pH 10.3) and phosphate buffer (pH 12.0) were investigated.
Wavelength selection
The choice of the best wavelength was based on the electronic spectrum of each drug (Figure 3), dissolved in methanol in the concentration of 7.5 × 10⁻⁶ mol L-1. The
selection of the wavelength at 226 nm, simultaneously took into account the following features: wavelength of the highest molar absorptivity, absence of excipient signal and baseline stability present in the electropherograms.
Electrolyte system selection
The molarity impact of the glycine, carbonate and phosphate buffers in the separation performance of the analytes was investigated through the increase of 10 units in the concentration for each electrolyte between 10 to 50 mmol L-1, maintaining other operational conditions
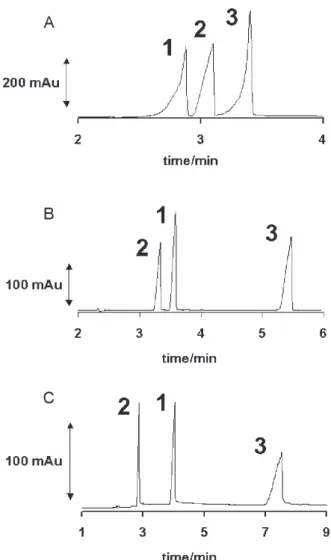
presented the most satisfactory results within the interval studied were: 50, 50 and 30 mmol L-1, for glycine,
carbonate and phosphate, respectively. Figure 4 shows the separation obtained for standard mixture containing 5 mmol L-1 of CTD, HCT and LOS in the electrolyte
conditions selected, with spectral confirmation. Experiment A presented total analysis time shorter than 4 minutes and high sensitivity, although separated bands were distorted, enlarged and presented tail. Resolution was higher in C than in A and B, although sensitivity was lower and analysis time was higher. The experiment B showed higher impact for the general profile of separation in comparison with the experiments A and C, because it presented reasonable sensitivity, good resolution, symmetric peaks and analysis time of about 5 minutes. Therefore, carbonate buffer (pH 10.30) was selected as the best condition to be used for the determination of the analytes in the sample. Still in Figure 4, it is interesting to stress the occurrence of inversion of the peak migration order between LOS and CTD when comparing the electropherogram in experiments A and B. This fact shows the high dependence of the effective mobility of each analyte for narrow pH interval, once the separation was carried out on counter electroosmotic flow.
Quantitative determination in pharmaceutical formulation
In order to significantly reduce the injection-related imprecision11,12 and to ensure better reproducibility and
greater control over the sample amount injected, the use of an internal standard in the quantitative analysis is generally preferred. In this case, CTD was chosen for association 1 and HCT for association 2 as internal standard because they were well separated in each drug association. Figure 5 shows the analyses of samples for
association 1 and 2 using carbonate buffer according to the condition selected.
The signal-noise ratio through the baseline standard deviation (noise) and peak height (signal) was used to calculate LOD and LOQ.13 The concentration
corres-ponding to signal-noise ratio equal to 3 and 10 were used, respectively for LOD and LOQ.
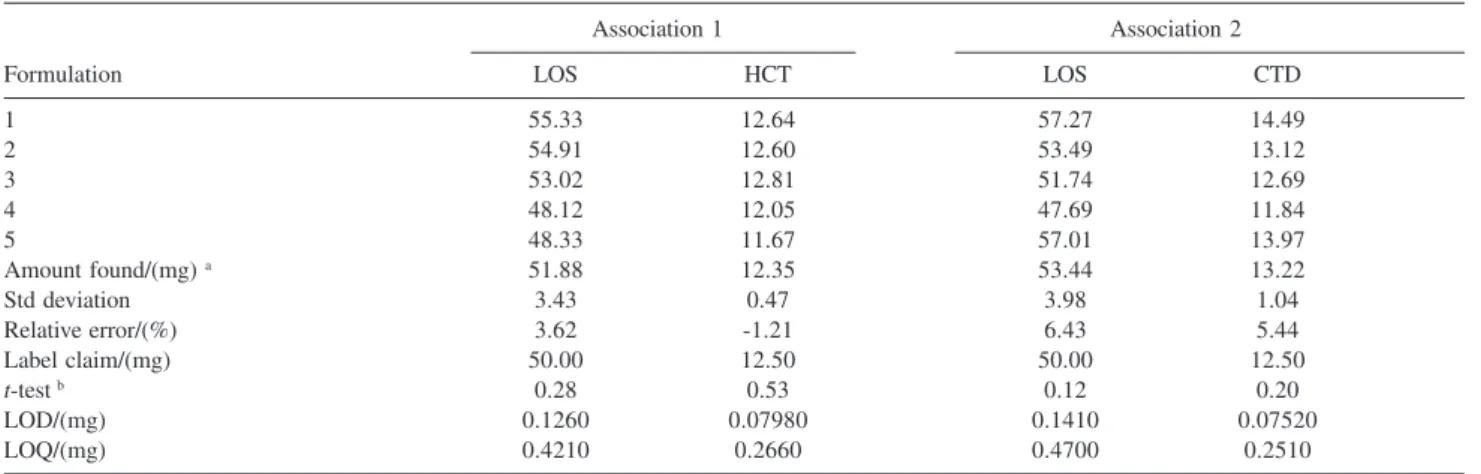
Table 1 presents the results for calculating the limit of detection (LOD), limit of quantification (LOQ) and analyses of five repetitions of the association 1 and 2. The results show that differences were probably not meaningful between the label claim and the amount found in the 95% confidence interval (t test). Therefore, the medicines analyzed are within acceptable variation limit (± 10.0%), in accordance with United States Pharmacopoeia (USP).14
Figure 3. Electronic spectra of LOS, HCT and CTD.
Figure 4. Separation performance for standard mixture containing 5 mmol L–1 of: 1- CTD, 2- LOS and 3- HCT. A) 50 mmo L-1 glycine buffer (pH 9.7);
Conclusions
The optimized method allows the separation of LOS, CTD and HCT in less than 5 min, with spectral confirmation, good baseline separation, simple step of sample preparation by using of simple and cheap aqueous electrolyte system. The method can be applied to analyze these compounds and could also be employed in other similar formulated products containing these drugs.
Acknowledgments
The authors wish to acknowledge Philadelphia drugstore manipulation, Microtube, Coordenação de Aperfeiçoamento de Pessoal de Nível Superior (CAPES), Universidade Federal
Table 1. Statistics analysis for quantitative determination in pharmaceutical formulation
Association 1 Association 2
Formulation LOS HCT LOS CTD
1 55.33 12.64 57.27 14.49
2 54.91 12.60 53.49 13.12
3 53.02 12.81 51.74 12.69
4 48.12 12.05 47.69 11.84
5 48.33 11.67 57.01 13.97
Amount found/(mg) a 51.88 12.35 53.44 13.22
Std deviation 3.43 0.47 3.98 1.04
Relative error/(%) 3.62 -1.21 6.43 5.44
Label claim/(mg) 50.00 12.50 50.00 12.50
t-test b 0.28 0.53 0.12 0.20
LOD/(mg) 0.1260 0.07980 0.1410 0.07520
LOQ/(mg) 0.4210 0.2660 0.4700 0.2510
a Mean of five independent repetitions; b 95% confidence interval
de Juiz de Fora (UFJF) and Fundação de Amparo à Pesquisa do Estado de Minas Gerais (FAPEMIG) from Brazil for fellowships and financial support.
References
1. Sweetman, S. C.; Martindale; The Complete Drug Reference, 33rd edition, Pharmaceutical Press: London, p. 921-922. 2. Korolkovas, A.; Dicionário Terapêutico Guanabara,
2000-2001 Ed., Guanabara Koogan: Rio de Janeiro, 2000. 3. Willians, R. C.; Alasandro, M. S.; Fasones, V. L.; Boucher,
R. J.; Edwards, J. F.; J. Pharm. Biomed. Anal.1996, 14, 1539.
4. Hertzog, D. L.; McCafferty, J. F.; Fang, X.; Tyrrell, R. J.; Reed, R. A.; J. Pharm. Biomed. Anal.2002, 30, 747.
5. Lastra, O. C.; Lemus, I. G.; Sanches, H. J.; Pérez, R. F.; J.
Pharm. Biomed. Anal.2003, 33, 175.
6. Hillaert, S.; Van den Bossche, W.; J. Chromatogr. A.2002, 979, 323.
7. Hillaert, S.; Van den Bossche, W.; J. Pharm. Biomed. Anal.
2003, 31, 329.
8. Quaglia, M. G.; Donati, E.; Carlucci, G.; Mazzeo, P.; Fanali, S.; J. Pharm. Biomed. Anal.2002, 29, 981.
9. Hillaert, S.; T. De Beer, R. M.; De Beer, J. O.; Van den Bossche, W.; J. Chromatogr. A.2003, 984, 135.
10. Luis, M. L.; Corujedo S.; D. Blanco; Fraga, J. M. G.; Jiménez, A. I.; Arias, J. J.; Talanta2002, 57, 223.
11. Altria, K. D.; Fabre, H.; Chromatographia1995, 40, 313. 12. Dose, E. V.; Guiochon, G. A.; Anal. Chem.1991, 63, 1154. 13. International Conference on Harmonisation (ICH), Validation
of Analytical Procedures: Methodology, Q2B (CPMP/ICH/281/
95), 1995.
14. United States Pharmacopoeia 28, NF 23, 2005.
Received: August 5, 2006
Web Release Date: April 27, 2007