0103 - 5053 $6.00+0.00
A
r
ti
c
le
*e-mail: [email protected]
Characterization by NMR of Ozonized Methyl Linoleate
Maritza F. Díaz*,a and José A. Gavínb
a
Department of Ozonized Substances, Ozone Research Center, National Center for Scientific Research, P.O. Box 6412, Havana, Cuba
b
University of the Laguna 38207, Tenerife, Spain
No presente estudo o linoleato de metila ozonizado com índice de peróxidos de 1.800 mmol-equiv. kg-1 foi caracterizado quimicamente. Os efeitos do ozônio sobre o linoleato de
metila produz hidroperóxidos, ozonideos e aldeídos, os quais foram identificados por técnicas de ressonância magnética nuclear de 1H e 13C, mono- e bidimensional. O linoleato de metila
padrão e o linoleato de metila ozonizado mostram espectros muito similares, excetuando os valores de ressonância (δ 9,7 e δ 9,6) que correspondem aos hidrogênios aldeídicos (δ 5,7 e
δ 5,5) e olefínicos de hidroperóxidos (δ 5,2). Outras atribuições estão baseadas nas conectividades fornecidas pelas constantes de acoplamento. Estes resultados indicam que a espectrometria de RMN pode oferecer informação valiosa a respeito da quantidade de compostos oxigenados formados à partir do linoleato de metila ozonizado para o uso em ozonoterapia e na química de óleos vegetais ozonizados.
In the present study ozonized methyl linoleate with peroxide index of 1,800 mmol-equiv kg-1
was chemically characterized. Ozonation of methyl linoleate produced hydroperoxides, ozonides and aldehydes which were identified by 1H and 13C NMR two-dimensional. The standard methyl
linoleate and ozonized methyl linoleate shown very similar 1H NMR spectra except for the signals at
δ 9.7 and δ 9.6 that correspond to aldehydic hydrogen, δ 5.7 and δ 5.5 (olefinic signals from hydroperoxides) and δ 5.2 ppm (multiplet from ozonides methynic hydrogen). Other resonance assignments are based on the connectivities provided by the hydrogen scalar coupling constants. These results indicate that NMR spectroscopy can provide valuable information about the amount of formed oxygenated compounds in the ozonized methyl linoleate in order to use it to follow up ozone therapy and chemistry of ozonized vegetable oil.
Keywords: methyl linoleate, ozone, ozonides, aldehydes, NMR
Introduction
Linoleic acid is one of the most important components of vegetable oils and lipids.1 The determination of
molecular structure of ozonized fatty acids is one of aim of scientists which work with ozonized vegetable oils and ozone therapy.2
Many studies have been carried out to develop new analytical techniques that, with very little or any manipulation of the sample, can afford the identification of the vegetable oil and lipids.3,4 Specifically, one
spectroscopic technique with a high potential in this field is High-Resolution Nuclear Magnetic Resonance Spectroscopy. Both 1H and 13C NMR have already been
employed in the analysis of vegetable oil and biological samples such as lipids.5,6 However, data on the spectra of
ozonized fatty acids is scarce in the literature.
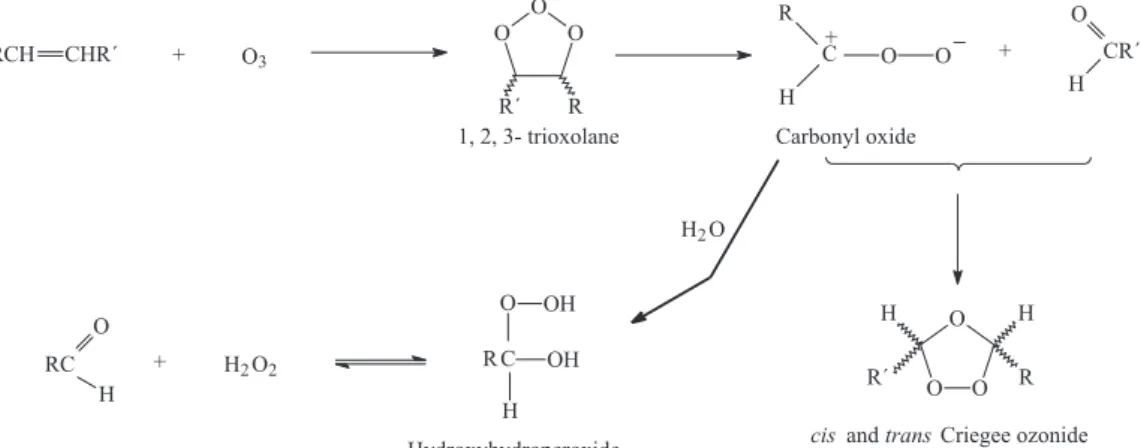
The reaction of ozone with vegetable oil and lipids occurs almost exclusively with the carbon-carbon double bonds present in unsaturated fatty acids. Different kinds of oxygenated products are formed (hydroperoxides, ozonides and aldehydes) that probably are responsible for the biological activity of ozonized fatty acids.7-9 The
mechanism of this reaction is well known (Criegee mechanism, Figure 1), as well as the conditions necessary to enhance the preferential formation of any of these oxygenated compounds.10,11
characterized. In this study the products of ozonized methyl linoleate were analyzed applying 1H, 13C and 2D
COSY NMR spectroscopy.
Experimental
General ozonization procedure
A mixture of 1.6 mL (0.0048 mol L-1) of methyl
linoleate (99%) and 0.16 mL of water were introduced into a bubbling reactor where ozone reaction took place at room temperature.7,8 The reaction was continued during
7.25 minutes and one sample was taken at applied ozone doses 245 mg g-1. The samples were stored at –80 °C until
NMR analysis. Methyl linoleate were purchased from Sigma Chemical Co. (St. Louis, MO).
Ozone generation
Ozone was generated by passing oxygen through a 12-02 model ozone generator of Trailigaz Company (France) at a fixed voltage (170 V) and constant flow rate of 42 L h-1. The initial ozone concentration (69 mg L-1) was
determined by an Ozomat model equipment of Anseros Company (Germany).
Measurement of NMR spectra
1H, 13C, DEPT 135 and 2D COSY NMR spectra were
obtained in a BRUKER 9.4 Tesla AVANCE Spectrometer with CDCl3 as solvent and tetramethylsilane (TMS) as internal reference. The 1H NMR spectra were obtained at
5 kHz spectral width, 60 degree pulse width (5 µs), 8 scans, and 64 kbytes of memory were used to obtain the spectra. 13C NMR spectra were recorded operating
at 100 MHz and were obtained using the following
acquisition parameter: 64 k of acquisition point; spectral width 220 ppm; relaxation delay, 2 s; a total of 800 scans was collected for sample with a 45° excitation pulse. The experiment (distortionless enhancement by polarization transfer, DEPT) were obtained using variable pulse θ = 135°. The 2D 1H-1H correlation spectroscopy (COSY)
and Heteronuclear Simple Quantum Correlation (HSQC) spectra were obtained with a digital resolution of 5.425 Hz after zero filling. Zero filling (one) were done in the F1 dimension of a 512×512 matrix, the data were 2D transformed and the magnitude spectra multiplied by a sine window in each dimension and symmetrized along the diagonal.12
Peroxide index determination
The peroxide index represents the number of mmol-equivalents of active oxygen that expresses the amount of peroxide contained in 1.000 g of the methyl linoleate. Briefly, a sample of 5 g was mixed with 30 volumes of glacial acetic, 20 volumes of chloroform and 0.5 mL of saturated potassium iodide solution. The mixture was shacked for exactly 1 minute, mixed with 30 mL of water and slowly titrated; shaking continuously, with 0.01 mol L-1 sodium thiosulphate until the yellow color almost
disappears. The peroxide index values were obtained from the expression 10 v/m where v is the volume of sodium thiosulphate in mL consumed in the titration, and m is the weight in g, of substance taken.13 The peroxide index
(PI) was expressed in mmol-equiv. kg-1.
Results and Discussion
The aim of this study wasto characterize oxygenated products in ozonized methyl linoleate. Since vegetable oils and lipid consist almost entirely of triglycerides
molecules, no appreciable difference was anticipated between the chemical shift values of these vegetable oils and their component esterified fatty acids.14 In our
experiment for preparation of ozonized methyl linoleate, about 245 mg g-1 of ozone was absorbed per 1.6 mL of
methyl linoleate which seemed to be enough to obtain ozonized methyl linoleate with 1,800 mmol-equiv. kg-1
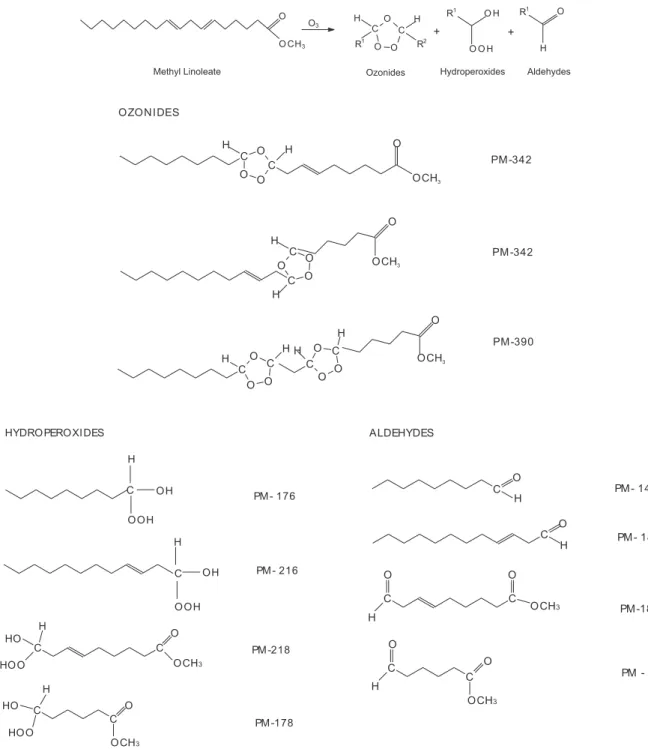
of peroxide index. Scheme 1 shows possible ozonides, hydroperoxides and aldehydes can be obtained in ozonized methyl linoleate.
Figure 2 shows 1H NMR spectrum from methyl
linoleate, presenting a single peak at δ 7.3 which belongs to the chloroform-d, multiplet peaks at δ 5.3 which belong to olefinic signals from the fatty acid, δ 3,6 (single peak from methylic hydrogen of ester), δ 2.7 (triplet from methylenic group between olefinic hydrogen); δ 2.3 (triplet from methylenic groups in α position with respect to carbonylic group); δ 2.0 (multiplet from methylenic group in both sides of olefinic hydrogen); δ 1.6 (multiplet from methylenic group in β position with respect to carbonylic
group); δ 1.3 (signal from methylenic groups in fatty acid chain); and δ 0.9 (triplet from terminal methyl group).
1H NMR spectrum from ozonized methyl linoleate is
displayed in Figure 3. This spectrum has the same observed signals in methyl linoleate (Figure 2) and additionally other eight signals at δ 9.7 and δ 9.6 from aldehydic hydrogen,
δ 5.7 and δ 5.5 (olefinic hydrogen signal from hydro-peroxides), δ 5.2 (multiplet from ozonides), δ 3.2 (doublets from methylenic hydrogen alilic of olefinic hydrogen),
δ 2.4 and δ 1.62 (multiplet from formed ozonides hydrogen). These formed additionally signals are oxygen compounds which seem to be responsible for the germicide effect of ozonized vegetable oil and metabolites generated by application of systemic ozone therapy.15-17
The 13C NMR spectrum of methyl linoleate contains
resonance similar of carbons from the triglyceride fraction of vegetable oil, i.e., the fatty acid signals.18,19 However a
new group of signals were found in the spectrum from ozonized methyl linoleate (Figure 4). The 13C NMR
espectrum are grouped in four sets of signals, aldehyde carbons resonating from δ 199.0 to δ 203.0, carbonyl carbon resonance from δ 174.4, unsaturated carbons in the range from δ 127.0 to δ 136.0 ppm, methynic carbons corresponding to ozonides at δ 100.0 to δ 104.0, and aliphatic carbons from δ 14.0 to δ 44.0.
Figure 2. 1H NMR spectrum of methyl linoleate in CDCl
3 in 9.4 Tesla
equipment.
Figure 3. 1H NMR spectrum of ozonized methyl linoleate in CDCl
3 in
9.4 Tesla equipment.
Spectral region δ 14.0-44.0
Figure 4 and 5 shows 13C and DEPT NMR spectra
from ozonized methyl linoleate. The aliphatic carbons of methyl and methylenic groups resonate in the range of
δ 14.0-44.0. The different signals are resolved on the basis of chain double bond numbers: linoleic chains (C18:2 9,12c) resonate from high to low frequency. The chemical shift can be predicted by the additive relationship for the normal alkanes based upon the number of α, β and γ carbon atoms in the molecule.20 The terminal methyl
carbon shift C-18 is found at δ 14 ppm. Four methylene groups are readily identified: C-17 at δ 22.5 methylenic acylic chains; C-3 at δ 24.9, δ 24.3 and δ 24.2 methylenic group in β position with respect to carbonylic group; C-11 at δ 25.6 methylenic group between olefinic hydrogen of linoleic chains; C-11, C-14, and C-8, at
δ 27.1, δ 27.5 allylic carbons of linoleic chains; δ 29.0-29.5 methylenic groups in fatty acid central chain; C-16 at
δ 31.5 methylenic acylic chains ω; C-2 at δ 34.0 linoleic as a single signal but well resolved from saturated chains. New signals were observed at δ 24.9, δ 24.3, and δ 24.2 belong
Figure 4. 13C NMR spectrum of ozonized methyl linoleate in CDCl
3 in a
9.4 Tesla equipment.
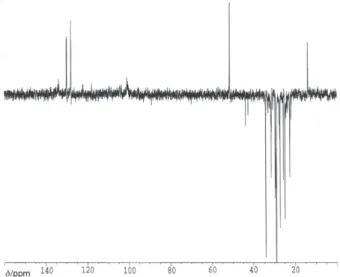
Fgure 5. DEPT135 NMR spectrum of ozonized methyl linoleate in CDCl3
to methylenic carbons of ozonides and methylenic carbons of ozonides and hydroperoxides at δ 42.5 and δ 43.8.
Spectral region δ 127.0-136.0
The resonance of unsaturated carbons of long chain of ozonized methyl linoleate spread over the chemical shift range from δ 127.0-136.0. The carbons C-9 at
δ 127.9, C-10 at δ 130.0, C-12 at δ 128.0 and C-13 δ
130.1 corresponding to linoleic unsaturated carbons. The additional signals at δ 133.6, δ 135.3 and δ 135.5 methynic carbons corresponding to ozonides and hydroperoxides.
Spectral region signals δ 102.0-105.0
In this spectral region signals corresponding to methynic carbons of ozonides appear at δ 103.5 and δ 104.3.
Spectral region δ 174.0-203.0
In this spectral zone the carbonyl carbons at δ 174.4 belong to ester function can observed and also the aldehydes carbons resonating at δ 199.8, δ 202.9 and δ 203.1.
The DEPT experiment was applied to obtain 13C NMR
spectra over the whole carbon-13 frequency range with the purpose of producing 13C NMR resonance for better
structural elucidation. The only drawback was the loss of carbonyl carbons resonance, which is not detected by the DEPT sequence (Freeman21).
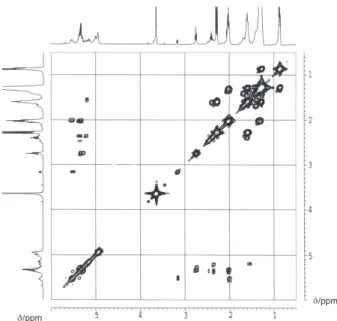
The assignments of the various signals were accomplished by using a combination of 2D COSY techniques 1H-1H and HSQC (Figure 6 and 7). To explain
the detailed interpretation of the 1H-1H NMR COSY
spectra, the 1H NMR spectrum showed six new signals:
δ 5.7, δ 5.5, δ 5.2, δ 3.2, δ 2.4 and δ 1.6. From the 1H-1H
NMR COSY correlation spectrum (Figure 6), it was clear that the multiplet at δ 5.5 (olefinic hydrogen signal could belong to hydroperoxides) was correlated to the hydrogen at δ 3.2 (doublets from methylenic hydrogen alilic of olefinic hydrogen); and δ 5.2 (multiplet from ozonides) was correlated to the δ 2.4 and δ 1.6 (multiplet from formed ozonides hydrogen).
The 13C spectrum showed various new signals: δ
135.5-133.6; δ 122.0-118.0; δ 104.4-100.9; δ 43.8; δ 42.5; δ 23.5-23.9. From the HSQC correlation spectrum (Figure 7), we observed that the multiplet at δH 5.7 was correlated to the carbon atoms δC 135.5-135.3 and the multiplet
δH 5.5 was correlated to the carbon atom δC 133.6 spectral region of unsaturated carbons. The multiplet
δH 5.2 was correlated to the carbon atoms δC 104.4,
δC 103.5 and δC 100.9, they belong to methynic carbons
from ozonides and oligomers. These assignations are similar to those reported by Miura working with ozonated olive oil.22 Signal of methylenic carbon at δ
C 43.8 was correlated
to the δH 2.4 of ozonides. Other signal of methylenic carbon at δC 42.5 was correlated to the δH 3.2 (doublets from methylenic hydrogen alilic of olefinic hydrogen).
For a better explaination, Table 1 shows the main chemical shift and structures of the oxygenated compound of ozonized methyl linoleate. In the structural elucidation of the ozonized methyl linoleate, the assignments of various signals (ozonation products) were accomplished by using a combination of 2D COSY
Figure 6. 1H-1H NMR correlation spectroscopy 2D NMR spectrum of
ozonized methyl linoleate in 9.4 Tesla equipment.
Figure 7. HSQC correlation spectrum of ozonized methyl linoleate in
techniques 1H-1H and HSQC with 1H and 13C NMR
spectra. In this study all functional groups of the ozonation products were well characterized as ozonides, hydroperoxides and aldehydes present in ozonized methyl linoleate. These reaction products were identified according to Criegee mechanism.10 The ozonides of
methyl oleate have been considered compounds with biological activity, which has been demonstrated by Díaz
et al.15 The elucidation and chemical characterization of
reaction products from ozonized methyl linoleate are important for ozone therapy follow up and new ozonation strategies with vegetable oils.
Acknowledgments
We wish to thank CYTED and INTERCAMPUS for providing financial support. Appreciation is expressed to Dr. Angel Gutiérrez Ravelo, University of the Laguna, Tenerife, for his collaboration in this work.
References
1. Vajda, O.I.; Saenz, T.W.; Química de los Alimentos, Editorial Científico Técnico: La Habana, 1976, ch. 1.
2. Pryor, W.A.; Squadrito, G.L.; Friedman, M.; Free Radic. Biol. Med.1995, 19, 935.
3. Zamora, R.; Alba, V.; Hidalgo, J.F.; J. Am. Oil Chem. Soc.2001, 78, 89.
4. Gunstone, F.D. In High Resolution 13C NMR Spectroscopy of
Lipids, Advances in Lipid Methodology-Two; Christie, W.W. ed., The Oily Press: Dundee, Scotland, 1993.
5. Jie, L.K.; Mustafa, M.S.F.; Lipids1997, 78, 15. 6. Vlahov, G.; Fett/Lipid1996, 98, 203.
7. Díaz, M.; Álvarez, I.; Vélez, H.; Hernández, F.; Ledea, O.; Molerio, J.; Bol. Soc. Chil. Quim. 1997, 42, 349.
8. Díaz, M.; Hernández, F.; Álvarez, I.; Vélez, H.; Ledea, O.; Molerio, J.; Rev. CENIC C. Quim. 1998, 29, 89.
9. Pryor, W.A.; Das, B.; Church, D.F.; Chem. Res. Toxicol.1991,
4, 341.
10. Criegee, R.; Mechanism of Ozonolisis, 14th ed., Angewandte
Chemie Int.: England, 1975.
11. Bailey, P.; Ozonolysis of Olefins: Introduction, Initial Ozone Attack and Adduct; The Peroxides Products.Ozonization in
Organic Chemistry, Academic Press: New York, USA, 1978, ch 2.
12. Croasmun, W.R.; Carlson, M.K.; Two-Dimensional NMR Spectroscopy. Applications for Chemists and Biochemists, VCH Publishers, Inc: New York, USA, 1987.
13. British Pharmacopoeia, Appendix XF, IA, IB. Peroxide value 2000.
14. Woodbury, S.E.; Evershed, R.P.; Rossell, J.B.; J. Chromatogr. A1998, 805, 249.
15. Díaz, M.; Lezcano, I.; Molerio, J.; Hernández, F.; Ozone Sci. Eng.2001, 23, 35.
16. Sechi, L.A.; Lezcano, I.; Nuñez, N.; Espim, M.; Dupre, I.; Pinna, A.; J. Appl. Microbiol.2001, 90, 279.
17. Bocci, V.; Oxygen-Ozone Therapy. A Critical Evaluation, Kluwer Academia Publishers: Dordrecht, The Netherlands, 2002. 18. Vlahov, G.; Prog. Nucl. Magn. Reson. Spectrosc. 1999, 35,
341.
19. Díaz, M.; Gavin, J.A.; Ledea, O.; Hernández, F.; Alaiz, M.; Garcés, R.; Ozone Sci. Eng. 2005, 27, 247.
20. Giovanna, V.; Recent Res. Devel. Oil Chem.1998, 2, 189. 21. Freeman, R.; A Handbook of Nuclear Magnetic Resonance,
Longman Group UK Limited: London, 1988.
22. Miura, T.; Suzuki, S.; Sakurai, S.; Matsumoto, A.; Shinriki, N.; Proceedings of the 15th Ozone World Congress Medical
Therapy Conference, London, 2001.
Received: February 15, 2006
Web Release Date: April 17, 2007
Table 1. Ozonized methyl linoleate functional group chemical shift (ppm)
functional group δ1H δ13C
–CH3 0.9 14
–(CH2)n 1.30 29-29.5
–CH2–CH2–CO– 1.6 24.9
–CH2–CH= 2.0 27.1-27.5
–CH2-CO– 2.3 22.5
R1 C H OH O OH 2.4 43.8
–CH=CH–CH2– 2.7 25.6
R1CH
2CH=CHCH2CH(OH)OOH 3.2 42.5
–COOCH3 3.6 51.4
C O O C O H H R1
R2 5.2 100-104
–CH=CH– 5.3 127-130
R1 C H OH OO H 5.5 133.6-135.5
R1 C