Printed in Brazil - ©2007 Sociedade Brasileira de Química 0103 - 5053 $6.00+0.00
Article
*e-mail: sergio@fat.uerj.br
A Two-year Monitoring Program of Aromatic Hydrocarbons in
Rio de Janeiro Downtown Area
Sérgio M. Corrêa*,a and Graciela Arbillab
a
Faculdade de Tecnologia,Universidade do Estado do Rio de Janeiro, Estrada Resende Riachuelo s/n, Morada da Colina, 27523-000 Resende-RJ, Brazil
b
Instituto de Química, Universidade Federal do Rio de Janeiro, Sala 408, Bloco A, CT, Cidade Universitária, 21949-900 Rio de Janeiro-RJ, Brazil
Benzeno, tolueno, etilbenzeno, m+p+o-xileno (BTEX) e dois trimetilbenzenos (BTEXT) foram monitorados no centro da cidade do Rio de Janeiro durante os anos de 2004 e 2005. Alguns poluentes legislados e parâmetros meteorológicos também foram monitorados, objetivando-se a análise da correlação entre esses dados. 94 amostras foram coletadas, usando cartuchos de carvão ativo, entre 9:00 e 15:00 h. Os valores médios de concentração obtidos foram: 14,5; 22,8; 9,19; 19,3; 8,5; 10,4 e 12,1 µg m-3 para benzeno, tolueno, etilbenzeno, m+p -xileno, o-xileno, 1,2,3-trimetilbenzeno e 1,3,5-trimetilbenzeno, respectivamente. Esses valores são similares às concentrações médias obtidas em outras cidades brasileiras, tais como, Porto Alegre, Volta Redonda e São Paulo, que usam o mesmo tipo de combustível. A análise multivariada mostrou que os BTEXT individuais são emitidos pelas mesmas fontes e não se correlacionam bem com os demais poluentes primários. Esses resultados podem ser atribuídos à contribuição das emissões evaporativas dos BTEXT e à formação de compostos orgânicos voláteis secundários na atmosfera.
Benzene, toluene, ethylbenzene, m+p+o-xylene (BTEX) and two trimethylbenzenes (BTEXT) were monitored in Rio de Janeiro downtown area during 2004 and 2005. Some criteria pollutants and meteorological parameters were also determined in order to assess the main data correlations. 94 samples were collected, using activated charcoal cartridges, between 9:00 am and 3:00 pm. The mean concentrations obtained were: 14.5, 22.8, 9.19, 19.3, 8.5, 10.4 and 12.1 µg m-3 for benzene, toluene, ethylbenzene, m+p-xylene, o-xylene, 1,2,3-trimethylbenzene and 1,3,5-trimethylbenzene, respectively. These values are similar to mean concentrations obtained in the Brazilian cities of Porto Alegre, Volta Redonda and São Paulo, which use the same type of fuel. Multivariate analyses showed that individual BTEXT are emitted by the same source and are not well correlated with other primary pollutants. These results may be due to the contribution of evaporative losses of the BTEXT and to the formation of secondary volatile organic compounds in the atmosphere.
Keywords: air pollution monitoring, hydrocarbons emision, BTEX, Rio de Janeiro
Introduction
Monoaromatic hydrocarbons are present in a considerable fraction of fossil fuels as gasoline and diesel. They can be emitted to the urban atmosphere either by volatilization or by incomplete combustion. Among these compounds, benzene has a direct impact on human health as a consequence of its carcinogenic and mutagenic properties.1 They are found mainly in the gaseous phase
and have a considerable influence in the tropospheric chemistry, mainly in the formation of photochemical oxidants, as ozone and peroxyacetyl nitrate and in a minor extent, in the reaction with ozone.
Among the aromatic compounds, benzene is the most harmful pollutant and it is responsible for myeloid leukemia. A World Health Organization (WHO) study1
estimated that for an exposure to urban concentrations of 1.7 µg m-3, 10 cases of leukemia per million inhabitant
and a correlation with the target species concentration is not possible.
Rio de Janeiro’s metropolitan area is the second largest in Brazil, with a population about 12 million people and the highest population density in the country (1700 hab. km-2).
BTEXT concentration data in Rio de Janeiro are rather sparse and the main goal of this work is to perform an extensive monitoring campaign in Rio de Janeiro downtown area, in order to evaluate a previous identified profile change of these compounds. The monitored area is located at the center of the city with a high traffic, where the unique emission source is the vehicular exhaust. Data are comparable to other urban area results, in which different gasoline blends have been used.
A recent inventory2 indicated that 77% of the emissions
are from mobile sources. 25% of ethanol blended to gasoline, known as gasohol, reduces hydrocarbon emisions. This can be explained by the hydrocarbon contents reduction and also by the engine efficiency increase , due to the high octane number of the mixture.3
Methodology
Sampling
The samples were collected at Presidente Vargas Avenue, next to an air quality automatic monitoring station, in Rio de Janeiro downtown area (22º54’S, 43º10’W). A total of 94 samples were collected, always from 9:00 am to 3:00 pm during 2004 and 2005. All the samples were collected on workdays without rain (66 on Wednesdays, 13 on Thursdays, and 15 on Fridays).
The sampling system was located at about 1.5 m above the ground, and consisted of a battery pump (SKC PCXR4), a flow meter (SKC Accuflow), activated charcoal cartridges (SKC 226-09) and Teflon tubes. Sampling flow rates were between 0.7 to 1.0 L min-1. After sampling, the
cartridges were identified, sealed and stored below 5 ºC until extraction. All other conditions were the same as in previous work.4
Analytical procedure
The front and back sorbent sections of the cartridges (400/200 mg) were put in separate 2 mL vials and 1.0 mL of dichloromethane was added to each bed, which stood for one hour with occasional agitation. The samples were considered valid when the back bed BTEXT content was bellow 5% of the front bed. During the extraction procedure the cartridges and the dichloromethane were
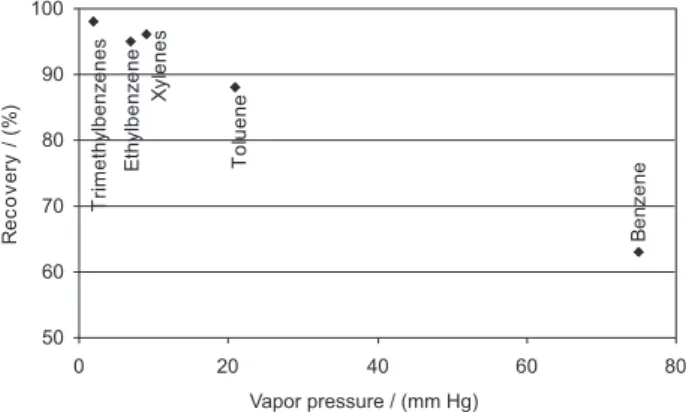
kept bellow 5 ºC to prevent volatilization. The desorption efficiency was estimated using five cartridges for five standard levels plus three media blanks. Cartridges front bed were spiked with one microliter of standard solution (Chem Service USTWI-1RPM) and were immediately capped and allowed to stand overnight. Extractions were performed using the same procedure as for the samples. The results indicated a strong correlation of the desorption efficiency with the vapor pressure of each hydrocarbon, as presented in Figure 1. Results obtained for ambient air samples were corrected by the desorption efficiency obtained.
Chemical analyses were performed using a gas chromatography with flame ionization detector (Agilent model 6890). It was employed a HP-1 column (50m ×
0.25 mm × 0.45 µm) operated from 35 °C (4 min hold) to
250 °C with a heating rate of 10 °C min-1. The injector
and detector temperatures were 250 and 300 °C, respec-tively. Hydrogen was used as carrier gas at 1.0 mL min-1
in splitless mode.
Quality control and assurance
Identification and quantification were performed using five levels of a commercial standard mixture (Chem Service USTWI-1RPM), according to retention times and to peak areas of the calibration standards, varying from 2.0 to 20 mg L-1. Correlation coefficients of the calibration
curves were better than 0.99 for a linear least-square data fit Each sample was analyzed at least twice with deviations below 10% of the obtained area. The high detection limit was obtained for benzene of 0.8 µg m-3.
Criteria pollutants and meteorological parameters
Automated on-line equipment monitored the criteria pollutants. Ozone and NOx were monitored by chemi-luminescence, SO2 by fluorescence, CO by infrared,
Figure 1. Desorption efficiency compared with vapor pressure.
B
enz
ene
T
o
luene
X
y
lenes
E
thy
lbenz
ene
T
ri
m
et
hy
lbenz
enes
50 60 70 80 90 100
0 20 40 60 80
Vapor pressure / (mm Hg)
R
e
co
ve
ry
/
(%
inhalable particulate (PM2.5) by optical properties and methane and total hydrocarbons (THC) by gas chroma-tography. Meteorological parameters as temperature and relative humidity were also monitored. Values used for the statistical analyses in this work are average values for the sampling period (9:00 am to 3:00 pm). The reported value for the mixing layer was the only available data at 10:00 am.
Statistical analysis
Multivariate analysis was used to assess the correlation between concentration data for BTEXT and other parameters (criteria pollutants concentrations and meteorological parameters). Cluster analysis was performed for the standardized matrix (19 variables and 94 data sets) using Euclidian distances.5,6
Results and Discussion
94 sample results for BTEXT are summarized in Table 1. These compounds represent the main volatile organic compounds (VOC) at ambient air and in the fuels.3 Toluene
was the principal VOC found in Rio de Janeiro downtown area, but benzene exhibited the highest variability and the maximum value. Also, the benzene average value was 8.5 times greater than the WHO study,1 in contrast with
the annual average limit value, 5 µg m-3, proposed by the
European Union.7
Values obtained in this work are in the same range than those previously obtained in Rio de Janeiro and others Brazilian cities later than 1997, when catalytic converters were currently being used.8-15 A direct comparison of these
values is not possible, once the analytical methods of sampling and analysis were different. Also the technological level of engines, fuels, state law restrictions, fleet composition and vehicular flux are different for each city. In particular, results for Rio de Janeiro were obtained under different conditions. Data from Greenpeace8 were
collected using an automatic monitor in Cinelândia square, also in the downtown area. Data from Machado9 and
Fernandes et al.10 were obtained using charcoal cartridges
and gas chromatography analyses. Although, these authors do not report if the recovery efficiency was evaluated. Mean values in this present work are, in general, higher than mean values previously obtained. This difference may be due to analytical procedures and also to fuels composition changes.
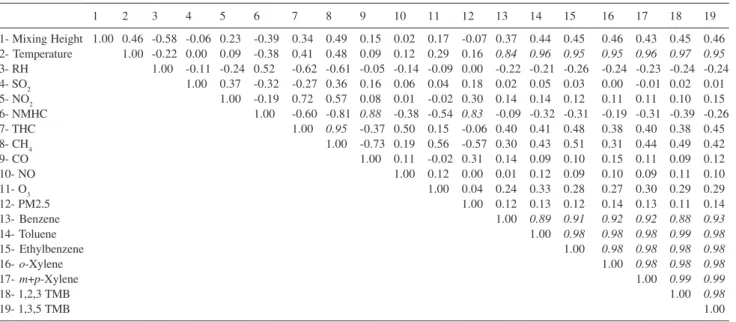
In order to identify the relation among the 19 variables involved (3 meteorological parameters, 9 criteria pollutants and 7 VOC), the obtained data was normalized and a correlation matrix was proposed, as displayed in Table 2.
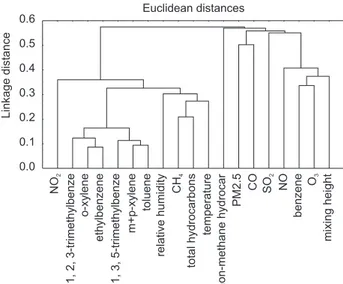
BTEXT correlation coefficients were higher than 0.89, indicating that these pollutants came from the same emission source, as can be seen in Figure 2. Correlation of individual BTEXT with other primary pollutants (CO, NOx and particulate matter) is rather weak (< 0.50) while correlation coefficients with temperature are higher than 0.89. These results indicate that BTEXT main source may be the evaporative losses and not the combustion of fuels. The sampling location has many parking areas and traffic jams are very frequent, which may increase evaporative contributions to emissions. Correlation with methane is also very poor, since this compound is mainly emitted by vehicles powered by compressed natural gas (almost 10% of the fleet). The poor correlation with non-methane hydrocarbons (NMHC) may be explained by the contribution of secondary pollutants, also shown by the low correlation between NMHC and CO. Today, according to the recent emission inventory for São Paulo state,16
about 46% of the total hydrocarbons emissions are due to
Table 1. Consolidated results for 94 samples collected in Rio de Janeiro downtown area during 2004-2005 (n = 94)
BTEXT/(µg m-3) Minimum Mean Maximum S.D.
Benzene 4.82 14.5 40.7 8.2
Toluene 9.12 22.8 37.5 6.6
Ethyl benzene 5.98 9.19 13.3 1.7
m+p- Xylene 7.55 19.3 33.1 5.3
o-Xylene 5.06 8.50 12.3 1.6
1,2,3-trimethylbenzene 5.30 10.4 15.6 2.5 1,3,5-trimethylbenzene 7.28 12.1 19.6 2.8
Figure 2. Cluster analysis of 19 variables in Rio de Janeiro downtown area.
Euclidean distances
Linkage
distance
0.0 0.1 0.2 0.3 0.4 0.5 0.6
NO
2
1,
2,
3-trimethylbenze
o-xylene
ethylbenzene
1,
3,
5-trimethylbenze
m+p-xylene
toluene
relative
humidity
CH
4
total
hydrocarbons temperature
non-methane
hydrocar
PM2.5
CO SO
2
NO
benzene
O3
mixing
evaporative emissions. Unfortunately no data are available for Rio de Janeiro city. This evidence can also be interpreted at the cluster analysis presented in Figure 2, with a moderate correlation of the group formed by methane, total hydrocarbons and temperature.
A study to identify seasonal changes was also performed, but no correlation among VOCs mixing ratios and seasonality was identified.
Conclusions
This study presents a two-year monitoring campaign results performed in Rio de Janeiro downtown area. The main source of emissions in this area is the vehicular fleet, fueled with hydrated ethanol, gasohol (a 78% gasoline and 22% anhydrous ethanol mixture), diesel and, in minor extent, natural gas. Although, a direct comparison is not possible, it can be noted that BTEXT concentrations are in the same range of other Brazilian cities. In general, these concentrations are lower than in other developing countries17-20 and higher than mean values for developed
countries concentrations.21-29 When compared to Rio de
Janeiro data, obtained in the 1997-2002 period, a clear increase in concentrations was observed, mainly for benzene. Data obtained at the downtown monitoring station (Presidente Vargas Avenue) by FEEMA regulatory agency, show that mean concentrations of ozone, NOx and methane increased from 4.8 ppb, 81.2 ppb and 2.4 ppm, respectively, in 2001, to 7.7 ppb, 113.3 ppb and 3.4 ppm, respectively, in 2004. Non-methane hydrocarbons remained nearly constant in this period with concentrations of 0.3 ppm, 0.5 ppm, 0.5 ppm and 0.4 ppm for 2001, 2002, 2003 and 2004,
respectively. NOx, methane and ozone increase is probably a consequence of natural gas use, while BTEX increase, mainly benzene and the maintenance of non-methane hidrocarbons levels, may reflect the vehicular fleet increase and fuel composition changes. Anyway, the differences in analytical procedures should be also considered. Multivariate analysis gave a strong correlation between individual BTEXT and a poor correlation with other primary pollutants, indicating that aromatic compounds are originated from the same source of emission and the evaporative losses are relevant to total emission balance.
Acknowledgment
This work was partially supported by FAPERJ. The authors thank FEEMA kind contribution in providing data from its monitoring station.
References
1. WHO; Air quality guidelines for Europe. Downloaded from http://www.euro.who.int/document/e71922.pdf, 2000. Accessed in October 2006.
2. FEEMA; Inventário de fontes emissoras de poluentes atmosféricos da Região Metropolitana do Rio de Janeiro, Rio de Janeiro, Brasil, 2004.
3. ANP – Agência Nacional do Petróleo; Portaria nº 309 de 27 de Dezembro de 2001, 2002, Available at: http://www.anp.gov.br/ doc/portarias/2001/Portaria_ANP_309_2001.pdf. Accessed in October 2006.
4. Corrêa, S. M.; Martins, E. M.; Arbilla, G.; Atmos. Environ.
2003, 37, 23. Table 2. Correlation matrix for 3 meteorological parameters, 9 criteria pollutants and 7 BTEXT
1 2 3 4 5 6 7 8 9 10 11 12 13 14 15 16 17 18 19
1- Mixing Height 1.00 0.46 -0.58 -0.06 0.23 -0.39 0.34 0.49 0.15 0.02 0.17 -0.07 0.37 0.44 0.45 0.46 0.43 0.45 0.46 2- Temperature 1.00 -0.22 0.00 0.09 -0.38 0.41 0.48 0.09 0.12 0.29 0.16 0.84 0.96 0.95 0.95 0.96 0.97 0.95
3- RH 1.00 -0.11 -0.24 0.52 -0.62 -0.61 -0.05 -0.14 -0.09 0.00 -0.22 -0.21 -0.26 -0.24 -0.23 -0.24 -0.24 4- SO2 1.00 0.37 -0.32 -0.27 0.36 0.16 0.06 0.04 0.18 0.02 0.05 0.03 0.00 -0.01 0.02 0.01
5- NO2 1.00 -0.19 0.72 0.57 0.08 0.01 -0.02 0.30 0.14 0.14 0.12 0.11 0.11 0.10 0.15
6- NMHC 1.00 -0.60 -0.81 0.88 -0.38 -0.54 0.83 -0.09 -0.32 -0.31 -0.19 -0.31 -0.39 -0.26
7- THC 1.00 0.95 -0.37 0.50 0.15 -0.06 0.40 0.41 0.48 0.38 0.40 0.38 0.45
8- CH4 1.00 -0.73 0.19 0.56 -0.57 0.30 0.43 0.51 0.31 0.44 0.49 0.42
9- CO 1.00 0.11 -0.02 0.31 0.14 0.09 0.10 0.15 0.11 0.09 0.12
10- NO 1.00 0.12 0.00 0.01 0.12 0.09 0.10 0.09 0.11 0.10
11- O3 1.00 0.04 0.24 0.33 0.28 0.27 0.30 0.29 0.29
12- PM2.5 1.00 0.12 0.13 0.12 0.14 0.13 0.11 0.14
13- Benzene 1.00 0.89 0.91 0.92 0.92 0.88 0.93
14- Toluene 1.00 0.98 0.98 0.98 0.99 0.98
15- Ethylbenzene 1.00 0.98 0.98 0.98 0.98
16- o-Xylene 1.00 0.98 0.98 0.98
17- m+p-Xylene 1.00 0.99 0.99
18- 1,2,3 TMB 1.00 0.98
5. De Bock, L. A.; Van Grieken, R. E.; Camuffo, D.; Grime, G. W.; Environ. Sci. Technol.1996, 30, 3341.
6. Fernadez, A. J.; Ternero, M.; Barragan, F. J.; Jimenez, J. C.;
Chemosphere2000, 2, 123.
7. Daughter Directive on Benzene; No. Prev. Doc.: 13586/99 ENV 418 CODEC 745, 1999.
8. Greenpeace; Contaminação do Ar: São Paulo e Rio de Janeiro, Rio de Janeiro, Brazil, 1997.
9. Machado, M. C. S.; M. Sc. Dissertation, Universidade Federal do Rio de Janeiro, Brazil, 2002.
10. Fernandes, M. B.; Brickus, L. S. R.; Moreira, J. C.; Cardoso, J. N.; Chemosphere2002, 47, 417.
11. Gioda, A.; Pereira, A. S.; Neto, F. R. A.; Abstracts of the 23ª
Reunião Anual da Sociedade Brasileira de Química, Poços de
Caldas, Brazil, 2002.
12. Grosjean, E.; Grosjean, D.; J. Braz. Chem. Soc.1998, 9, 131. 13. Grosjean, E.; Rasmussen, R. A.; Grosjean, D.; Environ. Sci.
Technol.1998, 33, 1970.
14. Colon, M.; Pleil, J. D.; Hartlage T. A.; Guardani, M. L.; Martins M. H.; Atmos. Environ.2001, 35, 4017.
15. Gee, I. L.; Sollars, C. J.; Chemosphere1998, 36, 2497. 16. CETESB; Relatório da Qualidade do Ar do Estado de São Paulo,
São Paulo, Brazil, 2004.
17. Ho, K. F.; Lee, S. C.; Chiu, G. M. Y.; Atmos. Environ.2002, 36, 57.
18. Barletta, B.; Meinardi, S.; Simpson, I. J.; KHwaja, H. A.; Blake, D. R.; Rowland F. S.; Atmos. Environ. 2002, 36, 3429. 19. Wang, X.; Sheng, G.; Fu, J.; Chan, C, Lee, S.; Chan, L.Y.; Wang,
Z.; Atmos. Environ.2002, 36, 5141.
20. Muezzinoglu, A.; Odabasi, M.; Onat, L.; Atmos. Environ.2001,
35, 753.
21. Mohamed, M. F.; Kang, D.; Aneja, V. P.; Chemosphere2002,
47, 863.
22. Schneider, P.; Gebefugi, I.; Richter, K.; Wölke, G.; Schnelle, J.; Wichmann, H. E.; Heinrich, J.; Sci. Total Environ.2001,
267, 41.
23. Keymeulen, R.; Gorgenyi, M.; Heberger, K.; Priksane, A.; Langenhove, H.V.; Atmos. Environ.2001, 35, 6327.
24. Brocco, D.; Fratarcangelli, R.; Lepore, L.; Petricca, M.; Ventrone, I.; Atmos. Environ.1997, 31, 557.
25. Tolnai, B.; Hlavay, J.; Moller, D.; Prumke, H. J.; Becker, H.; Dostler, M.; Microchem. J.2000, 67, 163.
26. Ferrari, C. P.; Kaluzny, P.; Roche, A.; Jacob, V.; Foster, P.;
Chemosphere1998, 37, 1587.
27. Ilgen, E.; Karfich, N.; Levsen, K.; Angerer, J.; Schneider, P.; Heinrich, J.; Wichmann, H.; Dunemann, L.; Begerow, J.; Atmos. Environ.2001, 35, 1235; Ilgen, E.; Levsen, K.; Angerer, J.; Schneider, P.; Heinrich, J.; Wichmann, H.; Atmos. Environ.
2001, 35, 1253; Ilgen, E.; Levsen, K.; Angerer, J.; Schneider, P.; Heinrich, J.; Wichmann, H.; Atmos. Environ.2001, 35, 1265. 28. Na, K.; Kim, Y. P.; Moon, K. C.; Atmos. Environ.2003, 37,
733.
29. Rappengluck, B.; Fabian, P.; Atmos. Environ.1999, 33, 3843.
Received: May 1, 2006