Effect of chronic ethanol exposure on rat ventilatory
responses to hypoxia and hypercapnia
Joa˜o Paulo J. Sabino,IAndreia Lopes da Silva,IILeonardo B Resstel,IIIJose Antunes-Rodrigues,II Mogens L. Glass,II Luiz G. S. BrancoI
IUniversidade de Sa˜o Paulo, Dental School of Ribeirao Preto, Department of Physiology, Ribeira˜o Preto, SP/Brazil.IIUniversidade de Sa˜o Paulo, School of
Medicine of Ribeira˜o Preto, Department of Physiology, Ribeira˜o Preto, SP/Brazil.IIIUniversidade de Sa˜o Paulo, School of Medicine of Ribeira˜o Preto,
Department of Pharmacology, Ribeira˜o Preto, SP/Brazil.
OBJECTIVE: The effect of chronic ethanol exposure on chemoreflexes has not been extensively studied in experimental animals. Therefore, this study tested the hypothesis that known ethanol-induced autonomic, neuroendocrine and cardiovascular changes coincide with increased chemoreflex sensitivity, as indicated by increased ventilatory responses to hypoxia and hypercapnia.
METHODS:Male Wistar rats were subjected to increasing ethanol concentrations in their drinking water (first week: 5% v/v, second week: 10% v/v, third and fourth weeks: 20% v/v). At the end of each week of ethanol exposure, ventilatory parameters were measured under basal conditions and in response to hypoxia (evaluation of peripheral chemoreflex sensitivity) and hypercapnia (evaluation of central chemoreflex sensitivity).
RESULTS: Decreased respiratory frequency was observed in rats exposed to ethanol from the first until the fourth week, whereas minute ventilation remained unchanged. Moreover, we observed an increased tidal volume in the second through the fourth week of exposure. The minute ventilation responses to hypoxia were attenuated in the first through the third week but remained unchanged during the last week. The respiratory frequency responses to hypoxia in ethanol-exposed rats were attenuated in the second through the third week but remained unchanged in the first and fourth weeks. There was no significant change in tidal volume responses to hypoxia. With regard to hypercapnic responses, no significant changes in ventilatory parameters were observed.
CONCLUSIONS: Our data are consistent with the notion that chronic ethanol exposure does not increase peripheral or central chemoreflex sensitivity.
KEYWORDS: Ethanol; Chemoreflex; Hypercapnia; Hypoxia.
Sabino JP, Silva AL, Resstel LB, Antunes-Rodrigues J, Glass ML, Branco LG. Effect of chronic ethanol exposure on rat ventilatory responses to hypoxia and hypercapnia. Clinics. 2014;69(5):360-366.
Received for publication onJuly 2, 2013;First review completed onAugust 13, 2013;Accepted for publication onSeptember 24, 2013 E-mail: branco@forp.usp.br
Tel.: 55 16 3602-4051
& INTRODUCTION
Evidence in the literature has shown that ethanol (ETOH) exposure stimulates changes in the neuroendocrine and autonomic nervous systems (1-3). The characterized auto-nomic nervous system changes include an enhanced cardiac sympathetic baroreflex and a reduced cardiac parasympa-thetic baroreflex (2,4). In addition, diminished baroreflex control, which is a sympathoinhibitory reflex, may be involved in increased arterial pressure (2), as observed in experimental animals and humans upon ETOH exposure
(2,3,5-10). Moreover, relationships between ETOH con-sumption and increased mortality have been reported (11,12).
Respiratory reflexes are related to cardiac autonomic control (13). Therefore, the peripheral-chemoreflex (trig-gered by hypoxia) and central-chemoreflex (trig(trig-gered by hypercapnia), which are sympathoexcitatory reflexes, may be increased following ETOH consumption. The effect of acute, but not chronic, ETOH exposure on chemoreflexes has been evaluated by several studies in humans (14,15), which demonstrated that acute ETOH intake did not alter the ventilatory response to hypoxia (15) or hypercapnia (14,15). Although there is evidence that ETOH consumption has acute effects on chemoreflexes in humans (14,15), the effect of chronic ETOH exposure on the peripheral and central chemoreflexes of experimental animals has never been assessed.
We hypothesized that chronic ETOH exposure increases peripheral and central chemoreflex sensitivity. To test this
Copyrightß2014CLINICS– This is an Open Access article distributed under the terms of the Creative Commons Attribution Non-Commercial License (http:// creativecommons.org/licenses/by-nc/3.0/) which permits unrestricted non-commercial use, distribution, and reproduction in any medium, provided the original work is properly cited.
No potential conflict of interest was reported.
hypothesis, we established a time course of changes in chemoreflex sensitivity during four weeks of ETOH exposure.
& MATERIALS AND METHODS
ETOH exposure
Experiments were performed using male Wistar rats (250 to 300 g, n = 24). The rats were collectively housed (4 rats per cage) in plastic cages, had free access to food and water and were maintained with a 12512 h light-dark cycle. All
experimental procedures were performed in accordance with the Guide for the Care and Use of Laboratory Animals [Dept. of Health, Education and Welfare, Publication No. (NIH) 85-23, Revised 1985; Office of Science and Health Reports, DRR/NIH, Bethesda, MD]. The experimental protocols used in this study were approved by the Local Committee of Ethics in Animal Research of the School of Medicine of Ribeira˜o Preto, University of Sa˜o Paulo (protocol 065/2009). After habituation for 7 days, the rats were randomly divided into two groups: the first group received tap water (control group), and the second group received an increasing concentration (v/v) of ETOH (Labsynth, Diadema, SP, Brazil) in their drinking water for four weeks (first week: 5%, second week: 10%, third and fourth weeks: 20%). The ETOH doses tested in preliminary experiments were based on previously published data (16), and those that produced consistent, repeatable responses were adopted for use in this study.
Measurement of respiratory parameters
Minute ventilation (VE) was obtained by whole-body
plethysmography (17). Unanesthetized rats were placed into a 5 L Plexiglas chamber at 25
˚
C and allowed to move freely while humidified air circulated throughout the chamber. During each VE measurement, the airflow was interruptedfor a short time (,2 min), and the chamber remained closed.
Breathing-related oscillations in pressure were detected by a differential transducer and amplified (MLT141 spirometer, Power Lab, AdInstruments, NSW, Australia). The recordings were saved and analyzed using PowerLab Chart5 software (AdInstruments, NSW, Australia). A volume calibration was performed during each VE measurement throughout the
course of the experiments by injecting a known air volume (1 mL) inside the chamber. The tidal volume (VT) was
calculated using a previously described formula (17). VEwas
calculated as the product of VTand respiratory frequency (f),
and it is presented at the ambient barometric pressure and at body temperature and ambient pressure saturated with water vapor (BTPS). A gas-mixing pump (Cameron, Canada) allowed the chamber to be ventilated with different gas mixtures.
Experimental protocol
During the four weeks of exposure to ETOH or tap water, each animal was exposed to hypercapnia or hypoxia once at the end of each week according to an experimental protocol adapted from Sabino et al. (18). The animals were placed into a plethysmographic chamber and allowed to move freely for 40-50 min for acclimatization while the chamber was flushed with humidified air (21% O2, 79% N2, 1.2 L/
min). After the baseline measurement of ventilatory para-meters, each animal was subjected (30 min) to hypoxia (10% inspired O2) or hypercapnia (7% inspired CO2), and the
ventilatory parameters were measured at 10, 20 and 30 minutes after each exposure.
Statistical analysis
The results are expressed as the mean¡standard error of
the mean (SEM). The basal values and changes in f, VTand
VEin response to hypoxia and hypercapnia were evaluated
using two-way ANOVA followed by Tukey’s post-hoc test. Differences were considered statistically significant at
p,0.05.
& RESULTS
Baseline ventilatory parameters
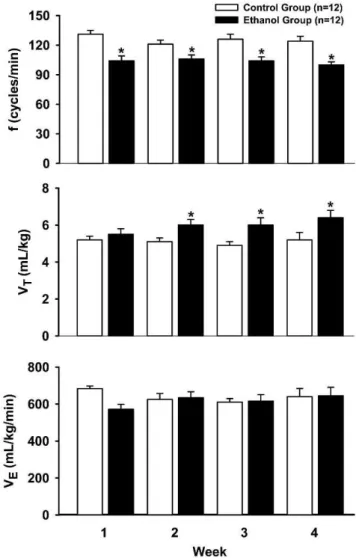
Figure 1 shows the baseline ventilatory parameters before hypoxia and hypercapnia. During the four weeks of the study, rats administered ETOH showed lower baseline values for f compared with the control tap water group (F1.63= 29.55,p,0.05). After the first week, experimental rats showed a higher VT (F1.63= 8.03, p,0.05), whereas VE
Figure 1 -Baseline values of respiratory frequency (f, top), tidal
remained unchanged during the experimental period (F1.63= 0.46,p.0.05) (Figure 1).
Ventilatory response to hypoxia
In general, during the four-week period, hypoxia caused a sharp (1.8-fold) increase in VEthat was maintained during
the 30 minutes of hypoxia exposure. This increased VEwas
due to increases in f and VT.
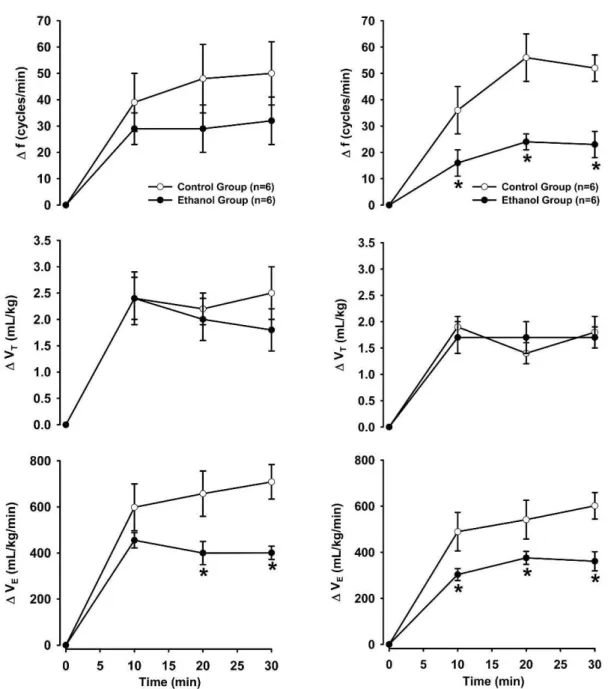
Figure 2 shows the changes in ventilatory parameters in response to hypoxia during the first and second weeks. Rats that received ETOH exhibited a similar increase in f (F1.30= 1.42,p.0.05) and VT(F1.30= 0.24,p.0.05). However,
the increase in VE was attenuated in the ETOH group
(F1.30= 7.81, p,0.05) compared with the control group (Figure 2). In the second week, the hypoxia-induced increase in VT was similar in both groups (F1.30= 0,
p.0.05); however, hypoxia-induced tachypnea (F1.30= 13.63,
p,0.05) and the response of VE to hypoxia (F1.30=
8.49, p,0.05) were lower in rats that received ETOH (Figure 2).
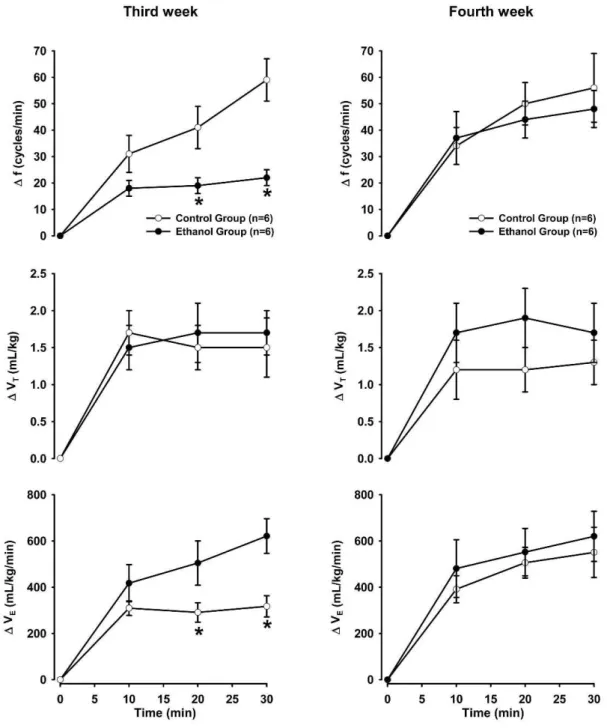
Figure 3 shows the changes in the ventilatory parameters in response to hypoxia during the third and fourth weeks of ETOH exposure. In the third week, the ETOH group showed attenuated increases in f (F1.30= 19.08,p,0.05) and
Figure 2 -Changes during the first (left panel) and second (right panel) weeks in respiratory frequency (f, top), tidal volume (VT, middle)
VE (F1.30= 9.51, p,0.05). In contrast, the changes in VT
(F1.30= 0.05,p.0.05) were similar in the ETOH and control groups (Figure 3). In the final week, hypoxia caused similar increases in f (F1.30= 0.14,p.0.05), VT (F1.30= 1.23,p.0.05) and VE(F1.30= 0.28,p.0.05) in both groups.
Ventilatory response to hypercapnia
Similar to hypoxia, the typical hypercapnia-induced hyperventilation response was generally observed in all groups. Hypercapnia caused a sharp (2.5-fold) increase in VE that was maintained during the 30 minutes of
hyper-capnia. This increase in VEwas due to increases in f and VT.
Figure 4 shows the changes in ventilatory parameters in response to hypercapnia during the first and second weeks. In the control and ETOH groups, hypercapnia caused similar increases in f (F1.30= 3.85, p.0.05 and F1.30= 2.38,
p.0.05, respectively), VT(F1.30= 3.96,p.0.05 and F1.30= 0.05,
p.0.05, respectively) and VE (F1.30= 0.12, p.0.05 and F1.30= 0.48,p.0.05, respectively) (Figure 4). Figure 5 shows
the ventilatory parameters in response to hypercapnia during the third and fourth weeks. In the control and ETOH groups, hypercapnia caused similar increases in f (F1.30= 1.90,p.0.05 and F1.21= 0.83,p.0.05, respectively), VT
(F1.30= 1.32, p.0.05 and F1.21= 0.16, p.0.05, respectively)
Figure 3 - Changes during the third (left panel) and fourth (right panel) weeks in respiratory frequency (f, top), tidal volume
and VE (F1.30= 1.45, p.0.05 and F1.30= 0.28,p.0.05, respec-tively).
& DISCUSSION
In this study, we tested the hypothesis that chronic ETOH exposure increases peripheral and central chemoreflex sensitivity. Surprisingly, the obtained data do not support our hypothesis because a reduced ventilatory response to hypoxia was observed, indicating decreased peripheral chemoreflex sensitivity. In addition, we found an unaltered ventilatory response to hypercapnia in rats administered ETOH, indicating unchanged central chemoreflex sensitiv-ity. Such findings indicate that the autonomic control
changes observed during chronic ETOH intake are complex and that the well-documented elevation in sympathetic tonus (responsible for ETOH-induced hypertension) may not involve increased chemoreflexes.
Moreover, this study also provides evidence indicating that chronic ETOH intake reduces f, with little effect on VE,
due to a higher VT. Similarly, VE has been observed to be
normal in subjects who were acutely exposed to ETOH (14,15). Therefore, the results indicate that pulmonary ventilation remains unchanged in both humans and experi-mental animals following exposure to ETOH.
Conversely, when ETOH is administered during the perinatal period, a marked decrease in spontaneous
Figure 4 -Changes during the first (left panel) and second (right panel) weeks in respiratory frequency (f, top), tidal volume (VT, middle)
respiratory frequency and VE can be observed in 3- to
4-week-old rats, whereas VTremains unchanged (19). The
differences between our results and those of Dubois and colleagues (19) may be due to the periods of ETOH exposure examined, the concentration of ETOH or the age of the animals. Nevertheless, it is worth noting that both studies showed a decrease in spontaneous f after ETOH exposure.
As previously mentioned, this study showed that chemoreflex sensitivity was attenuated in response to hypoxia until the third week of ETOH exposure. These results indicate that the chemoreflex, which is a sym-pathoexcitatory reflex, may not be involved in the increased sympathetic or decreased parasympathetic activities and
consequent hypertension observed in rats after ETOH exposure (2,3). In agreement with this notion, ETOH was reported to have an inhibitory effect on chemoreflexes by Sun and Reis (20), who showed that the increased blood pressure and vasomotor neuronal activity (located in the rostroventrolateral area of the medulla oblongata) in response to intracarotid cyanide administration were markedly attenuated following acute ETOH exposure.
Another reflex evaluated in this study was the central chemoreflex, which has been evaluated based on the ventilatory response to hypercapnia (15,21-24). We found that chronic ETOH exposure did not alter the increases in f, VT or VE induced by hypercapnia. Similarly, previous
Figure 5 - Changes during the third (left panel) and fourth (right panel) weeks in respiratory frequency (f, top), tidal volume
studies performed in humans have also shown that hypercapnia-induced hyperventilation is not affected by acute ETOH exposure (14,15). Reconciling the available data, it appears that the central chemoreflex is not involved in the autonomic changes (including hypertension) induced by ETOH during acute or chronic ETOH exposure.
Thus, clinical evaluations of alcoholics should focus on the autonomic (including blood pressure) and endocrine changes caused by ETOH consumption but may not necessarily need to examine chemoreflex sensitivity. In fact, it has been documented that abstinent alcoholic subjects may show abnormal respiratory events during sleep; however, such changes are unlikely to be related to changes in chemoreflex sensitivity (25).
In conclusion, our results indicate that the chronic admin-istration of ETOH to rats does not increase peripheral or central chemoreflex sensitivity. Therefore, chemoreflex sensitivity may not be related to the autonomic, neuroendocrine and cardio-vascular changes observed following chronic ETOH exposure.
& ACKNOWLEDGMENTS
Funding for the present study was provided by Fundac¸a˜o de Amparo a` Pesquisa do Estado de Sa˜o Paulo (FAPESP), Conselho Nacional de Desenvolvimento Cientifico e Tecnolo´gico (CNPq) and Coordenadoria de Aperfeic¸oamento de Pessoal de Nı´vel Superior (CAPES).
& AUTHOR CONTRIBUTIONS
Sabino JP and Lopes da Silva A collected the data presented in this manuscript. Resstel LB and Glass ML provided valuable insights regarding data interpretation and revised the manuscript. Branco LGS was the mentor of Sabino JP and was responsible for the conception and development of the study.
& REFERENCES
1. Clarck LT. Alcohol induced hypertension: mechanisms, complications, and clinical implications. J Natl Med Assoc. 1985;77(5):385-9.
2. Resstel LB, Tirapelli CR, Lanchote VL, Uyemura AS, De Oliveira AM, Correˆa FM. Chronic ethanol consumption alters cardiovascular functions in conscious rats. Life Sci. 2006;78(19):2179-87, http://dx.doi.org/10. 1016/j.lfs.2005.09.021.
3. Resstel LB, Scopinho AA, Lopes da Silva A, Antunes-Rodrigues J, Correˆa FM. Increased circulating vasopressin may account for ethanol-induced hypertension in rats. Am J Hypertens. 2008;21(8):930-5.
4. Abdel-Rahman AA, Wooles WR. Ethanol induced hypertension involves impairment of baroreceptors. Hypertension. 1987;10(1):1965-73. 5. Chan TC, Sutter MC. Ethanol consumption and blood pressure. Life Sci.
1983;33(20):1965-73, http://dx.doi.org/10.1016/0024-3205(83)90734-8. 6. Chan TC, Wall RA, Sutter MC. Chronic ethanol consumption, stress, and
hypertension. Hypertension. 1985;7(4):519-24, http://dx.doi.org/10.1161/ 01.HYP.7.4.519.
7. Puddey IB, Beilin LJ, Vandongen R, Rouse IL, Rogers P. Evidence for a direct effect of alcohol consumption on blood pressure in normotensive men. A randomized controlled trial. Hypertension 1985;7(5):707-13.
8. Puddey IB, Burke V, Croft K, Beilin LJ. Increased blood pressure and changes in membrane lipids associated with chronic ethanol treatment of rats. Clin Exp Pharmacol Physiol. 1995;22(9):655-7, http://dx.doi.org/10. 1111/j.1440-1681.1995.tb02083.x.
9. Beilin LJ. Alcohol and hypertension. Clin Exp Pharmacol Physiol. 1995;22(3):185-8, http://dx.doi.org/10.1111/j.1440-1681.1995.tb01977.x. 10. Saunders JB, Beevers DG, Paton A. Alcohol-induced hypertension.
Lancet.1981;2(8248):653-6, http://dx.doi.org/10.1016/S0140-6736(81)90995-8.
11. Hart CL, Smith GD, Hole DJ, Hawthorne VM. Alcohol consumption and mortality from all causes, coronary heart disease, and stroke: results from a prospective cohort study of scottish men with 21 years of follow up. BMJ. 1999;318(7200):1725-9, http://dx.doi.org/10.1136/bmj.318.7200. 1725.
12. Hart CL, Smith GD. Alcohol consumption and mortality and hospital admissions in men from the Midspan collaborative cohort study. Addiction. 2008;103(12):1979-86, http://dx.doi.org/10.1111/j.1360-0443. 2008.02373.x.
13. Feldman JL, Mitchell GS, Nattie EE. Breathing: rhythmicity, plasticity, chemosensitivity. Annu Rev Neurosci. 2003;26:239-66, http://dx.doi. org/10.1146/annurev.neuro.26.041002.131103.
14. Krol RC, Knuth SL, Bartlett DJr. Selective reduction of genioglossal muscle activity by alcohol in normal human subjects. Am Rev Respir Dis. 1984;129(2):247-50.
15. van de Borne P, Mark AL, Montano N, Mion D, Somers VK. Effects of alcohol on sympathetic activity, hemodynamics, and chemoreflex sensitiv-ity. Hypertension. 1997;29(6):1278-83, http://dx.doi.org/10.1161/01.HYP. 29.6.1278.
16. Lopes da Silva A, Ruginsk SG, Uchoa ET, Crestani CC, Scopinho AA, Correa FM, et al. Time-course of neuroendocrine changes and its correlation with hypertension induced by ethanol consumption. Alcohol Alcohol. 2013;48(4):495-504, http://dx.doi.org/10.1093/alcalc/agt040. 17. Bartlett DJr, Tenney SM. Control of breathing in experimental anemia.
Respir Physiol. 1970;10(3):384-95, http://dx.doi.org/10.1016/0034-5687 (70)90056-3.
18. Sabino JPJ, de Oliveira M, Giusti H, Glass ML, Fazan Junior R, Salgado HC. Hemodynamic and ventilatory response to different levels of hypoxia and hypercapnia in carotid body-denervated rats. Clinics. 2013;68(3):395-9, http://dx.doi.org/10.6061/clinics/2013(03)OA18. 19. Dubois C, Naassila M, Daoust M, Pierrefiche O. Early chronic ethanol
exposure in rats disturbs respiratory network activity and increases sensitivity to ethanol. J Physiol. 2006;576(Pt 1):297-307.
20. Sun MK, Reis DJ. Ethanol inhibits chemoreflex excitation of reticulosp-inal vasomotor neurons. Brain Res. 1996;730(1-2):182-92, http://dx.doi. org/10.1016/0006-8993(96)00445-3.
21. Narkiewicz K, Pesek CA, van de Borne PJ, Kato M, Somers VK. Enhanced sympathetic and ventilatory responses to central chemoreflex activation in heart failure. Circulation. 1999;100(3):262-7, http://dx.doi. org/10.1161/01.CIR.100.3.262.
22. Kristen AV, Just A, Haass M, Seller H. Central hypercapnic chemoreflex modulation of renal sympathetic nerve activity in experimental heart failure. Basic Res Cardiol. 2002;97(2):177-86, http://dx.doi.org/10.1007/ s003950200009.
23. Sun SY, Wang W, Zucker IH, Schultz HD. Enhanced peripheral chemoreflex function in conscious rabbits with pacing-induced heart failure. J Appl Physiol. 1999;86(4):1264-72.
24. Ueno H, Asanoi H, Yamada K, Oda Y, Takagawa J, Kameyama T, et al. Attenuated respiratory modulation of chemoreflex-mediated sym-pathoexcitation in patients with chronic heart failure. J Card Fail. 2004;10(3):236-43, http://dx.doi.org/10.1016/j.cardfail.2003.09.005. 25. Lambie DG, Tan ET, Johnson RH. Respiratory responsiveness in male