www.atmos-chem-phys.net/10/1865/2010/ © Author(s) 2010. This work is distributed under the Creative Commons Attribution 3.0 License.
Chemistry
and Physics
Temporal variability, sources, and sinks of C
1
-C
5
alkyl nitrates in
coastal New England
R. S. Russo1, Y. Zhou1, K. B. Haase1,2, O. W. Wingenter2, E. K. Frinak1, H. Mao1, R. W. Talbot1, and B. C. Sive1 1Climate Change Research Center, Institute for the Study of Earth, Oceans, and Space, University of New Hampshire,
Durham, NH 03824, USA
2Department of Chemistry, New Mexico Institute of Mining and Technology, Socorro, NM, 87801, USA
Received: 29 September 2009 – Published in Atmos. Chem. Phys. Discuss.: 3 November 2009 Revised: 6 February 2010 – Accepted: 9 February 2010 – Published: 18 February 2010
Abstract. Seven C1-C5 alkyl nitrates were measured both
on the mainland and off the coast of New Hampshire us-ing gas chromatographic techniques. Five separate data sets are presented to characterize the seasonal and diurnal trends and the major sources and loss processes of these compounds. Based on in situ measurements conducted at the University of New Hampshire (UNH) Atmospheric Ob-serving Station at Thompson Farm (TF) located in southeast NH during winter (January–February) 2002, summer (June– August) 2002, summer (July–August) 2004, and on daily canister samples collected at midday from January 2004– February 2008, the median total alkyl nitrate mixing ra-tio (6RONO2)was 23–25 pptv in winter and 14–16 pptv in
summer. During summers 2002 and 2004, MeONO2
de-creased overnight and reached minimum hourly average mix-ing ratios in the early mornmix-ing. Comparison with wind speed and trace gas trends suggested that dry deposition contributed to the early morning MeONO2minimum which is a
previ-ously unaccounted for removal mechanism. The mean dry deposition rate and velocity of MeONO2 was estimated to
be−0.5 nmol m−2hr−1 and 0.13 cm s−1, respectively. Re-sults from ambient air and surface seawater measurements made onboard the NOAA R/V Ronald H. Brown in the Gulf of Maine during the 2002 New England Air Quality Study and from ambient canister samples collected throughout the Great Bay estuary in August 2003 are also presented. Com-parisons between the alkyl nitrate trends with anthropogenic and marine tracers suggest that a marine source of alkyl ni-trates is not significant in coastal New England. Given the apparent prominence of a secondary source, comparisons
be-Correspondence to:R. S. Russo ([email protected])
tween observed and predicted alkyl nitrate/parent hydrocar-bon ratios were made which demonstrated that background mixing ratios have a continuous and prevalent influence on the alkyl nitrate distribution.
1 Introduction
Alkyl nitrates are secondary products of hydrocarbon (RH) oxidation in the presence of nitrogen oxides (NOx=NO+NO2) and represent a link between the
atmo-spheric carbon and nitrogen cycles (Reactions 1–4). The re-sulting alkyl radical (R) quickly reacts with O2 to form an
alkyl peroxy radical (RO2). Further reaction with nitric
ox-ide (NO) yields an alkoxy radical (RO) and nitrogen dioxox-ide (NO2)or an alkyl nitrate (RONO2):
RH+OHk−→1,α1R+H2O (R1)
R+O2 k2
−→RO2 (R2)
RO2+NO k3,1−α4
−→ RO+NO2 (R3)
RO2+NO k4,α4
−→RONO2 (R4)
RONO2+hν J5
−→RO+NO2 (R5)
RONO2+OH k6
−→products (R6)
wherek1,k2,k3,k4, andk6are reaction rate constants,J5is
the photolysis rate constant, andα1andα4are the reaction
radical (OH) (Reactions 5 and 6). Photolysis is dominant for the shorter-chain (C1-C3)alkyl nitrates while OH oxidation
becomes a more important loss process for the larger alkyl nitrates (Roberts, 1990; Clemitshaw et al., 1997; Talukdar et al., 1997; Flocke et al., 1998). Reactions (1–4) demonstrate that alkyl nitrates share a common photochemical production mechanism with ozone (O3), as O3 formation follows the
photolysis of the NO2formed in Reaction (R3). The
forma-tion of alkyl nitrates serves as a sink for NOxand for the RO
and RO2radicals, and therefore, impacts the O3production
efficiency (Atkinson et al., 1982; Ranschaert et al., 2000). Alkyl nitrates may be transported long distances because of their long lifetimes and serve as a temporary reservoir for NOx ultimately leading to O3production in remote regions
(Clemitshaw et al., 1997; Flocke et al., 1998; Roberts et al., 1998).
Alkyl nitrates are a component of total reactive nitrogen (NOy = NOx+ HNO3 + NO3 + N2O5 + organic nitrates),
and their relative contribution to NOy varies with location.
It should be noted that the term organic nitrate refers to sev-eral types of compounds, including monofunctional alkyl ni-trates, peroxyacetyl nini-trates, and other multifunctional or-ganic nitrate compounds. Some recent studies (i.e., Day et al., 2003; Perring et al., 2009) have used the term total alkyl nitrates (6RONO2)to refer to nonspeciated measurements
of several organic nitrate classes including isoprene nitrates, hydroxyalkyl nitrates, multifunctional organic nitrates, and the monofunctional alkyl nitrate compounds included in this work. In continental regions, the monofunctional alkyl ni-trates typically comprise less than 10% of NOybecause of
the close proximity to primary NOxemissions (e.g., Shepson
et al., 1993; Flocke et al., 1998; Thornberry et al., 2001; Simpson et al., 2006). In contrast, they may constitute a much larger proportion of NOy in remote regions, such as
the equatorial marine boundary layer (20–80%) (Talbot et al., 2000; Blake et al., 2003a) or the Arctic (∼10-20%) (Muthu-ramu et al., 1994).
Characterizing alkyl nitrates may help explain imbalances in the atmospheric NOybudget. Discrepancies between
sur-face deposition rates determined from the sum of the indi-vidual NOycompounds compared to the measured total NOy
deposition suggests that all the species contributing to the to-tal deposition are not being accounted for (e.g., Nielsen et al., 1995; Lefer et al., 1999; Horii et al., 2006). The short-fall is often largest in photochemically processed air masses and is usually attributed to unidentified alkyl and multifunc-tional organic nitrates (e.g., Nielsen et al., 1995; Munger et al., 1998; Horii et al., 2006). Consequently, research on the contribution of organic nitrogen to atmospheric nitrogen de-position and the impact on ecosystem functioning has been gaining importance (Cornell et al., 2003).
In addition to their secondary photochemical source, pri-mary emissions of light alkyl nitrates from the ocean (Atlas et al., 1993; Chuck et al., 2002; Moore and Blough, 2002; Blake et al., 2003a) and biomass burning have been observed
(Simpson et al., 2002). However, information on the relative influence of primary marine and secondary anthropogenic sources of alkyl nitrates in coastal regions is limited (e.g., Roberts et al., 1998; Chuck et al., 2002; Simpson et al., 2006). Recent modeling results suggest that the photolysis of alkyl nitrates emitted from the tropical Pacific Ocean, and the subsequent production of NO2, may increase O3
produc-tion by up to 20% (Neu et al., 2008). This demonstrates the importance of identifying alkyl nitrate sources and quantify-ing their mixquantify-ing ratios in marine environments.
The seacoast region of New Hampshire is downwind of the heavily populated and urban northeastern US corridor and is in an excellent location for studying the chemical compo-sition of air masses transported from the continental US to the North Atlantic. Previous research has shown that this area is influenced by marine, vegetative, and anthropogenic sources of nonmethane hydrocarbons (NMHCs) and halocar-bons (Sive et al., 2007; Varner et al., 2008; White et al., 2008, 2009; Zhou et al., 2005, 2008) and is strongly impacted by boundary layer dynamics (Mao and Talbot, 2004a; Talbot et al., 2005). In this work, we characterize the seasonal and di-urnal variability, sources, and sinks of C1-C5alkyl nitrates
at an inland site (Thompson Farm) and in coastal New Eng-land. A portion of the alkyl nitrate data was obtained as a component of the 2002 and 2004 New England Air Quality Studies (NEAQS). The objectives of NEAQS were to exam-ine the transport, formation, and distribution of air pollutants in New England and the Gulf of Maine. Additionally, we in-corporate data from a one day intensive study throughout the Great Bay estuary in August 2003 and daily canister sam-ples collected during 2004–2008 at Thompson Farm in order to further describe the temporal variability and atmospheric distribution of alkyl nitrates.
2 Experimental
2.1 Thompson Farm gas chromatography system: 2002 and 2004
Measurements of C2-C10 NMHCs, C1-C2halocarbons, and
C1-C5alkyl nitrates were made during winter (11 January to
NH
Durham
PA NY
NJ VT
ME
RI
CT MA Boston
Exeter Thompson Farm
Wagon Hill Farm
Pease
Fort Constitution Great
Bay
Gulf of Maine Atlantic Ocean
Montreal Quebec
NYC
New Brunswick
NH
Durham
PA NY
NJ VT
ME
RI
CT MA Boston
Exeter Thompson Farm
Wagon Hill Farm
Pease
Fort Constitution Great
Bay
Gulf of Maine Atlantic Ocean
Montreal Quebec
NYC
New Brunswick
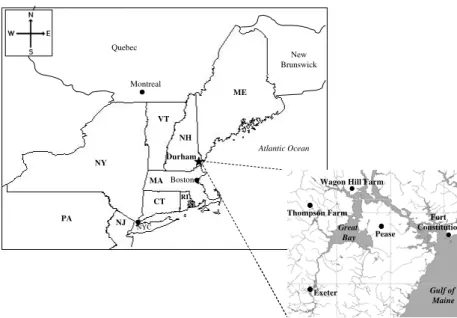
Fig. 1.Map detailing the location of Thompson Farm in Durham, New Hampshire, and (inset) the sampling sites used during the Great Bay experiment.
hydrocarbons, halocarbons, and alkyl nitrates ranged from 0.3–15%. Specifically, the alkyl nitrate measurement pre-cision is conservatively 5% for mixing ratios above 5 pptv and 10% for mixing ratios below 5 pptv. The accuracy of the alkyl nitrate measurements is 10–20%, and their detec-tion limit is 0.01 pptv. The alkyl nitrates discussed in this work are methyl nitrate (MeONO2), ethyl nitrate (EtONO2),
2-propyl nitrate (2-PrONO2), 1-propyl nitrate (1-PrONO2),
2-butyl nitrate (2-BuONO2), 2-pentyl nitrate (2-PenONO2),
and 3-pentyl nitrate (3-PenONO2). In this work, we define
the total alkyl nitrate mixing ratio (6RONO2)as the sum of
the seven individual C1-C5compounds measured at TF. 2.2 GC System on the NOAA R/V Ronald H. Brown
During 30 July to 6 August 2002, ambient air and surface seawater samples were collected onboard the NOAA Re-search Vessel Ronald H. Brown off the coasts of New Hamp-shire and Boston, MA. An automated in situ GC measured MeONO2, 2-PrONO2, and 2-BuONO2 in addition to
sev-eral hydrocarbons and halocarbons. Ambient air was sam-pled from∼15 m above the sea surface and traveled approx-imately 80 m to the GC located near the back of the ship. A portion of this air flow was drawn by the sample concentra-tor and a 1000 cc sample was cryogenically trapped. Water from the ship’s clean seawater system flowed to a Weiss type equilibrator. Air was drawn from the equilibrator at 200 ccm for determining concentrations of the stripped gases from the surface seawater. After the ambient air or equilibrator sample was concentrated, it was injected to a two gas chromatograph system. One GC quantified halocarbons and alkyl nitrates with an ECD, and the other GC measured C2-C6
hydrocar-bons by FID (Zhou et al., 2005).
2.3 Canister samples
2.3.1 Great Bay experiment
In addition to the routine measurements at TF (Sect. 2.1), an intensive study was conducted from 18:00 on 18 Au-gust to 19:00 on 19 AuAu-gust 2003 (local time) to examine the influence of marine derived halocarbons from the Great Bay estuary throughout southeast NH. The Great Bay is a 2140 hectare estuary located∼16 km inland from the coast of NH. The study area consisted of TF and 4 sites located in southern NH: Downtown Boat Launch, Exeter (42.98◦N, 70.95◦W), Fort Constitution (FC), Newcastle (43.07◦N, 70.71◦W), Pease Weather Station, Portsmouth (43.08◦N, 70.82◦W), and Wagon Hill Farm (WHF), Durham (43.13◦N, 70.87◦W) (Fig. 1 inset). At each of the four sites, an evac-uated two-liter electropolished stainless steel canister was filled to ambient pressure each hour. The samples were re-turned to the laboratory at UNH for analysis on a three GC system equipped with 2 FIDs, 2 ECDs, and a mass spectrom-eter (MS). The laboratory GC system has been previously de-scribed in Sive et al. (2005), White et al. (2008), and Zhou et al. (2005, 2008). The FIDs were used for detecting C2-C10
NMHCs, and the ECDs measured C1-C5 alkyl nitrates and
C1-C2 halocarbons. Oxygenated VOCs, sulfur compounds,
halocarbons, and several NMHCs were detected by the MS. The measurement precision for each of the hydrocarbons, halocarbons, and alkyl nitrates ranged from 0.1–12%. The alkyl nitrate measurement precision for the canister samples is conservatively 3–4% for mixing ratios above 5 pptv and
2.3.2 Thompson Farm daily canister samples
Measurements of C1-C5 alkyl nitrates from daily canister
samples collected throughout 12 January 2004 to 8 Febru-ary 2008 are also presented. The ambient air samples were collected at approximately noon (local time) from the top of the 12 m tower at TF. The four year data set was sep-arated into four seasons which are defined as winter: De-cember, January, February; spring: March, April, May; sum-mer: June, July, August; fall: September, October, Novem-ber. Note that the data includes five winter seasons (2004– 2008) and four spring, summer, and fall seasons (2004– 2007). The samples were analyzed in the lab at UNH every 1–3 months for a large suite of volatile organic compounds (C2-C10 NMHCs, C1-C5alkyl nitrates, C1-C2halocarbons,
and selected oxygenated and sulfur compounds) using the same three GC system described in Sect. 2.3.1. The pri-mary working standards for the canister analysis system were two calibrated whole air samples contained in 36 l electropol-ished low pressure pontoons (∼350 psi). Due to overlapping periods when different working standards were being used throughout the four years, mixing ratios were verified and recalibrated (if/when necessary), and were cross referenced with other calibrated whole air and synthetic standards main-tained by our laboratory. Furthermore, we have conducted several instrument intercomparison studies to verify that the measurements from the in situ TF GC and canister samples made over multiple years are comparable and to ensure the stability of VOCs within our canisters (see Sive et al., 2005; Zhou et al., 2008; Russo et al., 2010).
2.4 Ancillary measurements
Hourly average measurements of O3, carbon monoxide
(CO), carbon dioxide (CO2), and NOy made at TF during
winter and summer 2002, summer 2004, and 18–19 Au-gust 2003 were also used in this analysis. The instruments used were a Thermo Environmental Instruments (TEI) model 49C-PS using ultraviolet spectroscopy at 254 nm for O3, a
custom modified TEI model 48CTL using absorption of in-frared radiation at 4600 nm for CO, a Licor model 7000 dif-ferential infrared absorption instrument for CO2, and a TEI
model 42C using chemiluminescence measured NOy (Mao
and Talbot, 2004a, b; Talbot et al., 2005). Meteorological parameters (wind speed, wind direction, temperature) were measured with a Met One model 014A anemometer.
3 Temporal variation of alkyl nitrates at Thompson Farm
Three distinct data sets are combined to provide a robust characterization of the temporal variation of alkyl nitrates in New Hampshire. The continuous in situ measurements made at Thompson Farm during winter 2002 and summers 2002 and 2004 and the four years (2004–2008) of daily canister
samples allow both the short (diurnal to seasonal) and long (seasonal to interannual) term trends to be described (Figs. 2 and 3).
3.1 Seasonal variation
The hourly in situ GC data and the daily canister samples gave comparable seasonal statistics with mean (±standard deviation) total alkyl nitrate mixing ratios (6RONO2= sum
of individual C1-C5alkyl nitrates) of 26 (±7) pptv in winter
and 19 (±13) pptv in summer (Tables 1 and 2). The nearly 30% lower6RONO2mixing ratio in summer was driven by
the reduced levels of C3-C5 alkyl nitrates which were
typ-ically highest in late winter-early spring (February–March) and exhibited a broad minimum from May–October (Fig. 3, Table 2). In contrast, the monthly mean and median mix-ing ratios of the longer-lived MeONO2 and EtONO2 were
more uniform all year, particularly in 2004–2005, and both compounds exhibited low day-to-day variability in late fall-winter (Fig. 3a). Methyl and ethyl nitrate mixing ratios were lowest in mid-to-late summer through the fall (July–October) (Table 2).
The relative contributions of the individual C1-C5 alkyl
nitrates to 6RONO2 were nearly the same in the
continu-ous measurements and in the daily samples (Tables 1 and 2). 2-propyl nitrate was generally the most abundant, and 2-BuONO2 was at comparable to slightly higher levels in
winter-early spring. In all study years, 2-BuONO2exhibited
the most pronounced seasonal variation with approximately a factor of 2–3 higher median mixing ratio in winter than in summer. While the relative contribution of 2-BuONO2
to6RONO2decreased from winter to summer, the
contri-butions from MeONO2and EtONO2increased. As a result,
MeONO2, EtONO2, and 2-BuONO2made nearly equal
con-tributions to6RONO2in summer (15–20%). The pentyl
ni-trates and 1-PrONO2were the least abundant components of 6RONO2 all year. Overall, the alkyl nitrate mixing ratios
and distributions at TF were comparable to trends observed at other North American sites, such as Michigan (Ostling et al., 2001), Colorado and the eastern US (Stroud et al., 2001), the southeastern US (Bertman et al., 1995), Summit, Greenland (Swanson et al., 2003), Ontario, Canada (Shep-son et al., 1993), Alert NW Territories, Canada (Muthuramu et al., 1994), and Chebogue Point, Nova Scotia (Roberts et al., 1998).
Two possible explanations for the seasonal variation of alkyl nitrates at TF are (1) their different tropospheric life-times throughout the year and (2) different regional scale transport patterns. The alkyl nitrate lifetimes are shorter in summer than in winter because of higher OH concen-trations and faster photolysis rates which may explain the lower C3-C5alkyl nitrate mixing ratios (winter lifetimes∼1–
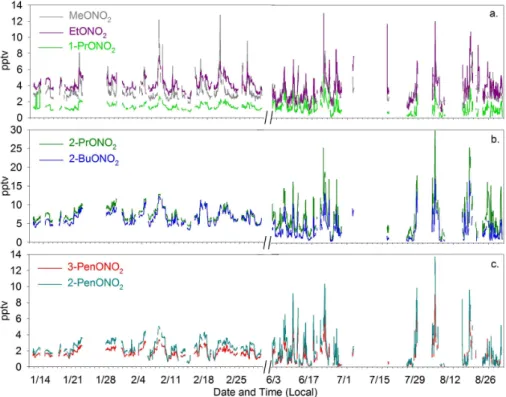
Fig. 2. Time series of(a)MeONO2, EtONO2, 1-PrONO2,(b)2-PrONO2, 2-BuONO2, and(c)2-PenONO2, 3-PenONO2(pptv) during winter (11 January–1 March) and summer (1 June–31 August) 2002. Note: there is a break in the x-axis during March–May 2002.
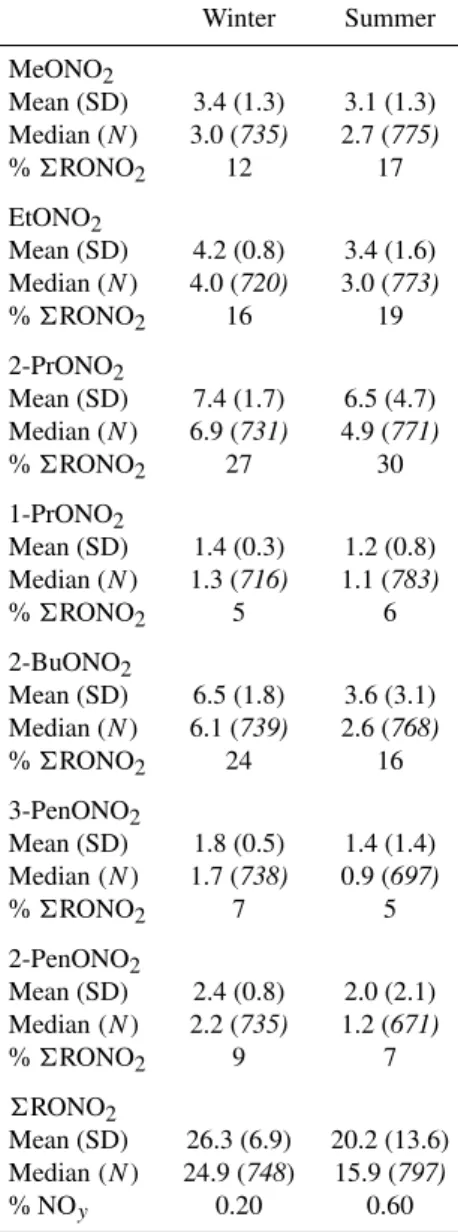
Table 1. Seasonal mean, standard deviation (SD), median, and number of samples (N) of alkyl nitrates at Thompson Farm dur-ing Winter (11 January–1 March) and Summer (1 June–31 August) 2002 (mixing ratios in pptv). %6RONO2is the median contribu-tion of each alkyl nitrate to the total alkyl nitrate mixing ratio in both seasons. %NOyis the median contribution of6RONO2to NOyin both seasons (i.e., seasonal median value of6RONO2/NOy).
Winter Summer
MeONO2
Mean (SD) 3.4 (1.3) 3.1 (1.3)
Median (N) 3.0 (735) 2.7 (775)
%6RONO2 12 17
EtONO2
Mean (SD) 4.2 (0.8) 3.4 (1.6)
Median (N) 4.0 (720) 3.0 (773)
%6RONO2 16 19
2-PrONO2
Mean (SD) 7.4 (1.7) 6.5 (4.7)
Median (N) 6.9 (731) 4.9 (771)
%6RONO2 27 30
1-PrONO2
Mean (SD) 1.4 (0.3) 1.2 (0.8)
Median (N) 1.3 (716) 1.1 (783)
%6RONO2 5 6
2-BuONO2
Mean (SD) 6.5 (1.8) 3.6 (3.1)
Median (N) 6.1 (739) 2.6 (768)
%6RONO2 24 16
3-PenONO2
Mean (SD) 1.8 (0.5) 1.4 (1.4)
Median(N ) 1.7 (738) 0.9 (697)
%6RONO2 7 5
2-PenONO2
Mean (SD) 2.4 (0.8) 2.0 (2.1)
Median(N ) 2.2 (735) 1.2 (671)
%6RONO2 9 7
6RONO2
Mean (SD) 26.3 (6.9) 20.2 (13.6)
Median(N ) 24.9 (748) 15.9 (797)
% NOy 0.20 0.60
EtONO2 likely contribute to their more homogeneous
dis-tribution throughout the year (winter lifetimes ∼1 month, summer lifetimes∼1 week) (Figs. 2 and 3; Tables 1 and 2). Additionally, previous research has documented that the chemical composition of air masses transported to New Eng-land strongly depends on both the season and source region. For example, north-northwesterly winds typically transport clean, Canadian air masses to New England that contain low O3, CO, NOy, and hydrocarbon mixing ratios and that
are representative of background conditions (Munger et al., 1996; Moody et al., 1998; Shipham et al., 1998). This trans-port pattern is more frequent during the winter. In con-trast, air masses containing enhanced levels of anthropogenic emissions are primarily observed during transport from the south and west. This air mass transport pathway occurs most frequently in summer (Moody et al., 1998; Fischer et al., 2004; Mao and Talbot, 2004b). Consequently, the seasonal variation in the dominant source region(s) of alkyl nitrates and their precursors may contribute to the seasonal trends in ambient alkyl nitrate mixing ratios observed at TF.
3.2 Diurnal variation
The chemical and physical processes controlling the at-mospheric distribution of alkyl nitrates can be elucidated through examination of their diurnal trends. During winter and summer 2002, the hourly average (±standard error) C1
-C5alkyl nitrate mixing ratios were lowest at∼05:00 to 07:00
(local time), increased throughout the morning, and reached peak levels in the afternoon (Fig. 4a, only MeONO2summer
data shown). The morning increase likely reflects a combi-nation of vertical mixing, advection, and photochemical pro-duction. This is supported by comparison to the O3, wind
speed, andJNO2 diurnal cycles (Fig. 4a). Following sunrise, surface heating causes the nocturnal boundary layer (NBL) to dissipate and air masses from the residual layer above the NBL are mixed toward the surface resulting in increased O3
and alkyl nitrate mixing ratios. This illustrates that the de-velopment and dissipation of the NBL can contribute to the C1-C5alkyl nitrate trends observed at TF in both winter and
summer.
The finding of an early morning MeONO2 minimum is
particularly intriguing because its lifetime in the atmosphere is much longer than one day. For example, the lifetime of MeONO2resulting from oxidation and photolysis is∼5 days
in summer and over one month in winter (assuming [OH] = 6×10⁵ (winter) and 2×10⁶ (summer) molecules cm−3; kOH−MeONO2= 2.3×10⁻¹⁴cm3molecule−1s−1(Atkinson et
al., 2006); JMeONO2∼ 2.2×10⁻⁶s−1 in summer (Roberts,
1990), and 0.29×10⁻⁶s−1 in winter (http://cprm.acd.ucar. edu/Models/TUV)). However, the decrease in mixing ratios throughout the night indicates the predominance of removal processes occurring on a time scale≤1 day. Processes po-tentially contributing to the early morning minima include losses from chemistry, deposition, decomposition, or mix-ing with air masses havmix-ing lower mixmix-ing ratios. Chemical reactions and decomposition can be neglected because the rates of reaction with oxidants potentially available at night, such as O3 and the nitrate radical (NO3), are insignificant
Table 2.Monthly mean, standard deviation (SD), median, and number of samples(N )from the daily canister samples collected at Thompson Farm throughout 12 January 2004–8 February 2008 (mixing ratios in pptv). %6RONO2is the median contribution of each alkyl nitrate to the total alkyl nitrate mixing ratio each month. %NOyis the median contribution of6RONO2to NOyin each month.
Jan. Feb. March April May June July Aug. Sept. Oct. Nov. Dec.
MeONO2
Mean (SD) 3.0 (0.5) 3.4 (0.4) 3.4 (0.5) 3.2 (0.4) 3.2 (0.4) 3.1 (0.9) 3.0 (0.9) 3.0 (0.9) 3.0 (0.9) 3.0 (0.6) 3.2 (0.5) 3.1 (0.4) Median (N ) 3.3(135) 3.4(109) 3.4(107) 3.2(95) 3.2(103) 3.0(99) 2.9(98) 2.9(107) 2.9(106) 2.9(91) 3.1(101) 3.1(100)
%6RONO2 14 13 13 16 20 21 19 20 19 19 15 14
EtONO2
Mean (SD) 2.7 (0.6) 2.8 (0.6) 3.2 (0.9) 2.9 (0.7) 2.7 (0.8) 2.9 (1.5) 2.6 (1.2) 2.2 (1.0) 2.3 (1.1) 2.5 (0.8) 2.8 (1.2) 2.6 (0.6) Median (N ) 2.7(136) 2.7(108) 3.0(107) 2.8(95) 2.6(103) 2.5(99) 2.4(92) 1.9(105) 2.0(111) 2.2(92) 2.5(102) 2.4(102)
%6RONO2 11 11 12 14 16 17 15 14 14 14 12 11
2-PrONO2
Mean (SD) 6.2 (2.0) 6.8 (1.8) 7.7 (2.8) 6.2 (2.1) 4.9 (2.3) 5.0 (3.7) 5.4 (3.4) 4.6 (2.8) 4.9 (3.2) 5.1 (2.8) 5.9 (2.0) 6.3 (2.8) Median (N ) 5.8(137) 6.4(108) 6.8(108) 5.6(95) 4.1(105) 3.6(101) 4.6(98) 3.7(107) 4.0(111) 4.0(92) 5.4(102) 5.4(102)
%6RONO2 24 25 27 28 27 25 29 27 27 26 26 25
1-PrONO2
Mean (SD) 0.8 (0.3) 0.9 (0.3) 0.9 (0.3) 0.8 (0.3) 0.7 (0.5) 0.7 (0.5) 0.7 (0.4) 0.6 (0.3) 0.6 (0.4) 0.7 (0.4) 0.7 (0.3) 0.8 (0.4) Median (N ) 0.8(137) 0.8(108) 0.8(108) 0.7(94) 0.6(105) 0.6(101) 0.6(98) 0.5(107) 0.5(109) 0.5(92) 0.6(102) 0.7(102)
%6RONO2 3 3 3 4 4 4 4 4 4 3 3 3
2-BuONO2
Mean (SD) 7.2 (2.7) 7.5 (2.6) 7.7 (3.0) 5.2 (2.0) 3.2 (1.8) 3.2 (2.7) 3.1 (2.2) 2.9 (2.1) 3.6 (2.8) 4.5 (3.1) 6.1 (2.6) 7.0 (4.1) Median (N ) 6.8(135) 6.8(108) 6.9(106) 4.7(95) 2.8(105) 2.1(101) 2.7(98) 2.3(107) 2.7(111) 3.2(92) 5.1(102) 5.7(102)
%6RONO2 28 26 27 23 18 15 17 17 18 21 25 26
3-PenONO2
Mean (SD) 2.4 (1.1) 2.8 (1.2) 2.7 (1.6) 1.7 (0.9) 1.4 (1.0) 1.7 (1.5) 1.5 (1.0) 1.5 (1.0) 1.6 (1.2) 1.7 (1.0) 2.1 (0.9) 2.2 (1.2) Median (N ) 2.3(132) 2.8(105) 2.2(105) 1.5(95) 1.1(96) 1.2(83) 1.2(96) 1.2(103) 1.4(105) 1.4(89) 1.9(101) 1.9(98)
%6RONO2 9 11 9 8 7 8 8 8 9 9 9 9
2-PenONO2
Mean (SD) 2.8 (1.3) 3.0 (1.3) 3.0 (1.7) 1.9 (1.0) 1.5 (1.1) 2.1 (1.8) 1.6 (1.1) 1.7 (1.2) 1.9 (1.4) 1.8 (1.2) 2.5 (1.2) 2.6 (1.5) Median (N ) 2.6(132) 3.0(106) 2.6(104) 1.7(95) 1.3(96) 1.4(83) 1.3(95) 1.5(103) 1.5(106) 1.4(89) 2.2(101) 2.3(98)
%6RONO2 11 12 10 8 8 10 8 11 10 9 10 11
6RONO2
Mean (SD) 25.1 (7.6) 26.8 (7.3) 28.2 (10.0) 22.0 (6.5) 17.3 (7.2) 18.0 (11.7) 17.6 (9.4) 16.2 (8.7) 17.6 (10.5) 19.1 (8.9) 23.2 (7.8) 24.1 (9.4) Median (N ) 23.3(134) 25.1(109) 24.2(108) 20.5(95) 15.2(105) 13.6(101) 16.2(98) 14.3(107) 15.3(111) 15.5(92) 20.7(102) 21.5(101)
%NOy 0.6 0.8 1.0 0.9 0.7 0.6 0.6 0.6 0.7 0.6 0.5 0.5
calm winds and a stable inversion layer is indicative of a process besides advection or vertical mixing of different air masses (Sect. 3.2.1). Additionally, it is typically thought that alkyl nitrates do not undergo wet and dry deposition because of their low solubility (e.g., Roberts, 1990, Shepson et al., 1996). However, wet deposition of alkyl nitrates has been reported in some studies (e.g., Hauff et al., 1998). More-over, the Henry’s Law constant of MeONO2(2.0 M/atm) is
similar to peroxyacyl nitrates (PANs) (1–5 M/atm) (Kames and Schurath, 1992; Sander, 1999). Several factors, includ-ing surface wetness, contribute to the surface deposition of PANs (Schrimpf et al., 1996; Sparks et al., 2003; Doskey et al., 2004; Turnipseed et al., 2006). Therefore, it seems likely that surface deposition contributed to the MeONO2 diurnal
behavior at TF.
3.2.1 Evidence for MeONO2dry deposition
Two criteria were used to identify the nights when a stable NBL formed: (1) O3≤5 ppbv and (2) wind speed<0.5 m/s.
During summer 2002, there were only 4 nights when con-current measurements of alkyl nitrates, O3, and wind speed
were available and the atmospheric conditions met these cri-teria. For example, on the evenings of 7 and 13 June 2002, O3decreased to≤3 ppbv and the wind speed was near zero
(Fig. 5). Both chemistry and surface deposition contribute to the nocturnal removal of O3 at TF (Talbot et al., 2005).
On both nights, MeONO2 tracked O3 suggesting a
simi-lar removal mechanism for both compounds. As discussed above, chemistry is an unlikely explanation for the decreas-ing MeONO2 which points toward deposition as the cause
of the MeONO2removal. Ozone and wind speed remained
Fig. 4.Hourly average (local time) O3(ppbv), wind speed (m/s),JNO2(yellow shaded curve), and MeONO2(±standard error) (pptv) using all data during (a) 1 June to 31 August 2002 and (b) 1 July to 15 August 2004 at Thompson Farm.
Fig. 5.Time series of(a)MeONO2(pptv), O3(ppbv) and wind speed (m/s) and(b)CO (ppbv), propane (pptv) and NOy(ppbv) at Thompson Farm during 6–16 June 2002. Shaded regions are the nights of 8 and 14 June.
2008) (Fig. 5b; propane is shown as a representative exam-ple of the NMHC behavior). Additionally, NOy decreased
(Fig. 5b) mainly because of wet and dry deposition of HNO3
and NO2(e.g., Munger et al., 1998). The slightly different
NOy trend on both nights is likely a combination of
depo-sition and different air mass source regions. On 7–8 June, the wind direction shifted from easterly to southwesterly, whereas the wind was from the south-southwest throughout the entire day on 13 June and continuing into 14 June.
Additionally, measurements made at TF during summer (1 July–15 August) 2004 are included to provide further ev-idence for the surface deposition of MeONO2. Similar to
2002, the hourly average MeONO2mixing ratios decreased
overnight, were lowest during the early morning hours, and increased throughout the morning following the dissipation of the NBL (Fig. 4b). Based on our criteria, a strong NBL developed on nearly half of the nights during summer 2004. On approximately 80% of these nights, MeONO2decreased
concurrently with O3 and wind speed (Fig. 6a, wind speed
not shown). In addition, decreasing NOymixing ratios were
observed on most of these nights. Non-depositing species, such as CO and NMHCs, exhibited the opposite trend with significantly increasing mixing ratios overnight and rapidly decreasing mixing ratios following dissipation of the NBL in the morning (Fig. 6b, propane and ethene are shown as representative examples of the CO and NMHC behavior).
It should be noted that our analysis is limited to MeONO2
because the C2-C5alkyl nitrates did not consistently exhibit
nighttime depletion under the stable NBL. Methyl nitrate is more soluble (Henry’s Law constant∼2.0 M/atm) than the C2-C5alkyl nitrates (0.34–1.6 M/atm) (Kames and Schurath,
1992; Sander, 1999). Therefore, the greater solubility of MeONO2 may explain the different behavior compared to
Fig. 6.Time series of(a)MeONO2(pptv), O3(ppbv), NOy(ppbv) and(b)ethene and propane (pptv) at Thompson Farm during 15 July to 11 August 2004. Shaded regions are nights with O3≤5 ppbv and wind speed<0.5 m/s indicating that a strong and stable inversion layer had developed.
Table 3.Mean dry deposition flux±standard deviation (SD) (nmol m−2hr−1)and velocity±SD (Vd)(cm s−1)of MeONO2. The range of dry deposition rates and velocities calculated for each night during summers 2002 and 2004 when a stable nocturnal boundary layer developed using the criteria that O3≤5 ppbv and wind speed<0.5 m/s are shown in parentheses. Fluxes were calculated from the linear regression between the change in MeONO2mixing ratios versus time (00:00 to 06:00, EDT=UTC–04:00). τd(=H /Vd)is the MeONO2 lifetime (days) resulting from dry deposition. N is the number of nights included in the calculations for each summer.
Flux±SD (Range) Vd±SD (Range) τd N
Summer 2002 −0.51±0.38 (−0.15 to−1.04) 0.13±0.07 (0.04–0.20) 0.7–3.3 4
Summer 2004 −0.47±0.32 (−0.17 to−1.2) 0.13±0.07 (0.05–0.30) 0.5–2.6 16
The diurnal variation of MeONO2at TF provides evidence
for a previously unaccounted for removal mechanism from the atmosphere and for a potential additional source of or-ganic nitrogen to the surface. For each night when a stable NBL developed, the flux from the atmosphere to the surface and the dry deposition velocity (Vd)of MeONO2was
esti-mated as follows: Flux=
dC
dt
·H= −C·Vd (1)
where C is the mean MeONO2 concentration (molecules
cm−3)between 00:00 to 06:00,H is the nocturnal boundary
layer height, and (dC/dt) is the change in MeONO2
con-centration between 0:00 to 06:00. In these calculations, we assume a constant boundary layer height (H) of 125 m be-cause it is a typical nocturnal boundary layer height for this site (e.g., Talbot et al., 2005; Sive et al., 2007; Mao et al., 2008; White et al., 2008; Zhou et al., 2005). However, it must be kept in mind that the resulting dry deposition flux and velocity estimates scale directly with the boundary layer
height which varies with meteorological conditions, time of day, and season (Talbot et al., 2005). The estimates of the dry deposition rate and velocity of MeONO2 were similar
during both summers and agree within the stated error bars suggesting that a relatively uniform amount of MeONO2
is lost from the atmosphere to the surface (Table 3). The mean dry deposition rate of MeONO2 was approximately
−0.5 nmol m−2hr−1(range 0.18 to 1.47 g N ha−1yr−1), and the dry deposition velocity was∼0.13 cm s−1(Table 3). To the best of our knowledge, these are the first estimates of the deposition rate and velocity of MeONO2. Furthermore,
the dry deposition lifetime (τd = H/Vd) of MeONO2 was
∼1−3 days (Table 3) which is shorter than the combined oxidation + photolysis lifetime (∼5 days). The total lifetime of MeONO2 resulting from deposition, oxidation, and
3.2.2 Comparison with previous organic nitrogen dry deposition research
The MeONO2dry deposition flux and velocity values at TF
are at the lower end of estimates compared to other organic nitrogen compounds at North American sites. For example, dry deposition velocities were estimated to be 0.65 cm s−1
for isoprene nitrates (Giacopelli et al., 2005), 0.4 cm s−1
for hydroxyalkyl nitrates (Shepson et al., 1996), and 0.1 to 0.6 cm s−1 for peroxyacetyl nitrate (PAN) (Shepson et al.,
1992; Schrimpf et al., 1996; Sparks et al., 2003; Doskey et al., 2004; Turnipseed et al., 2006; Wolfe et al., 2009). Addi-tionally, nighttimeVdvalues for peroxymethacryloyl nitrate
(MPAN) and peroxypropionyl nitrate (PPN) ranging from∼ 0.1 to 0.7 cm s−1with fluxes of−10 to−50 nmol m−2hr−1, as well as PAN fluxes that were an order of magnitude larger (−140 to −260 nmol m−2hr−1), have been observed over pine forests (Turnipseed et al., 2006; Wolfe et al., 2009).
Previous studies in the eastern US and Canada have dis-cussed the potentially significant contribution from unmea-sured organic nitrogen compounds to nitrogen deposition. For example, research conducted at Harvard Forest (HF) (a temperate deciduous forest ∼110 km southwest of TF) concluded that the deposition of unmeasured organic nitro-gen compounds could explain discrepancies between total NOyand the sum of speciated NOycompound measurements
(Munger et al., 1996, 1998; Lefer et al., 1999; Horii et al., 2004, 2006). Additionally, studies conducted at several sites throughout Canada reported that “Other-NOy” compounds
(i.e., excluding HNO3, NO2, pNO−3, PAN, PPN) contributed
9–38% to NOydry deposition (Zhang et al., 2009).
Further-more, measurements made at Duke Forest in North Carolina concluded that total dry nitrogen deposition (not including organic nitrate compounds) was potentially significantly un-derestimated (Sparks et al., 2008). Based on the total dry ni-trogen deposition in eastern Canada (0.5–2.4 kg N ha−1yr−1; Zhang et al., 2009) and at Duke Forest (7.9 kg N ha−1yr−1; Sparks et al., 2008), as well as the MeONO2 deposition
rates estimated in this work, MeONO2contributes<1% to
the total N deposition. These results suggest that MeONO2
constitutes a minor component of total N dry deposition. Nonetheless, our results provide supporting evidence that un-accounted for organic nitrogen compounds contribute to ni-trogen dry deposition, and these compounds should be in-cluded in studies on the nitrogen budget in various ecosys-tems.
4 Sources of alkyl nitrates in coastal New England
The following discussion uses a combination of four separate VOC data sets, which are representative of three different en-vironments, in order to identify the major source(s) of alkyl nitrates in southeastern New Hampshire by comparing their temporal and/or spatial distributions to characteristic source signatures and to NMHC and halocarbon trends.
4.1 Inland/coastal environment: Thompson Farm
The predominant source region and regional transport path-way of air masses to TF varies with season as discussed in Sect. 3.1. In order to determine whether the alkyl nitrate mixing ratios observed at TF depend upon the source re-gion, the hourly average wind direction data from winter and summer 2002 was separated into four sectors (northeast (0– 90◦), southeast (90–180◦), southwest (180–270◦), and north-west (270–360◦). In winter, the6RONO2mixing ratio was
fairly uniform in the SW, NW, and NE sectors but was sig-nificantly higher (p <0.05) in the SE sector, while in sum-mer, the mean mixing ratio in both the SE and SW sectors was significantly higher (p <0.001) than in the northern sec-tors (Table 4). It is not unexpected that enhanced mixing ratios would be observed during transport from the SE. Pre-vious studies have shown that air masses that passed over east coast metropolitan areas and over the Atlantic Ocean can be transported inland to TF from the south-southeast by the sea breeze (Miller et al., 2003; Angevine et al., 2004; Mao and Talbot, 2004a; Zhou et al., 2008). Furthermore, in both seasons, the highest and lowest mean parent hydro-carbon (ethane, propane,n-butane,n-pentane) mixing ratios were observed in the southern and northern transport sectors, respectively (not shown). The high levels observed are con-sistent with the location of major urban and industrial regions to the west-southwest of New England. The sources of the precursor hydrocarbons observed at TF include fuel evapora-tion, vehicle exhaust, and natural and liquefied petroleum gas usage and leakage (White et al., 2008; Russo et al., 2010). These results point toward a continental source of alkyl ni-trates which was most likely secondary production follow-ing hydrocarbon oxidation. Moreover, the highest mixfollow-ing ra-tios of alkyl nitrates corresponded to events with enhanced mixing ratios of NMHCs and carbon monoxide. For ex-ample, the highest C2-C5 alkyl nitrate mixing ratios
dur-ing winter 2002 were observed on 7 February under west-southwesterly winds (Fig. 2). Concurrent with the high alkyl nitrates were enhanced (above 90th percentile for winter) mixing ratios of CO (370–750 ppbv), ethane (4–7.2 ppbv), propane (5.7–11 ppbv),n-butane (1-3.7 ppbv), andn-pentane (0.3–0.5 ppbv).
The dominant and consistent contribution of 2-PrONO2
and 2-BuONO2 to6RONO2 at TF over various years and
time scales further corroborates that the major source of both alkyl nitrates was photochemical production from propane andn-butane, respectively (Tables 1 and 2). The C3-C4
alka-nes are among the most abundant NMHCs at TF (Russo et al., 2010). Both 2-PrONO2and 2-BuONO2have been found
Table 4. Mean (±standard deviation of the mean) mixing ratios of alkyl nitrates (pptv) in the northeast (NE, 0–90◦), southeast (SE, 90–180◦), southwest (SW, 180–270◦), and northwest (NW, 270–360◦) transport sectors during Winter and Summer 2002.
Winter Summer
NE SE SW NW NE SE SW NW
MeONO2 3.6±0.2 4.2±0.2 3.2±0.1 2.9±0.1 2.4±0.1 3.2±0.1 3.4±0.1 2.7±0.1
EtONO2 4.2±0.1 4.7±0.1 4.0±0.04 4.0±0.1 2.6±0.1 3.5±0.1 3.6±0.1 2.9±0.1
2-PrONO2 7.3±0.2 7.9±0.1 7.1±0.1 7.4±0.1 4.2±0.3 6.9±0.4 7.3±0.3 5.1±0.3
1-PrONO2 1.5±0.05 1.5±0.03 1.3±0.02 1.4±0.02 1.0±0.1 1.3±0.1 1.4±0.1 1.0±0.1
2-BuONO2 6.4±0.3 7.0±0.1 6.3±0.1 6.5±0.1 2.1±0.2 3.9±0.2 4.2±0.2 2.8±0.2
3-PenONO2 1.8±0.1 1.9±0.04 1.7±0.03 2.3±0.05 0.7±0.1 1.5±0.1 1.6±0.1 1.0±0.1
2-PenONO2 2.4±0.1 2.6±0.1 2.3±0.1 2.3±0.1 0.9±0.1 2.2±0.2 2.5±0.1 1.4±0.1
6RONO2 26.2±1.0 29.0±0.6 25.5±0.4 25.8±0.5 13.3±0.7 21.6±0.0 22.6±0.8 16.1±0.9
lifetimes of both the parent alkane and alkyl nitrate with in-creasing carbon number (Atkinson et al., 1982; Flocke et al., 1991; 1998; Arey et al., 2001) as well as the distribution of parent hydrocarbons in a specific region. In contrast, in remote oceanic regions, the C1-C3alkyl nitrates have been
found to be supersaturated in the surface ocean (Chuck et al., 2002; Dahl et al., 2005) and positively correlated with marine halocarbons (Atlas et al., 1993; Blake et al., 1999, 2003a). Additionally, oceanic emissions of MeONO2were
estimated to be a factor of∼3−4 larger than EtONO2 in
the Pacific (Blake et al., 2003a; Dahl et al., 2007) and At-lantic Oceans (Chuck et al., 2002). Although TF is often influenced by marine air masses originating from the SE and NE (Zhou et al., 2005, 2008), MeONO2 and EtONO2
were not correlated with marine halocarbons, and the year-round MeONO2/EtONO2ratio averaged∼1. This suggests
that the MeONO2 and EtONO2levels observed in seacoast
New Hampshire were controlled by anthropogenic precursor source(s).
Furthermore, the C3-C5 alkyl nitrates were strongly
cor-related with each other in both winter and summer 2002 (r2∼0.7−0.9), and in all seasons throughout 2004–2008 (r2∼0.60−0.96). Ethyl nitrate exhibited slightly weaker correlations with the C3-C5alkyl nitrates (r2∼0.4−0.8). In
winter, MeONO2was poorly correlated with the other alkyl
nitrates, whereas in summer 2002 and spring-fall 2004–2008, MeONO2 was moderately correlated with the C2-C5
com-pounds (r2∼0.3−0.6). The weaker MeONO2and EtONO2
correlations may be a consequence of their longer lifetimes or different sources. In addition, the C1-C5 alkyl nitrates
tracked each other extremely well (Figs. 2 and 3) reflecting their similar photochemical and/or collocated hydrocarbon precursor sources.
4.2 Marine environment: measurements aboard the NOAA R/V Ronald H. Brown
Measurements of MeONO2, 2-PrONO2, and 2-BuONO2
were made from ambient air and surface seawater samples collected onboard the NOAA R/V Ronald H. Brown during 30 July to 6 August 2002 as a component of the NEAQS 2002 campaign. Sampling occurred in Boston Harbor on 30– 31 July and off the coast of New Hampshire from 1–6 Au-gust. 2-Propyl and 2-butyl nitrate were well correlated in air (r2=0.97) and were positively, but weakly (r2∼0.34), correlated with MeONO2 indicating that the alkyl nitrates
shared a common source. In the air samples, MeONO2,
2-PrONO2, and 2-BuONO2 ranged from 2–8, 4–30, and 2–
16 pptv, respectively (Figs. 7a, c; 2-BuONO2not shown). In
contrast, 2-PrONO2and 2-BuONO2mixing ratios in the
sur-face seawater were lower and more uniform (∼9−13 pptv, 0.008–0.017 nmol L−1and 2–5 pptv, 0.002–0.006 nmol L−1, respectively) (Fig. 7d). Methyl nitrate was more variable in the seawater but exhibited a similar range of mixing ratios (∼1−6 pptv, 0.007–0.051 nmol L−1)as in the air samples (Fig. 7b). The saturation anomalies ((seawater concentration – air concentration/air concentration) * 100%) of MeONO2,
2-PrONO2, and 2-BuONO2 ranged between±150%. The
MeONO2(pptv)
a. b.
c. d.
2-PrONO2(pptv)
42.0oN
41.0oN
43.0oN
70.0oW 69.0oW
71.0oW
70.0oW 69.0oW
71.0oW
70.0oW 69.0oW
71.0oW
70.0oW 69.0oW
71.0oW
42.0oN
41.0oN
43.0oN
42.0oN
41.0oN
43.0oN
42.0oN
41.0oN
43.0oN
9 8 7 6 5 4 3 2 1 30 25 20 15 10 5 Boston, MA Durham, NH
MeONO2(pptv)
a. b.
c. d.
2-PrONO2(pptv)
42.0oN
41.0oN
43.0oN
70.0oW 69.0oW
71.0oW
70.0oW 69.0oW
71.0oW
70.0oW 69.0oW
71.0oW
70.0oW 69.0oW
71.0oW
42.0oN
41.0oN
43.0oN
42.0oN
41.0oN
43.0oN
42.0oN
41.0oN
43.0oN
9 8 7 6 5 4 3 2 1 30 25 20 15 10 5 Boston, MA Durham, NH
Fig. 7.Air and surface seawater samples (pptv) collected in the Gulf of Maine onboard the NOAA Ship Ronald H. Brown during NEAQS 2002 throughout 30 July–6 August 2002:(a)ambient air and(b)surface seawater mixing ratios of MeONO2;(c)ambient air and(d)surface seawater mixing ratios of 2-PrONO2.
4.3 Estuarine environment: Great Bay experiment
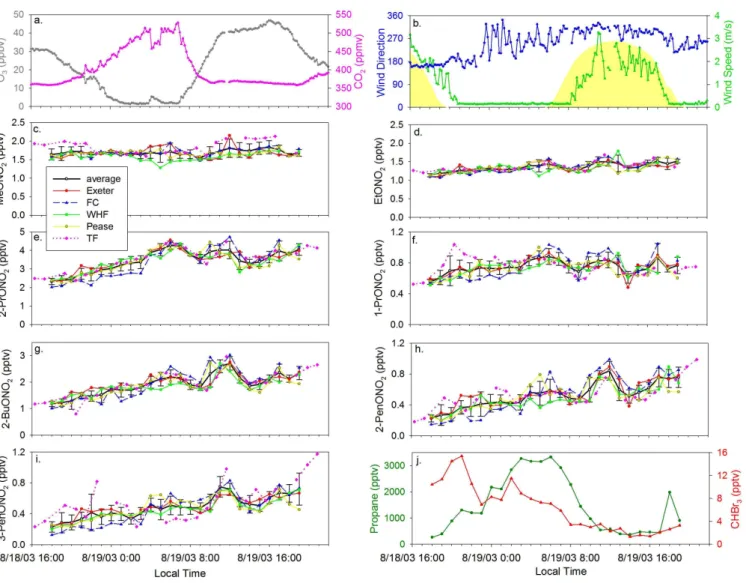
An intensive study focused on examining the spatial vari-ability and sources of VOCs throughout the Great Bay es-tuary in seacoast New Hampshire was conducted from 18:00 18 August to 19:00 19 August 2003 (local time) (Fig. 1 in-set). At TF, winds were from the south-southeast from noon on 18 August until early morning on 19 August when they shifted to the west-northwest (Fig. 8b). Three day back tra-jectories obtained from the NOAA HYSPLIT model (Draxler and Rolph, 2003) showed that air masses originated in east-ern Canada and traveled along the Maine coastline before reaching NH from the east on the evening of 18 August. Fur-thermore, a strong nocturnal inversion layer developed be-tween midnight and 07:00 on 19 August as demonstrated by decreases in O3and wind speed and by an increase in carbon
dioxide (Figs. 8a, b).
The mixing ratios of each alkyl nitrate were remarkably uniform across the five sampling locations (Fig. 8c–i). The standard deviation of the mixing ratios at all five sites each hour was≤0.2 pptv for MeONO2, EtONO2, 1-PrONO2,
2-PenONO2, and 3-PenONO2 and≤0.5 pptv for 2-PrONO2
and 2-BuONO2. The lack of a spatial variation in mixing
ratios and a correlation with marine derived compounds
sug-gests that the source(s) of the alkyl nitrates was not associ-ated with coastal emissions. In contrast, the marine halo-carbons (bromoform (CHBr3), dibromomethane (CH2Br2),
methyl iodide (CH3I), and ethyl iodide (C2H5I)) exhibited a
distinct spatial variation with higher mixing ratios at coastal sites (FC, WHF) compared to inland sites (TF, Pease, Ex-eter) (Zhou et al., 2005). For example, the elevated mix-ing ratios of CHBr3(>10 pptv) reflect the influence of local
Fig. 8. (a)10 min. average O3(ppbv) and CO2(ppmv) mixing ratios and(b)wind speed (m/s), wind direction, andJNO2 (yellow shaded
curve) at Thompson Farm from 18 August at 16:00 to 19 August 2003 at 22:00 (local time). Alkyl nitrate mixing ratios (pptv) at four sites throughout the Great Bay estuary and at Thompson Farm:(c)MeONO2,(d)EtONO2,(e)2-PrONO2,(f)1-PrONO2,(g)2-BuONO2,(h) 2-PenONO2,(i)3-PenONO2, and(j)hourly average propane and CHBr3mixing ratios (pptv) for the five sampling sites. (c–i) The black line is the average±standard deviation mixing ratio of all 5 sites each hour.
5 Alkyl nitrate/parent hydrocarbon relationships
In the previous section, the analysis of four distinct data sets indicated that the dominant source of alkyl nitrates in the seacoast region of New Hampshire was photochemical pro-duction from hydrocarbons. Accordingly, the relationships with the parent hydrocarbons were further examined using a sequential reaction scheme. The production and loss re-actions of alkyl nitrates summarized in Rere-actions (R1–R6) can be simplified as follows by assuming that Reaction (R1) between the parent hydrocarbon and OH is the rate-limiting step and that reaction with NO is the main reaction pathway for RO2radicals (R3 and R4) (i.e., no peroxy radical self
re-actions):
RH−→kA RONO2 kB
−→products (R7)
The simplified kinetic equations lead to a differential equa-tion, whose solution is a function only of time, and can thus be integrated to yield (Eq. 2) (see Bertman et al., 1995 for details on the derivation of Eq. 2):
(RONO2) (RH) =
βkA (kB−kA)
(1−e(kA−kB)t) +(RONO2)o
(RH)o
e(kA−kB)t (2)
where kA =k1[OH], kB=k6 [OH] + J5, β=α1α4, and
(RONO2)o/(RH)ois the initial alkyl nitrate/parent
improve agreement between the observations and the pre-dicted RONO2/RH trend. It is worth noting that the mean
NO mixing ratios at TF were 2.5 and 0.35 ppbv in winter and summer 2002, respectively. These mixing ratios are suffi-cient (∼0.04−0.1 ppbv) for reaction with NO to be the dom-inant reaction pathway for RO2radicals (e.g., Flocke et al.,
1991; Roberts et al., 1998). Thus, we assume that the RO2
+ NO reaction is dominant at TF. If (RONO2)o/(RH)o=0, the
solution to Eq. (2) describes the time evolution of the alkyl nitrate/parent hydrocarbon (RONO2/RH) ratio based solely
on gas phase hydrocarbon chemistry (Bertman et al., 1995). Previous studies typically assumed that the initial alkyl ni-trate mixing ratio is zero (Bertman et al., 1995; Roberts et al., 1998; Stroud et al., 2001; Simpson et al., 2003), while more recent studies included analyses using non-zero initial ratios (Reeves et al., 2007). Some studies have also attempted to quantify the influence of additional hydrocarbon precursors (e.g., Sommariva et al., 2008).
In order to examine the relationships between alkyl ni-trates and their parent hydrocarbons, we compared the ob-served RONO2/RH ratios to the values calculated when the
initial (RONO2)o/(RH)oratio equaled zero (pure
photochem-istry curve), the mean, and the background (10th percentile) ratio values at TF during winter and summer 2002 (Fig. 9, Table 5). Also included in Fig. 9 are the mean RONO2/RH
ratios from samples collected at several remote sites along the US west coast (34–47◦N) during December 2001 and June 2002 (unpublished data, D. Blake, UCI). These sam-ples are representative of background air masses and gener-ally agree with the highest TF RONO2/RH ratios (i.e., more
aged air masses) in winter. The lower summer ratios at TF, compared to the west coast, likely reflect the influence of more recent emissions and higher parent hydrocarbon mix-ing ratios because of the closer proximity to anthropogenic sources. In fact, the samples collected on nights with a stable NBL, and thus representing local NMHC emissions and low RONO2/RH ratios, largely correspond to the points on the
lower left of the plots at the most recent processing times. In both winter and summer, air mass ages ranging from several hours to 5 days were observed at TF.
In both seasons, the EtONO2/ethane ratios were factors
of∼5-10 above the pure photochemistry curve (Fig. 9a, b). The trend toward the curve at the longest processing times is indicative of mixing with aged air masses containing lower ratios. Previous studies also observed large deviations of pre-dicted EtONO2/ethane ratios from the ambient ones
(Bert-man et al., 1995; Roberts et al., 1998; Simpson et al., 2003). The deviation has typically been interpreted as evidence of a primary source of EtONO2 or of an additional source of
the precursor ethyl peroxy radical from the decomposition of larger organic compounds, specifically alkoxy radicals (Bert-man et al., 1995; Flocke et al., 1998). Interestingly, the mean and background initial ratio curves agreed with the TF ob-servations very well in both the winter and summer over the entire range of measured ratios (Fig. 9a, b). Thus, the
devia-tion from the zero initial ratio curve may reflect background EtONO2/ethane ratios in the atmosphere because of the
suf-ficiently long lifetimes of EtONO2 and ethane (∼1 month
and several months, respectively, in winter and∼1 week and 1–2 months, respectively, in summer). Bertman et al. (1995) and Reeves et al. (2007) also found better agreement between observed and predicted EtONO2/ethane ratios at short
pro-cessing times when an initial ratio was used. It should be noted that these results do not rule out a potential contribu-tion from direct emissions or addicontribu-tional precursor sources of EtONO2. Rather, these results provide an additional
expla-nation for the discrepancy between observed and predicted ratios.
The 2-PrONO2/propane and 1-PrONO2/propane ratios
were factors of 2–3 higher than the pure photochemistry curve at the shortest processing times in winter and trended toward the curve at longer times (Fig. 9c, e). In contrast, in summer, the propyl nitrate/propane ratios were factors of 0.5–0.9 above the pure photochemistry curve at all air mass ages (Fig. 9d, f). The small offsets above the curve at TF were much lower than observed by other studies conducted in North America (Bertman et al., 1995; Roberts et al., 1998; Stroud et al., 2001). The close agreement between the mea-sured and predicted ratios and the similar behavior exhib-ited by both propyl nitrate/propane ratios indicates that 1-PrONO2and 2-PrONO2share a similar production
mecha-nism following the oxidation of propane. This is in contrast to observations over the Atlantic Ocean (Reeves et al., 2007) and at Chebogue Point, Nova Scotia (Roberts et al., 1998) where the 2-PrONO2/propane and 1-PrONO2/propane ratios
displayed different behavior which was attributed to the in-fluence of different precursor compounds. Furthermore, the lifetimes of propane (weeks–months), 2-PrONO2, and
1-PrONO2(days–weeks) are sufficiently long to sustain
back-ground propyl nitrate/propane ratios which may contribute to the deviations between ambient and predicted ratios. Over-all, a significant amount of the data (∼70−90 %) in both seasons falls between the mean, background, and zero initial ratio curves further suggesting that precursor sources other than propane do not contribute to the propyl nitrate distribu-tion observed at TF. Addidistribu-tionally, in Fig. 9a–f, the initial 2-BuONO2/n-butane ratio was equal to its background values
(Table 5) in order to highlight how well the predicted C2-C3
RONO2/RH ratio curves encompass the observations.
Table 5.Values used in Eq. (2) to produce the predicted photochemical evolution curves in Fig. 9.k1(10−12)andk6(10−13)are the rate constants (cm3molecule−1s−1)for the reactions between the parent hydrocarbon (R1) and alkyl nitrate (R6) with OH, respectively. α1 andα4are the branching ratios of Reaction (R1) and Reaction (R4) producing the alkyl peroxy radical and alkyl nitrate, respectively. J5 (10−6s−1)is the alkyl nitrate photolysis rate constant. (RONO2)o/(RH)ois the initial alkyl nitrate/parent hydrocarbon ratio used in Eq. (2) and is equal to the seasonal mean (seasonal background) ambient ratios at TF. In Figs. 9a–f, (2-BuONO2)o/(n-butane)o=seasonal background ratio. In Fig. 9g–j, (2-BuONO2)o/(n-butane)o=seasonal mean ratio.
J5 (RONO2)o/(RH)o
k1a,f αb1 α4 ka6,g Winter Summer Winter Summer
EtONO2 0.24 1 0.006c,d 1.8 0.33h 1.5h 0.002 (0.001) 0.003 (0.002)
2-PrONO2 1.1 0.7 0.039d 2.9 0.43h 1.6h 0.004 (0.002) 0.012 (0.002)
1-PrONO2 1.1 0.3 0.02e 5.8 0.58h 2.2h 0.0004 (0.0002) 0.003 (0.0004)
2-BuONO2 2.3 0.86 0.084d 8.6 0.48i 1.1j,k 0.013 (0.005) 0.039 (0.01)
3-PenONO2 3.8 0.35 0.126d 11 0.47i 1.2j,k 0.008 (0.004) 0.016 (0.003)
2-PenONO2 3.8 0.55 0.106d 19 0.45i 1.2j,k 0.011 (0.006) 0.023 (0.003)
[OH]=6×10⁵(winter) and 2×10⁶(summer) molecules cm−3(Spivakovsky et al., 2000). aAtkinson et al. (2006);bKwok and Atkinson (1995);cRanschaert et al. (2000);
dArey et al. (2001);eAtkinson et al. (1987);fAtkinson (2003); gAtkinson (1990);hClemitshaw et al. (1997);iSimpson et al. (2003); jRoberts (1990);kBertman et al. (1995).
zero initial ratio curves, especially in summer, suggesting that photochemical production fromn-pentane was the main source of both 2- and 3-PenONO2. In contrast to the C2
-C3RONO2/RH ratios, the mean initial ratio curves
overes-timated the observations in both seasons (not shown). For this case, plotting the mean initial 2-BuONO2/n-butane
ra-tio with the background pentyl nitrate/n-pentane ratios re-sulted in better agreement with the observations (pink lines in Fig. 9g–j). This result is likely because the C5compounds
(n-pentane and pentyl nitrates) have shorter lifetimes and lower mean and background mixing ratios than forn-butane and 2-BuONO2(Tables 1, 2, 5).
6 Summary
Measurements of C1-C5 alkyl nitrates made at various
lo-cations throughout seacoast New Hampshire and spanning several years (2002–2008) were presented. The total C1
-C5 alkyl nitrate mixing ratio was generally∼20−30 pptv
and constituted only a small component (≤1%) of ambient NOy at TF. This suggests that the C1-C5 alkyl nitrates are
not likely to have a significant influence on the local O3 or
NOy budget. However, owing to the high mixing ratios of
precursor compounds (NOx and NMHCs) emitted from the
urban northeast US corridor, production of alkyl nitrates dur-ing trans-Atlantic transport is likely to occur and has been observed (e.g., Reeves et al., 2007). This may ultimately in-fluence the NOxand O3distributions of downwind regions,
such as Europe, making it necessary to accurately quantify the distributions of precursors and secondary species origi-nating in the northeastern US. Furthermore, the observation
of surface loss of MeONO2 provides evidence that
unac-counted for reactive nitrogen compounds contribute to NOy
deposition.
Acknowledgements. We would like to thank Marguerite L. White, Jesse L. Ambrose, and Leanna Conway for assistance with canister analysis; M. L. White for help with figure preparation; Lissa C. M. Ducharme for chromatogram integration; and Donald Blake (UCI) for providing unpublished data. Financial support for our work was provided to AIRMAP through the Office of Oceanic and Atmospheric Research at the National Oceanic and Atmospheric Administration.
Edited by: J. B. Burkholder
References
Angevine, W. M., Senff, C. J., White, A. B., Williams, E. J., Koer-mer, J., Miller, S. T. K., Talbot, R., Johnston, P. E., McKeen, S. A., and Downs, T.: Coastal boundary layer influence on pollutant transport in New England, J. Appl. Meteorol., 43, 1425–1437, 2004.
Arey, J., Aschmann, S. M., Kwok, E. S. C., and Atkinson, R.: Alkyl nitrate, hydroxyalkyl nitrate, and hydroxycarbonyl forma-tion from the NOx-air photooxidations of C5-C8 n-alkanes, J. Phys. Chem. A, 105, 1020–1027, 2001.
Atkinson, R., Aschmann, S. M., Carter, W. P. L., Winer, A. M., and Pitts, J. N.: Alkyl nitrate formation from the NOx-air photoox-idations of C2-C8 n-alkanes, J. Phys. Chem., 86, 4563–4569, 1982.
Atkinson, R.: Gas-phase tropospheric chemistry of organic com-pounds – A review, Atmos. Environ., 24, 1–41, 1990.
Atkinson, R.: Kinetics of the gas-phase reactions of OH radicals with alkanes and cycloalkanes, Atmos. Chem. Phys., 3, 2233– 2307, 2003,
http://www.atmos-chem-phys.net/3/2233/2003/.
Atkinson, R., Baulch, D. L., Cox, R. A., Crowley, J. N., Hampson, R. F., Hynes, R. G., Jenkin, M. E., Rossi, M. J., Troe, J., and IUPAC Subcommittee, : Evaluated kinetic and photochemical data for atmospheric chemistry: Volume II - gas phase reactions of organic species, Atmos. Chem. Phys., 6, 3625–4055, 2006, http://www.atmos-chem-phys.net/6/3625/2006/.
Atlas, E., Pollock, W., Greenberg, J., Heidt, L., and Thompson, A. M.: Alkyl nitrates, nonmethane hydrocarbons, and halocarbon gases over the equatorial Pacific ocean during SAGA-3, J. Geo-phys. Res., 98, 16933–16947, 1993.
Becker, K. H. and Wirtz, K.: Gas-phase reactions of alkyl nitrates with hydroxyl radicals under tropospheric conditions in compar-ison with photolysis, J. Atmos. Chem., 9, 419–433, 1989. Bertman, S. B., Roberts, J. M., Parrish, D. D., Buhr, M. P., Goldan,
P. D., Kuster, W. C., Fehsenfeld, F. C., Montzka, S. A., and West-berg, H.: Evolution of alkyl nitrates with air-mass age, J. Geo-phys. Res., 100, 22805–22813, 1995.
Blake, N. J., Blake, D. R., Wingenter, O. W., Sive, B. C., Kang, C. H., Thornton, D. C., Bandy, A. R., Atlas, E., Flocke, F., Harris, J. M., Rowland, F. S.: Aircraft measurements of the latitudinal, ver-tical, and seasonal variations of NMHCs, methyl nitrate, methyl halides, and DMS during the First Aerosol Characterization Ex-periment (ACE 1), J. Geophys. Res., 104, 21803–21817, 1999. Blake, N. J., Blake, D. R., Swanson, A. L., Atlas, E., Flocke, F.,
and Rowland, F. S.: Latitudinal, vertical, and seasonal variations of C1-C4alkyl nitrates in the troposphere over the Pacific Ocean during PEM-Tropics A and B: Oceanic and continental sources, J. Geophys. Res., 108, 8242, doi:10.1029/2001jd001444, 2003a. Blake, N. J., Blake, D. R., Sive, B. C., Katzenstein, A. S., Meinardi, S., Wingenter, O. W., Atlas, E. L., Flocke, F., Ridley, B. A., and Rowland, F. S.: The seasonal evolution of NMHCs and light alkyl nitrates at middle to high northern latitudes during TOPSE, J. Geophys. Res., 108, 8359, doi:10.1029/2001jd001467, 2003b. Chuck, A. L., Turner, S. M., and Liss, P. S.: Direct evidence for a marine source of C1and C2alkyl nitrates, Science, 297, 1151– 1154, 2002.
Clemitshaw, K. C., Williams, J., Rattigan, O. V., Shallcross, D. E., Law, K. S., and Cox, R. A.: Gas-phase ultraviolet absorption cross-sections and atmospheric lifetimes of several C2-C5alkyl nitrates, J. Photoch. Photobio. A, 102, 117–126, 1997.
Cornell, S. E., Jickells, T. D., Cape, J. N., Rowland, A. P., and Duce, R. A.: Organic nitrogen deposition on land and coastal environments: a review of methods and data, Atmos. Environ., 37, 2173–2191, doi:10.1016/s1352-2310(03)00133-x, 2003. Dahl, E. E., Yvon-Lewis, S. A., and Saltzman, E. S.: Saturation
anomalies of alkyl nitrates in the tropical Pacific Ocean, Geo-phys. Res. Lett., 32, L20817, doi:10.1029/2005gl023896, 2005. Dahl, E. E., Yvon-Lewis, S. A., and Saltzman, E. S.: Alkyl nitrate
(C1-C3)depth profiles in the tropical Pacific Ocean, J. Geophys. Res., 112, C01012, doi:10.1029/2006jc003471, 2007.
Day, D. A., Dillon, M. B., Wooldridge, P. J., Thornton, J. A., Rosen, R. S., Wood, E. C., and Cohen, R. C.: On alkyl ni-trates, O3, and the “missing NOy”, J. Geophys. Res., 108,
doi:10.1029/2003JD003685, 2003.
Doskey, P. V., Kotamarthi, V. R., Fukui, Y., Cook, D. R., Breit-beil, F. W., and Wesely, M. L.: Air-surface exchange of peroxy-acetyl nitrate at a grassland site, J. Geophys. Res., 109, D10310, doi:10.1029/2004jd004533, 2004.
Draxler, R. R. and Rolph, G. D.: HYSPLIT (HYbrid Single-Particle Lagrangian Integrated Trajectory) Model, NOAA Air Resources Laboratory, Silver Spring, MD (available at: http: //www.arl.noaa.gov/ready/hysplit4.html), 2003.
Fischer, E. V., Talbot, R. W., Dibb, J. E., Moody, J. L., and Murray, G. L.: Summertime ozone at Mount Washington: Meteorological controls at the highest peak in the northeast, J. Geophys. Res., 109, D24303, doi:10.1029/2004jd004841, 2004.
Flocke, F., Volzthomas, A., and Kley, D.: Measurements of alkyl nitrates in rural and polluted air masses, Atmos. Environ., 25, 1951–1960, 1991.
Flocke, F., Volz-Thomas, A., Buers, H. J., Patz, W., Garthe, H. J., and Kley, D.: Long-term measurements of alkyl nitrates in south-ern Germany 1. General behavior and seasonal and diurnal vari-ation, J. Geophys. Res., 103, 5729–5746, 1998.
Giacopelli, P., Ford, K., Espada, C., and Shepson, P. B.: Com-parison of the measured and simulated isoprene nitrate distri-butions above a forest canopy, J. Geophys. Res., 110, D01304, doi:10.1029/2004jd005123, 2005.
Gusten, H., Heinrich, G., and Sprung, D.: Nocturnal depletion of ozone in the Upper Rhine Valley, Atmos. Environ., 32, 1195– 1202, 1998.
Hastie, D. R., Shepson, P. B., Sharma, S., and Schiff, H. I.: The influence of the nocturnal boundary layer on secondary trace species in the atmosphere at Dorset, Ontario, Atmos. Environ., 27, 533–541, 1993.
Hauff, K., Fischer, R. G., and Ballschmiter, K.: Determination of C1-C5 alkyl nitrates in rain, snow, white frost, lake, and tap water by a combined codistillation head-space gas chromatogra-phy technique, Determination of Henry’s law constants by head-space GC, Chemosphere, 37, 2599–2615, 1998.
Horii, C. V., Munger, J. W., Wofsy, S. C., Zahniser, M., Nel-son, D., and McManus, J. B.: Fluxes of nitrogen oxides over a temperate deciduous forest, J. Geophys. Res., 109, D08305, doi:10.1029/2003jd004326, 2004.
Horii, C. V., Munger, J. W., Wofsy, S. C., Zahniser, M., Nelson, D., and McManus, J. B.: Atmospheric reactive nitrogen concentra-tion and flux budgets at a Northeastern US forest site, Agr. Forest. Meteorol., 136, 159–174, doi:10.1016/j.agrformet.2006.03.005, 2006.
Kames, J. and Schurath, U.: Alkyl nitrates and bifunctional nitrates of atmospheric interest- Henry Law constants and their tempera-ture dependencies, J. Atmos. Chem., 15, 79–95, 1992.
Kwok, E. S. C. and Atkinson, R.: Estimation of hydroxyl radical reaction rate constants for gas-phase organic compounds using a structure-reactivity relationship: An update, Atmos. Environ., 29, 1685–1695, 1995.
Lefer, B. L., Talbot, R. W., and Munger, J. W.: Nitric acid and ammonia at a rural northeastern US site, J. Geophys. Res., 104, 1645–1661, 1999.
Mao, H. T. and Talbot, R.: O3and CO in New England: Tempo-ral variations and relationships, J. Geophys. Res., 109, D21304, doi10.1029/2004jd004913, 2004a.
New England ozone episodes during summer 2001, J. Geophys. Res., 109, D20305, doi:10.1029/2004jd004850, 2004b. Mao, H., Talbot, R. W., Sigler, J. M., Sive, B. C., and Hegarty, J.
D.: Seasonal and diurnal variations of Hg◦over New England, Atmos. Chem. Phys., 8, 1403–1421, 2008,
http://www.atmos-chem-phys.net/8/1403/2008/.
Miller, S. T. K., Keim, B. D., Talbot, R. W., and Mao, H.: Sea breeze: Structure, forecasting, and impacts, Rev. Geophys., 41, 1011, doi:10.1029/2003rg000124, 2003.
Moody, J. L., Munger, J. W., Goldstein, A. H., Jacob, D. J., and Wofsy, S. C.: Harvard forest regional-scale air mass composition by Patterns in Atmospheric Transport History (PATH), J. Geo-phys. Res., 103, 13181–13194, 1998.
Moore, R. M. and Blough, N. V.: A marine source of methyl nitrate, Geophys. Res. Lett., 29, 1737, doi:10.1029/2002gl014989, 2002. Munger, J. W., Wofsy, S. C., Bakwin, P. S., Fan, S. M., Goulden, M. L., Daube, B. C., Goldstein, A. H., Moore, K. E., and Fitzjar-rald, D. R.: Atmospheric deposition of reactive nitrogen oxides and ozone in a temperate deciduous forest and a subarctic wood-land 1., Measurements and mechanisms, J. Geophys. Res., 101, 12639–12657, 1996.
Munger, J. W., Fan, S. M., Bakwin, P. S., Goulden, M. L., Goldstein, A. H., Colman, A. S., and Wofsy, S. C.: Regional budgets for nitrogen oxides from continental sources: Variations of rates for oxidation and deposition with season and distance from source regions, J. Geophys. Res., 103, 8355–8368, 1998.
Muthuramu, K., Shepson, P. B., Bottenheim, J. W., Jobson, B. T., Niki, H., and Anlauf, K. G.: Relationships between organic ni-trates and surface ozone destruction during Polar Sunrise Exper-iment 1992, J. Geophys. Res., 99, 25369–25378, 1994.
Neu, J. L., Lawler, M. J., Prather, M. J., and Saltzman, E. S.: Oceanic alkyl nitrates as a natural source of tropospheric ozone, Geophys. Res. Lett., 35, L13814, doi:10.1029/2008gl034189, 2008.
Nielsen, T., Egelov, A. H., Granby, K., and Skov, H.: Observations on particulate organic nitrates and unidentified components of NOy, Atmos. Environ., 29, 1757–1769, 1995.
Ostling, K., Kelly, B., Bird, S., Bertman, S., Pippin, M., Thornberry, T., and Carroll, M. A.: Fast-turnaround alkyl nitrate measure-ments during the PROPHET 1998 summer intensive, J. Geophys. Res., 106, 24439–24449, 2001.
Perring, A. E., Bertram, T. H., Wooldridge, P. J., Fried, A., Heikes, B. G., Dibb, J., Crounse, J. D., Wennberg, P. O., Blake, N. J., Blake, D. R., Brune, W. H., Singh, H. B., and Cohen, R. C.: Airborne observations of total RONO2: new constraints on the yield and lifetime of isoprene nitrates, Atmos. Chem. Phys., 9, 1451–1463, 2009,
http://www.atmos-chem-phys.net/9/1451/2009/.
Ranschaert, D. L., Schneider, N. J., and Elrod, M. J.: Kinetics of the C2H5O2+NOx reactions: Temperature dependence of the overall rate constant and the C2H5ONO2branching channel of C2H5O2+NO, J. Phys. Chem. A, 104, 5758–5765, 2000. Reeves, C. E., Slemr, J., Oram, D. E., Worton, D., Penkett, S. A.,
Stewart, D. J., Purvis, R., Watson, N., Hopkins, J., Lewis, A., Methven, J., Blake, D. R., and Atlas, E.: Alkyl nitrates in out-flow from North America over the North Atlantic during Inter-continental Transport of Ozone and Precursors 2004, J. Geophys. Res., 112, D10s37, doi:10.1029/2006jd007567, 2007.
Ridley, B. A., Shetter, J. D., Walega, J. G., Madronich, S., Elsworth,
C. M., Grahek, F. E., Fehsenfeld, F. C., Norton, R. B., Parrish, D. D., Hubler, G., Buhr, M., Williams, E. J., Allwine, E. J., and Westberg, H. H.: The behavior of some organic nitrates at Boul-der and Niwot Ridge, Colorado, J. Geophys. Res., 95, 13949– 13961, 1990.
Roberts, J. M.: The atmospheric chemistry of organic nitrates, At-mos. Environ., 24, 243–287, 1990.
Roberts, J. M., Bertman, S. B., Parrish, D. D., Fehsenfeld, F. C., Jobson, B. T., and Niki, H.: Measurement of alkyl nitrates at Chebogue Point, Nova Scotia during the 1993 North Atlantic Regional Experiment (NARE) intensive, J. Geophys. Res., 103, 13569–13580, 1998.
Russo, R. S., Zhou, Y., White, M. L., Mao, H., Talbot, R., and Sive, B. C.: Multi-year (2004-2008) record of nonmethane hydrocar-bons and halocarhydrocar-bons in New England: seasonal variations and regional sources, Atmos. Chem. Phys. Discuss., 10, 1083–1134, 2010,
http://www.atmos-chem-phys-discuss.net/10/1083/2010/. Sander, R.: Compilation of Henry’s law constants for inorganic
and organic species of potential importance in environmental chemistry, version 3, http://www.mpch-mainz.mpg.de/∼sander/
res/henry.html, 1999.
Schrimpf, W., Lienaerts, K., Muller, K. P., Rudolph, J., Neubert, R., Schussler, W., and Levin, I.: Dry deposition of peroxyacetyl nitrate (PAN): Determination of its deposition velocity at night from measurements of the atmospheric PAN and222Radon con-centration gradient, Geophys. Res. Lett., 23, 3599–3602, 1996. Shepson, P. B., Bottenheim, J. W., Hastie, D. R., and Venkatram,
A.: Determination of the relative ozone and PAN deposition ve-locities at night, Geophys. Res. Lett., 19, 1121–1124, 1992. Shepson, P. B., Anlauf, K. G., Bottenheim, J. W., Wiebe, H. A.,
Gao, N., Muthuramu, K., and Mackay, G. I.: Alkyl nitrates and their contribution to reactive nitrogen at a rural site in Ontario, Atmos. Environ., 27, 749–757, 1993.
Shepson, P. B., Mackay, E., and Muthuramu, K.: Henry’s law constants and removal processes for several atmospheric beta-hydroxy alkyl nitrates, Environ. Sci. Technol., 30, 3618–3623, 1996.
Shipham, M. C., Crill, P. M., Bartlett, K. B., Goldstein, A. H., Czepiel, P. M., Harriss, R. C., and Blaha, D.: Methane measure-ments in central New England: An assessment of regional trans-port from surrounding sources, J. Geophys. Res., 103, 21985– 22000, 1998.
Simpson, I. J., Meinardi, S., Blake, D. R., Blake, N. J., Row-land, F. S., Atlas, E., and Flocke, F.: A biomass burning source of C1-C4alkyl nitrates, Geophys. Res. Lett., 29, 2168, doi:10.1029/2002gl016290, 2002.
Simpson, I. J., Blake, N. J., Blake, D. R., Atlas, E., Flocke, F., Craw-ford, J. H., Fuelberg, H. E., Kiley, C. M., Meinardi, S., and Row-land, F. S.: Photochemical production and evolution of selected C2-C5alkyl nitrates in tropospheric air influenced by Asian out-flow, J. Geophys. Res., 108, 8808, doi:10.1029/2002jd002830, 2003.
Simpson, I. J., Wang, T., Guo, H., Kwok, Y. H., Flocke, F., Atlas, E., Meinardi, S., Rowland, F. S., and Blake, D. R.: Long-term atmospheric measurements of C1-C5alkyl nitrates in the pearl river delta region of southeast China, Atmos. Environ., 40, 1619– 1632, doi:10.1016/j.atmosenv.2005.10.062, 2006.