CONDITIONS ASSOCIATED WITH FOOD INSECURITY| 845
Rev. Nutr., Campinas, 29(6):845-857, nov./dez., 2016 Revista de Nutrição http://dx.doi.org/10.1590/1678-98652016000600009
1Universidade Estadual de Campinas, Faculdade de Ciências Médicas, Departamento de Saúde Coletiva. R. Tessália Vieira de Camargo, 126, Cidade Universitária Zeferino Vaz, Barão Geraldo, 13083-887, Campinas, SP, Brasil. Correspondência para/Correspondence to: BFNJ SOUZA. E-mail: <[email protected]>.
Support: Fundação de Amparo à Pesquisa do Estado de São Paulo (Process nº 09/53975-3).
ORIGINAL |
ORIGINAL
Demographic and socioeconomic
conditions associated with food
insecurity in households
in
Campinas,
SP, Brazil
Condições demográficas e socioeconômicas
associadas à insegurança
alimentar em domicílios
de Campinas, SP
Bruna Fernanda do Nascimento Jacinto de SOUZA1 Leticia MARIN-LEON1
Daniele Flaviane Mendes CAMARGO1 Ana Maria SEGALL-CORRÊA1
A B S T R A C T
Objective
To evaluate the association of food insecurity with demographic and socioeconomic conditions in households in Campinas, São Paulo state, Brazil.
Methods
846
|
BFNJ SOUZA et al.Rev. Nutr., Campinas, 29(6):845-857, nov./dez., 2016
Revista de Nutrição
http://dx.doi.org/10.1590/1678-98652016000600009
Results
In the 691 households analyzed, there was 65% of food security, 27.9% of mild food insecurity, and 7.1% of moderate/severe food insecurity. The conditions associated with mild food insecurity were monthly per capita income less than the minimum wage, household head unemployed for more than six months between 2004-2010, living in properties given to the family/occupied/other, and density higher than two people per bedroon. The moderate/severe food insecurity was associated with informal employment condition of the household head and the presence of a beneficiary of the Bolsa Família (Family Allowance Program), a cash transfer-type program, in the household. The higher the score of the consumer goods, the lower the probability of mild food insecurity or moderate/severe food insecurity. There was a higher probability of mild food insecurity and moderate/severe food insecurity in unfinished masonry-built houses/other.
Conclusion
More than one third of the households investigated experienced some form of food insecurity. Mild food insecurity was associated with demographic conditions, while moderate/severe food insecurity was associated with socioeconomic conditions, especially those related to the household head.
Keywords: Food and nutrition security. Health surveys. Social conditions; Socioeconomic factors.
R E S U M O
Objetivo
Avaliar a associação da insegurança alimentar com as condições demográficas e socioeconômicas em domicílios de Campinas (SP).
Métodos
Estudo transversal com amostra representativa da população urbana dos Distritos de Saúde Sul, Sudoeste e Noroeste de Campinas, realizado entre 2011-2012. Estudaram-se as características do chefe de família, dos antecedentes familiares e do domicílio. A variável dependente foi condição de segurança alimentar, categorizada em segurança alimentar, insegurança alimentar leve e insegurança alimentar moderada/grave. Todas as variáveis independentes com p-valor<0,20 na regressão logística multinomial bivariada foram incluídas no modelo final de regressão logística multinomial múltipla, ajustado pela idade do chefe da família, permanecendo aquelas com p<0,05.
Resultados
Nos 691 domicílios analisados, houve 65,0% em segurança alimentar, 27,9% em insegurança alimentar leve e 7,1% em insegurança alimentar moderada/grave. As condições associadas à insegurança alimentar leve foram renda familiar mensal per capita menor que um salário mínimo, desemprego do chefe da família por mais de seis meses entre 2004-2010, residir em domicílios de condição cedido/invasão/outro e com densidade maior que duas pessoas por dormitório. A insegurança alimentar moderada/grave esteve associada à informalidade do emprego do chefe da família e ter titular do Bolsa Família no domicílio. Quanto maior o escore de bens de consumo, menor foi a chance de insegurança alimentar leve ou moderada/grave, enquanto que houve maior chance da presença de qualquer tipo de insegurança alimentar nos domicílios construídos com alvenaria inacabada/outros.
Conclusão
Mais de um terço dos domicílios apresentamalguma forma de insegurança alimentar. A insegurança alimentar leve está associada às condições demográficas, enquanto que a moderada/grave associa-se às condições so-cioeconômicas, principalmente relacionadas ao chefe da família.
Palavras-chave: Segurança alimentar e nutricional. Inquéritos epidemiológicos. Condições sociais. Fatores
socioeconômicos.
I N T R O D U C T I O N
The rights to adequate food and to food and nutrition security have been recognized and
CONDITIONS ASSOCIATED WITH FOOD INSECURITY| 847
Rev. Nutr., Campinas, 29(6):845-857, nov./dez., 2016 Revista de Nutrição http://dx.doi.org/10.1590/1678-98652016000600009
environmental, cultural, economic, and social diversity and sustainability, without restricting the access to other essential needs1,2.
Food insecurity is inversely associated with socioeconomic status, and it has been investigated and monitored in developed and developing countries. In the United States, in 2014, 14.0% of the population lived in food-insecure households3, whereas in 2011/2012, in Mexico,
the prevalence of food insecurity was 69.8%4,
and in 2013, in Brazil,it was 22.6%5.
Despite global hunger reduction, about 805 million people are still chronically undernourished in the world. Therefore, hunger and poverty reduction remain as Sustainable Development Goals to be achieved by 20306,7.
The literature has reported various factors related to food insecurity, demonstrating that it is a complex phenomenon which is inter-related with structural features of society, labor market, and social and cultural aspects and lifestyle of families8-11. This justifies investigations, such as
the present study, on the living conditions in food insecure households, mainly when evaluated in terms of the extent to which each of these characteristics is associated with food insecurity and how they can contribute to the planning, execution, and monitoring of social, health, food, and nutrition policies aimed at food insecurity reduction.
Therefore, the aim of this study was to evaluate the association of food insecurity with demographic and socioeconomic conditions in the city of Campinas, São Paulo state, Brazil.
M E T H O D S
A cross-sectional study was carried out on the urban population residing in the Southern, Southwestern, and Northwestern Health Districts, known as Southern region, in the city of
Campinas, between April 2011 and September
2012. This region, with a population of 616,000 inhabitants (City Hall data based on the 2010
census), is home to those in the lowest socioeconomic status category in Campinas. Thus, since the likeability of identifying food insecure households is higher in low socioeconomic areas, due to budget constraint reasons, this study was restricted to this region.
The present study used some variables from a research that focused on identifying the association between food insecurity and chronic diseases in adults. We used the complete sample of the initial stage of that research, which investigated the characteristics of the head of the family, family history, and household. The algebraic expression for the estimation of proportions (Kish)12 was used to calculate the
number of households needed to estimate the prevalence of food insecurity (sample size).
2
)
/
(
)
1
(
z
d
P
P
n
o−
=
n=n ⋅deff0
Since P is the proportion to be estimated, the value of 0.50 was adopted based on data from a previous research13; z=1.96 is the value of
the standard normal distribution corresponding to the 95% confidence level used to determine the confidence interval; d=0.10 is the standard error of the sampling distribution. Applying these values, the initial sample size of 96 was determined. The design effect equal to 2.5 was used based on data of a previous study13. Thus,
the sample calculated was composed of 240 households per district, totaling 720 households in the three districts. Initially, ten sectors were randomly selected in each one of the three districts, and after compiling a list of all households in the region studied (6,349), a total of 2,814 households were randomly selected. In
order to replace households in which no one
848
|
BFNJ SOUZA et al.Rev. Nutr., Campinas, 29(6):845-857, nov./dez., 2016
Revista de Nutrição
http://dx.doi.org/10.1590/1678-98652016000600009
an answer to the outcome variable and were excluded from the study. Therefore, a total of 691 households were analyzed.
The household interviews were conducted by previously trained healthcare professionals under daily supervision. One occupant per household (≥18 years), who had knowledge of the family dynamics in terms of demographic and socioeconomic status and family nutrition, was interviewed.
The demographic variables regarding the characteristics of the head of the household were gender (male, female) and age (18-39, 40-59, 60 and over). The socioeconomic variables were: household head’s level of education (<4 years, ≥4 years and <8 years, ≥8 years); household head’s employment status (formally employed, informally employed/self-employed/casual worker, retired, pension holder/homemaker/student/other),
monthly household per capita income (≥1
minimum wage, <1 minimum wage, income not disclosed); the presence of a beneficiary of the
Bolsa Família (Family Allowance Program), a cash
transfer-type program (yes, no); and total sum of the scores of the presence of household goods and services according to the Critério de Clas-sificação Econômica Brasil - Associação Brasileira
de Empresas de Pesquisa (ABEP) 2008 (Criteria
of Economic Classification - Brazil, Associação
Bra-sileira de Empresas de Pesquisa 2008) (color TV,
radio, bathroom, car, computer, motorcycle, monthly maid service, washing machine, VCR and/or DVD, refrigerator, and freezer), with the score ranging from 0-38 since it did not include the level of education of the household head. The Criteria of Economic Classification - Brazil, As-sociação Brasileira de Empresas de Pesquisa 2008 has established five economic classes14, which are
grouped into A+B; C; D+E. Data about the unemployment of the head of the household for more than six months between 2004 and 2010 (no/did not work, yes) were also included.
The household characteristics evaluated were: property status (owned, rented, given to
the family/occupied), types of materials used for wall construction (finished masonry, unfinished masonry/poor quality material), type of sewage (public sewer; cesspit/no sewer system), and number of persons per bedroom (≤2, >2).
The dependent variable, food security, was measured using the Escala Brasileira de
Inse-gurança Alimentar (EBIA, Brazilian Household
Food Insecurity Measurement Scale), which is composed of 14 closed-ended questions that can be answered by a simple ‘yes’ or ‘no’15, referring to
the experiences of food insecurity in the last three months at several levels of severity. Considering that each affirmative answer corresponds to 1 point and that the scale ranges from 0 to 14 points, the scores are as follows: food security (0 points); mild food insecurity (1-5 points) in households with children under age 18 or (1-3 points) in households without minor children; and moderate insecurity (6-9) or (4-5) and severe insecurity (10-14) or (6-8 points) in households with or without minor children, respectively16.
Data were collected using Android (OS 2.1) mobile phones (smartphones). The data collected were synchronized by the field researcher weekly and were transferred to the database of the company responsible for programming the questionnaire. The database (dBase) files were converted into Stata (Stata Corporation, College Station, Texas, United States) version 9.0. Descriptive analysis was carried, absolute and relative frequency and chi-square values were calculated or a generalization of Fisher’s exact test was used, at 5% significance level, to assess the differences according to the three categories of food security/insecurity: security vs mild food insecurity vs moderate or severe food insecurity. The effect of each category of the independent variables on the two levels of food insecurity was estimated using odds ratio with 95% confidence interval, calculated by the bivariate multinomial logistics regression.
CONDITIONS ASSOCIATED WITH FOOD INSECURITY| 849
Rev. Nutr., Campinas, 29(6):845-857, nov./dez., 2016 Revista de Nutrição http://dx.doi.org/10.1590/1678-98652016000600009
variables, and Cramer’s V was used with the other variables to verify the need to create interaction variables if the pairs of variables had high correlation (p≥0.500).
Finally, the variables with p<0.20 in the bivariate multinomial logistics regression were included in the final model of multiple multinomial logistic regression; the remaining variables had p-value <0.05.
All participants were individually informed of the purpose of the present study and were interviewed after signing the written informed consent form. This study was approved by the Research Ethics Committee of the Faculdade Ciên-cias Médicas, Universidade Estadual de Campinas (School of Medical Sciences, University of Campi-nas), in December 2010 (CEP nº 1135/2010).
R E S U L T S
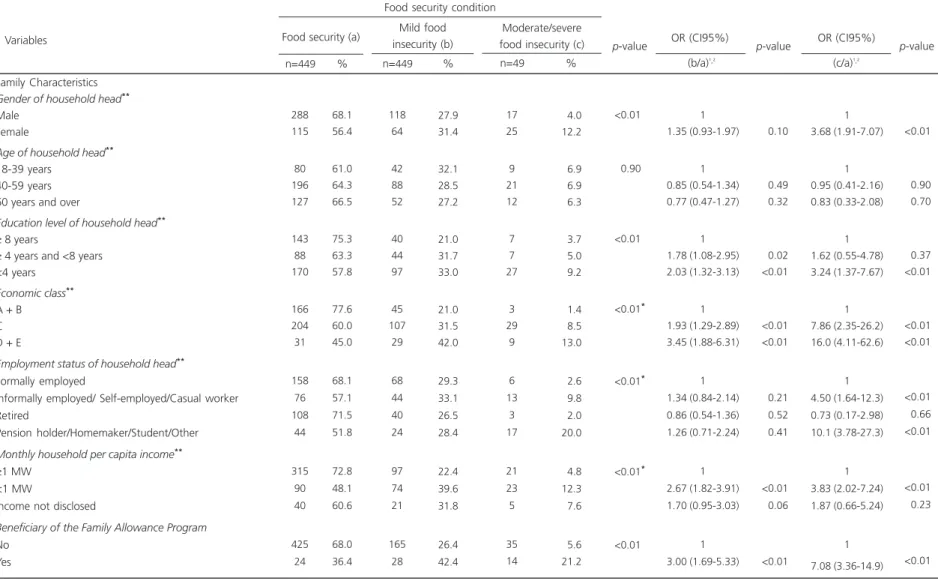
In the 691 households evaluated, the frequency of Food Security (FS) was 65.0%, whereas Mild Food Insecurity (MFI) and Moderate/ Severe Food Insecurity (MSFI) were 27.9% and 7.1%, respectively.
With regard to the characteristics of the household heads, it was found that 67.5% were male, 69.5% were aged 18-59 years (51.8±14.5), 47.2 % had less than four years of schooling, 38.6% were formally employed, and 21.7% were unemployed for more than six months between 2004 and 2010. Most families (54.6%) belonged to economy class C and had monthly per capita income greater than or equal to the minimum wage (63.1%). In addition, 9.6% were beneficiaries of the cash transfer-type program, and in 89,6% of the households there were up to two people per bedroom (1.51±0.73), 74.1% were owned properties, 70.9% were finished masonry-built houses, and 84.1% were connected to the public sewer system (Table 1). Statistical analyses showed that there were no strong correlations between the independent variables; therefore, there was no need to create interaction variables.
The bivariate multinomial regression showed higher probability of MFI in households whose head had less than 8 years of schooling, families of economic classes C and D+E, monthly
per capita income less than the minimum wage,
households with a beneficiary of the cash transfer--type program, those whose head was unemployed for more than six months between 2004-2010, properties that were given to the family/occupied/other, unfinished masonry-built houses, households with poor quality construction, and those not connected to the public sewer system (cesspit/no sewer system) and with more than two people per bedroom. In addition to all these variables, there was higher probability of MSFI in female-headed households and whose head was informally employed/self-employed or pension holder/homemaker/student/other (Table 2).
850
|
BFNJ SOUZA et al.Rev. Nutr., Campinas, 29(6):845-857, nov./dez., 2016
Revista de Nutrição
http://dx.doi.org/10.1590/1678-98652016000600009
Table 1. Characterization of the families and households investigated in terms of demographic, socioeconomic, and sanitary conditions.
Campinas (SP), Brazil, 2012.
Gender of household head*
Male Female
Age of household head*
18-39 years 40-59 years 60 years and over
Education level of household head*
≥8 years
≥4 years and <8 years <4 years
Economic class* A + B C D + E
Employment status of household head*
Formally employed
Informally employed/ Self-employed/Casual work* Retired
Pension holder/ Homemaker/ Student/Other
Monthly household per capita income*
≥1MW <1MW
Income not disclosed
Beneficiary of the Family Allowance Program No
Yes
Household head unemployed for more than six months between 2004-2010 No/did not work
Yes
Household characteristics Property status* Owned Rented
Given to the family/Occupied/Other Type of construction
Finished masonry
Unfinished masonry/poor quality construction Type of sewage
Public sewer
Cesspit/no sewer system
Number of people per bedroom*
Up to 2 >2
Family characteristics
423 204
131 305 191
190 139 294
214 340 69
232 133 151 85
433 187 66
625 66
541 150
511 92 87
490 201
581 110
609 71
67.5 32.5
20.9 48.6 30.5
30.5 22.3 47.2
34.3 54.6 11.1
38.6 22.1 25.1 14.1
63.1 27.3 09.6
90.4 09.6
78.3 21.7
74.1 13.3 12.6
70.9 29.1
84.1 15.9
89.6 10.4
% n=691
Note: *Due to missing values the total is less than 691.
CONDITIONS ASSOCIATED WITH FOOD INSECURITY
|
851
Rev
. Nutr
., Campinas, 29(6):845-857, nov
./dez., 2016
Revista
de
Nutrição
http://dx.doi.org/10.1590/1678-98652016000600009
Table 2. Bivariate multinomial logistic regression of the conditions associated with mild and moderate/severe food insecurity using Food Security as the category of reference. Campinas (SP), Brazil, 2012.
1 of 2
Food security condition
Family Characteristics
Gender of household head**
Male Female
Age of household head**
18-39 years 40-59 years 60 years and over
Education level of household head** ≥ 8 years
≥ 4 years and <8 years <4 years
Economic class**
A + B C D + E
Employment status of household head**
Formally employed
Informally employed/ Self-employed/Casual worker Retired
Pension holder/Homemaker/Student/Other
Monthly household per capita income** ≥1 MW
<1 MW
Income not disclosed
Beneficiary of the Family Allowance Program
No Yes Variables 288 115 80 196 127 143 88 170 166 204 31 158 76 108 44 315 90 40 425 24 68.1 56.4 61.0 64.3 66.5 75.3 63.3 57.8 77.6 60.0 45.0 68.1 57.1 71.5 51.8 72.8 48.1 60.6 68.0 36.4
n=449 %
Food security (a)
118 64 42 88 52 40 44 97 45 107 29 68 44 40 24 97 74 21 165 28
n=449 %
Mild food insecurity (b) 27.9 31.4 32.1 28.5 27.2 21.0 31.7 33.0 21.0 31.5 42.0 29.3 33.1 26.5 28.4 22.4 39.6 31.8 26.4 42.4 17 25 9 21 12 7 7 27 3 29 9 6 13 3 17 21 23 5 35 14 04.0 12.2 06.9 06.9 06.3 03.7 05.0 09.2 01.4 08.5 13.0 02.6 09.8 02.0 20.0 04.8 12.3 07.6 05.6 21.2
n=49 %
Moderate/severe food insecurity (c)
<0.01*
<0.90*
852
|
BFNJ SOUZA et al. Rev . Nutr., Campinas, 29(6):845-857, nov
./dez., 2016
Revista de Nutrição
http://dx.doi.org/10.1590/1678-98652016000600009
Table 2. Bivariate multinomial logistic regression of the conditions associated with mild and moderate/severe food insecurity using Food Security as the category of reference. Campinas (SP), Brazil, 2012.
2 of 2
Food security condition
Household head unemployed for more than six months between 2004-2010
No/did not work Yes
Household characteristics Property status**
Owned Rented
Given to the family/Occupied
Type of construction
Finished masonry
Unfinished masonry/poor quality construction
Type of sewage
Public sewer
Cesspit/no sewer system
Number of people per bedroom**
Up to 2 >2 Variables 379 70 361 54 33 365 84 401 48 413 29 70.1 46.7 70.6 58.7 37.9 74.5 41.8 69.1 43.6 67.8 40.8
n=449 %
Food security (a)
131 62 122 29 42 104 89 144 49 156 34
n=193 %
Mild food insecurity (b) 24.2 41.3 23.9 31.5 48.3 21.2 44.3 24.7 44.5 25.6 47.9 31 18 28 9 12 21 28 36 13 40 8 05.7 12.0 05.5 09.8 13.8 04.3 13.9 06.2 11.9 06.6 11.3
n=49 %
Moderate/severe food insecurity (c)
<0.01 <0.01 <0.01 <0.01 <0.01 p-value 1 2.56 (1.72-3.80) 1 1.58 (0.96-2.60) 3.76 (2.28-6.20) 1 3.71 (2.57-5.37) 1 2.84 (1.82-4.41) 1 3.10 (1.82-5.26) (b/a)¹,² OR (CI95%) <0.01 <0.07 <0.01 <0.01 <0.01 <0.01 p-value 1 3.14 (1.66-5.92) 1 2.14 (0.96-4.79) 4.68 (2.18-10.1) 1 5.79 (3.13-10.7) 1 3.01 (1.49-6.08) 1 2.84 (1.22-6.64) OR (CI95%) <0.01 <0.06 <0.01 <0.01 <0.01 <0.01 p-value (c/a)¹,²
Note: *Generalization of Fisher’s exact test. **Due to missing values the total is less than 449 to Food Security, 193 to Mild Food Insecurity, and 49 to Moderate/Severe food insecurity; ¹OR calculated by multinomial logistic
CONDITIONS ASSOCIATED WITH FOOD INSECURITY| 853
Rev. Nutr., Campinas, 29(6):845-857, nov./dez., 2016 Revista de Nutrição http://dx.doi.org/10.1590/1678-98652016000600009
D I S C U S S I O N
The identification, analysis, documenting, and recognition of factors associated with food and nutrition insecurity in Brazil are key objectives of the Política Nacional de Segurança Alimentar
e Nutricional (PNSAN, National Food and Nutrition
Insecurity Policy), which has the responsibility to defend and protect the human right to adequate food17.
Although Campinas is one of the richest cities in the country, the 2003 population survey data, conducted using the EBIA, showed that more than half of the entire population experienced some level of food insecurity13,
reflecting the great inequality of income distribution and access to food. In 2011-12 this value decreased to 35% for the population of the region with the lowest socioeconomic status, suggesting that the prevalence of food insecurity in the entire city can be even lower. Similarly, food insecurity reduction has been reported in Brazil since 2004 by the Pesquisa Nacional por Amostra
de Domicílios (PNAD, National Household Sample
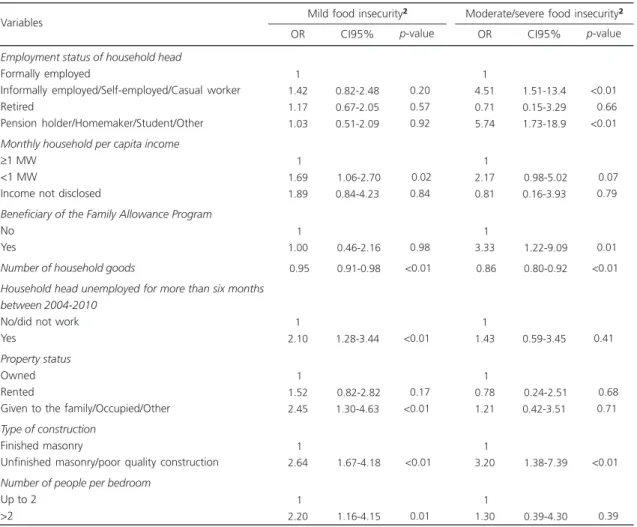
Survey). In 2013, there was a reduction in the three levels of Food Insecurity (FI), with prevalence of 14.8% of Mild FI, 4.6% of moderate FI, and 3.2% of severe FI5. Despite the considerable reduction in FI in Campinas, it is worth mentioning that the frequency of MFI was almost twice the Table 3. Final model of the multiple multinomial logistic regression of the conditions associated with mild and moderate/severe food
insecurity using Food Security as the category of reference. Campinas (SP), Brazil, 2012.
Employment status of household head Formally employed
Informally employed/Self-employed/Casual worker Retired
Pension holder/Homemaker/Student/Other Monthly household per capita income
≥1 MW <1 MW
Income not disclosed
Beneficiary of the Family Allowance Program No
Yes
Number of household goods
Household head unemployed for more than six months between 2004-2010
No/did not work Yes
Property status Owned Rented
Given to the family/Occupied/Other Type of construction
Finished masonry
Unfinished masonry/poor quality construction Number of people per bedroom
Up to 2 >2
Note: ¹OR calculated by multiple multinomial logistic regression; ²Category of reference: Food Security.
OR: Odds Ratio; CI: 95% Confidence Interval; MW: Minimum Wage.
Variables 1 1.42 1.17 1.03 1 1.69 1.89 1 1.00 0.95 1 2.10 1 1.52 2.45 1 2.64 1 2.20 0.82-2.48 0.67-2.05 0.51-2.09 1.06-2.70 0.84-4.23 0.46-2.16 0.91-0.98 1.28-3.44 0.82-2.82 1.30-4.63 1.67-4.18 1.16-4.15 OR CI95%
Mild food insecurity²
<0.20 <0.57 <0.92 <0.02 <0.84 <0.98 <0.01 <0.01 <0.17 <0.01 <0.01 <0.01 p-value 1 4.51 0.71 5.74 1 2.17 0.81 1 3.33 0.86 1 1.43 1 0.78 1.21 1 3.20 1 1.30 1.51-13.4 0.15-3.29 1.73-18.9 0.98-5.02 0.16-3.93 1.22-9.09 0.80-0.92 0.59-3.45 0.24-2.51 0.42-3.51 1.38-7.39 0.39-4.30 OR CI95%
Moderate/severe food insecurity²
854
|
BFNJ SOUZA et al.Rev. Nutr., Campinas, 29(6):845-857, nov./dez., 2016
Revista de Nutrição
http://dx.doi.org/10.1590/1678-98652016000600009
2013 national average; however, the MSFI was slightly lower than the national average (7.1% vs 7.8%).
The study sample is representative of the three districts with the lowest socioeconomic status in the city, which was home to 59.6% of the city when this research was carried out. Therefore, understanding the factors associated with FI can contribute to the development of new actions aimed at its reduction.
Although the level of education of the household head was not included in the final model of multiple multinomial regression, it was inversely associated with FI, which is consistent with the findings of other studies9,10. Level of
education is directly related to higher earnings18,19,
which in turn, can determine the consumption pattern of the population. Moreover, education is an important indicator of food security, not only due to its potential correlation with occupation and income, but also because it has a positive impact on how the household resources are managed20. This management is related to the
family’s ability to cope with deprivation, increasing the probability to overcome or reduce FI10.
The analysis of PNAD, 2004 data showed that low household per capita income was the most important determinant of food insecurity9,21.
Other studies have also shown this association3,8.
Using only PNAD, 2004 data from households that received cash transfer (CT), Segall-Corrêa et al.22,
showed that for every cash transfer of R$10.00, the chance of food security increased by approximately 8%. In the present study, lower
monthly household per capita income was
associated with MFI and MSFI, although the latter was not statistically significant at 95% confidence level. It is worth highlighting that income also determined various conditions that remained in the final model, as described below.
Municipal data show that there has been increased coverage of social cash transfer programs, especially from 2004 onwards with the creation of the cash transfer-type program (Bolsa
Família). In 2005, 11,314 families were assisted
by this program, and in 2012, there was an increase by 59.1%, i.e., 27,685 families were assisted, accounting for 7.9% of the city’s households23-24. Nevertheless, in the present study,
the households with beneficiaries of the program were three times more likely to experience MSFI, which suggests that, on the one hand, the program is meeting the basic needs of the target population, socially vulnerable people and those who experience high levels of hunger; but, on the other hand, there is need to increase the transfer amount provided to those families as a short-term measure. Long-term measures would include strengthening education policies, job creation, and development of food and nutrition education strategies so that those families would have more autonomy and increased awareness in terms of access to nutritionally adequate food.
Like the PNAD 2004 data, the data from the present study also showed that the higher the score of the presence of household goods and services, the lower the risk of FI9; the
possession of goods or services may indicate not only their current financial situation but also a history of better financial conditions or the priority that those families give to the management of their earnings.
Consistent with the findings from other studies, it was found that the living conditions, which included unfinished masonry or other; property given to the family, occupied, or other; and more than two people per bedroom, also increased the probability of food insecurity21,25-27.
CONDITIONS ASSOCIATED WITH FOOD INSECURITY| 855
Rev. Nutr., Campinas, 29(6):845-857, nov./dez., 2016 Revista de Nutrição http://dx.doi.org/10.1590/1678-98652016000600009
Finally, as for the household head employment status, informal workers accounted for 22.1% of the sample studied and were almost four times more likely to experience MSFI than formal workers, corroborating a result from the Pesquisa Nacional por Amostra de Domicílios 20135. In the 1990s, level of education was
identified as a necessary condition for better paying jobs29, a condition that persists today
combined with the importance of learning a foreign language and computer skills. The analysis of national unemployment rates among young people and the difficulties they encounter in finding work, has demonstrated the educational disadvantage among those who come from low-income families30. Accordingly, unemployment
or lack of formal employment are directly associated with food insecurity8,21.
Since this is a cross-sectional study, it was not possible to draw cause-and-effect inferences between the variables. Additionally, the fact that the study was restricted to the lowest socioeconomic status region, due to budget constraints, may have contributed to the sample homogenization, reducing the probabilities of showing the relationship of the factors associated with food insecurity. However, the estimated power of the test was 0.9, with α=0.05 and β=0.1, thus ensuring that the sample size was sufficiently large to confirm the relationships found between the variables studied. Therefore, these data can be extrapolated to populations with similar characteristics, i.e., urban population living in the peripheries of large cities in the Southeastern and Southern regions of the country.
C O N C L U S I O N
Despite the noticeable efforts devoted to the implementation of public policies on food and nutrition, more than a third of the interviewed households experienced some form of food insecurity, which is higher than the 2013 national average.
The results show the differences in the household characteristics associated with food deprivation. Mild food insecurity was more strongly associated with demographic conditions, suggesting that the most immediate problems were solved. However, in order to achieve food security, changes related to household infrastructure, job stability, and adequate living condition, such as the number of bedrooms and rooms proportional to the number of people residing in the household, are needed. The greater the number of goods owned by the households, the lower the probability of food insecurity, indicating that people buy goods when they have guaranteed access to food. In addition to these characteristics, moderate or severe food insecurity is associated with socioeconomic conditions, especially unemployment.
A C K N O W L E D G E M E N T S
The authors are grateful for the financial support provided by the Fundação de Amparo à Pes-quisa do Estado de São Paulo and acknowledge the PhD scholarship granted to BFNJ Souza by the Coordenação de Aperfeiçoamento de Pessoal de Nível Superior.
C O N T R I B U T O R S
BFNJ SOUZA wrote this article and performed the statistical analyses. L MARIN-LEON guided and reviewed all sections and versions of the article. DFM CAMARGO and AM SEGALL-CORRÊA collaborated in the revision and final version of the article.
R E F E R E N C E S
1. Brasil. Emenda constitucional nº 64, de 4 de feve-reiro de 2010. Altera o art. 6º da Constituição Fe-deral, para introduzir a alimentação como direito social. Brasília: Presidência da República; 2010. 2. Brasil. Decreto nº 7.272, de 25 de agosto de 2010.
856
|
BFNJ SOUZA et al.Rev. Nutr., Campinas, 29(6):845-857, nov./dez., 2016
Revista de Nutrição
http://dx.doi.org/10.1590/1678-98652016000600009
Alimentar e Nutricional - Sisan com vistas a assegu-rar o direito humano à alimentação adequada, institui a Política Nacional de Segurança Alimentar e Nutricional - PNSAN, estabelece os parâmetros para a elaboração do Plano Nacional de Segurança Alimentar e Nutricional, e dá outras providências. Diário Oficial da União 2010; 26 ago, p.6-8, Seção 1, n.164.
3. Coleman-Jensen A, Rabbit MP, Gregory C, Singh A. Household Food Security in the United States in 2014. Economic Research Report Service: ERR 194. Washington: United States Department of Agriculture; 2015 [cited 2015 Oct 22]. Available from: http:// www.ers.usda.gov/media/1896841/err194.pdf 4. Mundo-Rosas V, Shamah-Levy T, Rivera-Dommarco
JA. Epidemiología de la inseguridad alimentaria en México. Salud Pública Méx. 2013 [acesso 2015 out 22]; 55(Supl. 2):S206-S213. Disponível em: http:// www.scielo.org.mx/pdf/spm/v55s2/v55s2a18.pdf 5. Instituto Brasileiro de Geografia e Estatística.
Pes-quisa Nacional por Amostra de Domicílios. Seguran-ça Alimentar 2013. IBGE: Rio de Janeiro; 2014 [acesso 2015 jun 05]. Disponível em: http://bi-blioteca.ibge.gov.br/visualizacao/livros/liv919 84.pdf
6. Food and Agriculture Organization of the United Nations. The State of Food Insecurity in the World. Strengthening the enabling environment for food security and nutrition. Rome: FAO; 2014 [cited 2015 20 Sep]; Available from: http://www.fao.org/ 3/a-i4030e.pdf
7. Organização das Nações Unidas. Agenda 2030. Objetivos de desenvolvimento sustentável. Brasília: ONU; 2015 [acesso 2015 out 22]. Disponível em: http://nacoesunidas.org/pos2015/agenda2030/ 8. Nord M, Coleman-Jensen A, Gregory C. Prevalence
of U.S. Food insecurity is related to changes in unemployment, inflation, and the price of food. Economic Research Service: ERR 167. Washington (DC): United States Department of Agriculture; 2015 [cited 2015 Nov 20]. Available from http:// www.ers.usda.gov/media/1489984/err167.pdf 9. Marin-Leon L, Francisco PMSB, Segall-Corrêa AM,
Panigassi G. Bens de consumo e insegurança ali-mentar: diferenças de gênero, cor de pele autorrefe-rida e condição socioeconômica. Rev Bras Epidemiol. 2011; 14(3):398-410. http://dx.doi.org/10.1590/S1 415-790X2011000300005
10. Gundersen CG, Garasky SB. Financial management skills are associated with food insecurity in a sample of households with children in the United States. The J Nutr. 2012. 142(10):1865-70. http://dx.doi. org/10.3945/ jn.112.162214
11. Anater AS, Chambard M, Barnes M, Morgan L, Woodward K, Beaulieu S, et al. Current and
prospective scope of hunger and food security in America: A review of current research. Prepared for the president and congress. North Carolina: RTI International; 2014 [cited 10 Nov 2015]. Available from: https://www.rti.org/sites/default/files/ resources/full_hunger_report_final_07-24-14.pdf 12. Kish L. Survey Sampling. New York: John Wiley
and Sons, Inc.; 1965.
13. Panigassi, G, Inquérito populacional sobre a per-cepção da segurança alimentar intrafamiliar no mu-nicípio de Campinas, SP. [Doutorado]. Campinas: Universidade Estadual de Campinas; 2005 [acesso 2015 jul 30]. Disponível em: http://www.biblioteca digital.unicamp.br/document/?view=vtls00038 9627
14. Associação Brasileira de Empresas de Pesquisa. Critério de classificação econômica Brasil 2008. São Paulo: ABEP; 2010 [acesso 2015 out 22]. Disponível em: http://www.abep.org/criterio-brasil
15. Segall-Corrêa AM, Marin-Leon L, Melgar-Quiñonez H, Perez-Escamilla R. Refinement of the Brazilian Household Food Insecurity Measurement Scale: Recommendation for a 14-item EBIA. Rev Nutr. 2014; 27(2):241-51. http://dx.doi.org/10.1590/14 15-52732014000200010
16. Instituto Brasileiro de Geografia e Estatística. Pes-quisa Nacional por Amostra de Domicílios. Segu-rança alimentar 2004/2009. Rio de Janeiro: IBGE; 2010 [acesso 2015 out 22]. p.83. Disponível em: http://www.ibge.gov.br/home/estatistica/ populacao/seguranca_alimentar_2004_2009/ pnadalimentar.pdf
17. Recine E, Vasconcellos AB. Políticas nacionais e o campo da alimentação e nutrição em saúde cole-tiva: cenário atual. Ciênc Saúde Colet. 2011. 16(1):73-9. http://dx.doi.org/10.1590/S1413-812 32011000100011
18. Salvato MA, Ferreira PCG, Duarte AJM. O impacto da escolaridade sobre a distribuição de renda. Estud Econ. 2010; 40(4):753-91. http://dx.doi.org/10.15 90/S0101-41612010000400001
19. Instituto de Pesquisa Econômica Aplicada. Um retrato de duas décadas do mercado de trabalho brasileiro utilizando a PNAD. Brasília: IPEA; 2013 [acesso 2015 ago 10]; Disponível em: http://www. ipea.gov.br/ portal/images/stories/PDFs/comunicado/ 131007_comunicadoipea160.pdf
CONDITIONS ASSOCIATED WITH FOOD INSECURITY| 857
Rev. Nutr., Campinas, 29(6):845-857, nov./dez., 2016 Revista de Nutrição http://dx.doi.org/10.1590/1678-98652016000600009
21. Hoffmann R. Determinantes da insegurança alimen-tar no Brasil: análise dos dados da PNAD de 2004. Segur Aliment Nutr. 2008 [acesso 2015 ago 12]; 15(1):49-61. Disponível em: http://periodicos.sbu. unicamp.br/ojs/index.php/san/article/view/1824 22. Segall-Corrêa AM, Marin-Leon L, Helito H,
Pérez--Escamilla R, Santos LMP, Paes-Sousa R. Transferência de renda e segurança alimentar no Brasil: análise dos dados nacionais. Rev Nutr. 2008 [acesso 09 Set 2015]; 21(Supl.):39s-51s
23. Prefeitura Municipal de Campinas. Secretaria de Planejamento e Desenvolvimento Urbano. Tabulações do Censo Demográfico de 2010. Rio de Janeiro: IBGE; 2010 [acesso 2015 out 22]. Dispo-nível em: http://www.campinas.sp.gov.br/governo/ seplama/publicacoes/total_domicilios.php 24. Brasil. Painel Síntese do Plano Brasil Sem Miséria.
Quantidade de famílias beneficiárias do Programa Bolsa Família. Brasília: MDS; 2015 [acesso 2015 out 22]. Disponível em: http://aplicacoes. mds.gov.br/ s a g i / M O N I B 2 / i n d e x _ a l l _ d r o p _ d o w n . php?p_id=539&p_ferramentas=1&p_sem_ legenda=1& p_encontro=1&p_global_ibge=350 950
25. Vianna RPT, Segall-Corrêa AM. Insegurança ali-mentar das famílias residentes em municípios do interior do estado da Paraíba, Brasil. Rev Nutr. 2008 [acesso 2015 out 30]; 21(Supl.):111s-122s. Dispo-nível em: http://www.scielo.br/pdf/rn/v21s0/10.pdf
26. Souza BFNJ, Marín-León L. Food insecurity among the elderly: Cross-sectional study with soup kitchen users. Rev Nutr. 2013. 26(6):679-691. http://dx.doi. org/10.1590/S1415-52732013000600007 27. Peixoto MRG, Ramos K, Martins KA, Schincaglia
RM, Braudes-Silva LA. Insegurança alimentar na área de abrangência do Núcleo de Apoio à Saúde da Família em Itumbiara, Goiás. Epidemiol Serv Saúde. 2014 [acesso 2015 dez 8]; 23(2):327-336. Disponível em: http://www.scielo.br/pdf/ress/v23 n2/1679-4974-ress-23-02-00327.pdf
28. Coelho Filho JM, Ramos LR. Epidemiologia do en-velhecimento no Nordeste do Brasil: resultados de inquérito domiciliar. Rev Saúde Pública. 1999; 33(5)445-453. http://dx.doi.org/10.1590/S0034-8 9101999000500003
29. Alves ELG, Soares FV. Texto para discussão nº 428. Ocupação e escolaridade: tendências recentes na Grande São Paulo. Brasília: IPEA; 1996 [acesso 2015 dez 8]. Disponível em: http://www.ipea.gov.br/ agencia/images/stories/PDFs/TDs/td_0428.pdf 30. Ribeiro R, Neder HD. Juventude(s): desocupação,
pobreza e escolaridade. Nova Econ. 2009; 19(3):475-506. http://dx.doi.org/10.1590/S0103-63512009000300004
858
|
BFNJ SOUZA et al.Rev. Nutr., Campinas, 29(6):845-857, nov./dez., 2016
Revista de Nutrição