1Article based on the dissertation of BFNJ SOUZA, intitled “Condições de vida e saúde de idosos residentes em Campinas-SP: estudo caso-controle com usuários de restaurante popular”. Universidade Estadual de Campinas; 2012. Sponsor: Fundação de Amparo à Pesquisa do Estado de São Paulo (Process nº 2010/51185-2).
2Universidade Estadual de Campinas, Faculdade de Ciências Médicas, Departamento de Saúde Coletiva. R. Tessália Vieira de
Camargo, 126, 13083-887, Campinas, SP, Brasil. Correspondência para/Correspondence to: BFNJ SOUZA. E-mail: <[email protected]>.
Food insecurity among the elderly:
Cross-sectional study with
soup kitchen users
1Insegurança alimentar em idosos
:
estudo transversal com usuários
de restaurante popular
Bruna Fernanda do Nascimento Jacinto de SOUZA2
Letícia MARÍN-LEÓN2
A B S T R A C T
Objective
To investigate whether food insecurity is associated with the demographic, socioeconomic, lifestyle, and health conditions of the elderly.
Methods
This cross-sectional study included 427 elderly (³60 years) from Campinas, São Paulo; half were users of a government-run soup kitchen and the others, their neighbors of the same sex. Food insecurity was measured by the Brazilian Food Insecurity Scale. Univariate multinomial logistic regression was used for calculating the
odds ratio and 95% confidence interval to measure the association between the independent variables and food insecurity. Variables with p<0.20 were included in a multinomial model, and only those with p<0.05 remained.
Results
OR=2.92) and who did not consume fruits (OR=2.95 and OR=4.11) or meats daily (OR=2.04 and OR=3.83) were more likely to be mildly and moderately/severely food insecure.
Conclusion
Food insecure elderly are more likely to have chronic diseases, poor nutritional status, and poor socioeconomic condition. Therefore, the welfare programs should expand the number of soup kitchens and develop other strategies to assure adequate nutrition to these elderly.
Indexing terms:Aged.Chronic disease. Food consumption. Food security. Nutritional status. Socioeconomic factors.
R E S U M O
Objetivo
Investigar a associação de insegurança alimentar com as condições demográficas, socioeconômicas, de estilo de vida e saúde de idosos.
Métodos
Estudo transversal com 427 idosos (≥60 anos), residentes em Campinas, São Paulo, usuários de restaurante popular, e seus respectivos vizinhos do mesmo sexo. A insegurança alimentar foi medida utilizando a Escala Brasileira de Insegurança Alimentar. Calculou-se Odds Ratio e Intervalo de Confiança de 95%, mediante regressão logística multinomial univariada, para medir associação das variáveis independentes com insegurança alimentar; as com p<0,20 integraram modelo de regressão multinomial múltiplo, permanecendo as variáveis com p<0,05.
Resultados
Dos entrevistados, 63,2% eram homens; houve 15,2% de insegurança leve e 6,6% de moderada/grave. No modelo final, ajustado por sexo e idade, observou-se maior chance de insegurança leve entre idosos que tinham renda familiar total ≤ 2 salários-mínimos (OR=3,41; IC95%=1,27-9,14), não trabalhavam fora (OR=2,95; IC95%=1,23-7,06), e eram obesos (OR=2,01; IC95%=1,04-3,87). Houve maior chance de insegurança moderada/grave entre aqueles que referiram ter tido câncer (OR=4,13; IC95%=1,21-14,0) e internação no último ano (OR=3,16; IC95%=1,23-8,11). Maior chance de insegurança leve e moderada/grave foi observada entre aqueles que residiam em moradia de alvenaria inacabada/outras (OR=2,71; e OR=2,92), e que referiram não consumir diariamente frutas (OR=2,95; e OR=4,11) e carnes (OR=2,04; e OR=3,83).
Conclusão
Os idosos com insegurança alimentar apresentam maior chance de doenças crônicas, pior estado nutricional, além de piores condições socioeconômicas, motivo pelo qual se sugere a expansão do número de restaurantes populares, bem como desenvolver outras estratégias para assegurar a nutrição adequada dos idosos.
Termos de indexação: Idoso.Doença crônica. Consumo alimentar. Segurança alimentar e nutricional. Estado nutricional. Fatores socioeconômicos.
I N T R O D U C T I O N
The concept of food security is defined by the Conselho Nacional de Segurança Alimentar e Nutricional (Consea, National Food and Nutrition Security Council) as the condition in which individuals obtain, in a sociably acceptable manner, a diet that meets their individual requirements quantitatively and qualitatively, keeping them healthy. In 2006, the definition was incorporated in the Organic Law on Food and Nutrition Security1.
Food and nutrition security is a very broad theme which can be analyzed from macro- and microeconomic viewpoints and involves conditions related to food supply and demand2.
Epidemiological studies have used the
concepts5. Food insecurity ranges from the concern and anguish caused by uncertain access to food, to hunger caused by food deprivation4.
The intense process of demographic transition that started around the 1940s in Brazil resulted in an expressive increase in the number of elderly6. The census of 2010 found that the population of individuals aged 60 years or more exceeded 20 million, 10.8% of the general population. The elderly represent 12.4% of the population of Campinas, São Paulo, or 10.9% of the males and 13.8% of the females7.
The United States of America (USA) has monitored yearly the rates of food security across the population. In 2010, 14.5% of the American households experienced some sort of food insecurity. The prevalence of food insecurity in households with elderly individuals (≥65 years) was 7.9%, and among elderly who lived alone, 8.0%8.
In general, the prevalence of food insecurity tends to be smaller in households with elderly individuals, since the elderly usually have stable incomes when compared with other groups8,9. In Brazil, the Pesquisa Nacional por
Amostra de Domicílios10 (PNAD, National Household Sample Survey) found a prevalence of food insecurity of 30.2%, 11.5% being moderate or severe, while households with elderly individuals had prevalences of 23.9% and 8.8%, respectively. Based on PNAD/2004, Rosa et al.11 reported that the prevalence of food insecurity in households headed by elderly individuals was 29.8%, while the prevalence for all households in that same year was 34.8%12. In Campinas (SP), a population-based cross-sectional study found that 52.0% of the households experienced some degree of food insecurity in 2003, and moderate or severe food insecurity was found in 19.0% of the households with elderly individuals; no differences on the prevalence of food insecurity were observed between households with children/adolescents <18 years and those with elderly13. Food insecurity has a greater impact on the elderly because of its association with chronic diseases,
such as obesity, diabetes, high blood pressure, and depression14-16.
The development of public policies against food insecurity in Brazil began some decades ago17. However, the government began to increase the number of social benefits, especially their coverage, in 2003, launching the program
Fome Zero (Zero Hunger). Among other initiatives, this public policy included the establishment of soup kitchens to increase access to food18. In the State of São Paulo, soup kitchens are currently run by the State Department of Social Development, and its objective is to provide nutritionally balanced meals at a very low price19.
Hence, considering the growing proportion of elderly in the population and the importance of local epidemiological information for the planning, implementation, definition, and review of assistance policies and actions, the objective of this study was to investigate whether food insecurity is associated with the demographic, socioeconomic, lifestyle, and health conditions of the elderly.
M E T H O D S
This cross-sectional study was conducted in Campinas (SP), with 427 elderly aged 60 years or more with permanent address.
The study demographic variables were gender (male; female), age (60-69 years; 70 years or more), race/color (Caucasian; not Caucasian), and marital status (married; single/separated/ divorced/widowed). The socioeconomic variables were education level (≤4 years of formal education; >4 years of formal education), total family income (≤2 minimum salaries; >2 minimum salaries), job status (yes; no), economic class according to the Economic Classification Criterion Brazil 2008 (A+B; C; D+E)20, and type of house (finished masonry; unfinished masonry/others).
the past three months. Given that each ‘yes’ represents one point and that the scale ranges from zero to fifteen points, the scores are as follows: 0 means food security. In families with children/adolescents <18 years, the scores for mild, moderate, and severe food insecurity are 1-5 points, 6-10 points, and 11-15 points, respectively. In families without minors, the respective scores are 1-3 points, 4-6 points, and 7-9 points. The present study considered moderate and severe food insecurity as a single category13.
The study health variables were self-perceived health (very good/good; regular/bad/ very bad); self-reported diseases when asked “Have you been told by a doctor or other health professional that you have any of the following diseases?” (high blood pressure; dyslipidemia; diabetes; heart disease; cancer); daily use of medications (yes; no); and hospitalization in the past year (yes; no). Physical ability was estimated by the following questions: “Do you leave home daily?” (yes; no); and “For how long can you walk without getting tired?” (15 minutes or less; more than 15 minutes). The participants’ weight was measured by a portable digital scale for adults (Tanita, model BF-680) and height by a portable stadiometer for adults (Sanny). Body Mass Index (BMI) was calculated by dividing the weight in kilograms by the square of the height in meters (kg/m2). Nutritional status was classified as underweight (BMI <23kg/m2), normal weight (23kg/m2≤BMI <28kg/m2), and obese (BMI ≥28kg/m2)21.
Food intake was determined by a food frequency questionnaire with 8 foods or food groups and their respective intake frequencies (does not eat; 1-2/month, 1-2/week, 3-6/week, and daily). For the analysis, the food intake frequencies were categorized as daily or not for milk, fruits, vegetables, and meats; and less than once a week or once or more a week for deep fried foods, sausages, and soda. Additionally, the study investigated how often supper was replaced by a snack (never; at least once a week); and whether the participants frequented the soup kitchen Restaurante Popular - Bom Prato (yes; no).
The interviews were conducted from January to August 2011 by trained interviewers using an interviewer manual developed for standardizing the method of approach.
A pilot study in the soup kitchen Bom Prato
was conducted to test the questionnaire and its administration strategies. Questions difficult to understand were improved.
The soup kitchen Bom Prato is part of the
Fome Zero program and aims to provide very inexpensive but healthy meals to socially vulnerable individuals18.
The sample consisted of two groups. The first group was selected at the soup kitchen. All elderly individuals who were in the waiting line were invited to participate in the study. The anthropometric measurements were taken before lunch. Approximately 15% of the elderly refused to participate. The second group consisted of the same-sex neighbors of the first group. The selection began in the same block of reference, at the right side of the participant’s home. If there were no elderly in the same block, the search continued in the next block to the right of the first block. Approximately 4% of the elderly neighbors refused to participate in the study.
multiple multinomial regression model. Only the statistically significant variables (p<0.05) controlled for sex and age remained in the final model.
All study participants were informed about the study individually and interviewed only after they signed a free and informed consent form. The project was approved by the Research Ethics Committee of the School of Medical Sciences of the Universidade Estadual de Campinas in April 2010 (CEP nº 169/2009).
R E S U L T S
Of the 427 interviewees, 270 (63.2%) were males; 72.2% were food secure, 15.2% were mildly food insecure, and 6.6% were moderately/severely food insecure.
The elderly with four years or less of formal education were approximately four times more likely to be mildly food insecure than those with more than four years of formal education (OR=3.74; 95%CI=1.65-8.48). Those living in
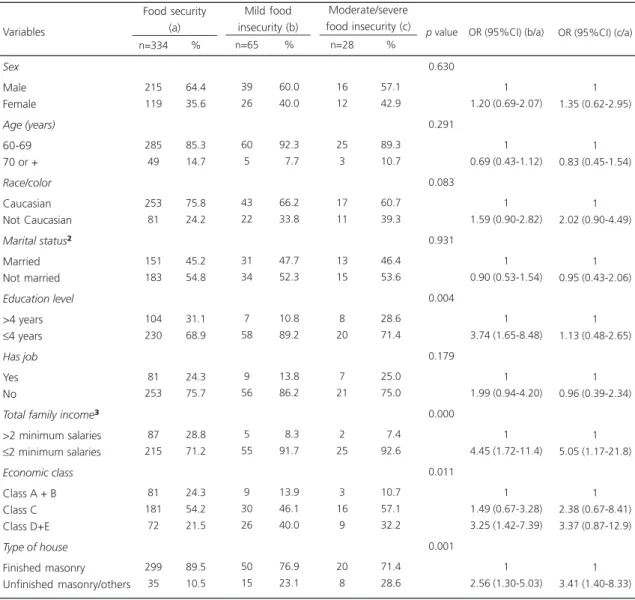
Table 1. Food security status according to demographic and socioeconomic variables and the Odds Ratio (OR) of mild and moderate/ severe food insecurity using food security as the reference category¹. Campinas (SP) Brazil, 2011.
Sex
Male Female
Age (years)
60-69 70 or +
Race/color
Caucasian Not Caucasian
Marital status²
Married Not married Education level >4 years ≤4 years Has job Yes No
Total family income³
>2 minimum salaries ≤2 minimum salaries
Economic class
Class A + B Class C Class D+E
Type of house
Finished masonry Unfinished masonry/others Food security (a) 215 119 285 49 253 81 151 183 104 230 81 253 87 215 81 181 72 299 35 64.4 35.6 85.3 14.7 75.8 24.2 45.2 54.8 31.1 68.9 24.3 75.7 28.8 71.2 24.3 54.2 21.5 89.5 10.5 n=334 % Mild food insecurity (b) Moderate/severe food insecurity (c)
39 26 60 5 43 22 31 34 7 58 9 56 5 55 9 30 26 50 15 60.0 40.0 92.3 07.7 66.2 33.8 47.7 52.3 10.8 89.2 13.8 86.2 08.3 91.7 13.9 46.1 40.0 76.9 23.1 n=65 % 16 12 25 3 17 11 13 15 8 20 7 21 2 25 3 16 9 20 8 57.1 42.9 89.3 10.7 60.7 39.3 46.4 53.6 28.6 71.4 25.0 75.0 07.4 92.6 10.7 57.1 32.2 71.4 28.6 n=28 % 0.630 0.291 0.083 0.931 0.004 0.179 0.000 0.011 0.001
p value OR (95%CI) (b/a) OR (95%CI) (c/a)
1 1.20 (0.69-2.07) 1 0.69 (0.43-1.12) 1 1.59 (0.90-2.82) 1 0.90 (0.53-1.54) 1 3.74 (1.65-8.48) 1 1.99 (0.94-4.20) 1 4.45 (1.72-11.4) 1 1.49 (0.67-3.28) 3.25 (1.42-7.39) 1 2.56 (1.30-5.03) 1 1.35 (0.62-2.95) 1 0.83 (0.45-1.54) 1 2.02 (0.90-4.49) 1 0.95 (0.43-2.06) 1 1.13 (0.48-2.65) 1 0.96 (0.39-2.34) 1 5.05 (1.17-21.8) 1 2.38 (0.67-8.41) 3.37 (0.87-12.9) 1 3.41 (1.40-8.33)
Note: ¹OR calculated by univariate multinomial logistic regression; ²Not married means single, widowed, divorced or separated; 338 did not inform.
95%CI: Confidence Interval of the 95%.
households with a monthly family income equal to or below two minimum salaries and in unfinished masonry or another type of house were more likely to be mildly food insecure (OR=4.45; 95%CI=1.72-11.4 and OR=2.56; 95%CI=1.30-5.03) or moderately/severely food insecure (OR=5.05;
95%CI=1.17-21.8 and OR=3.41; 95%CI=1.40-8.33, respectively). Finally, those belonging to the economic classes D+E were also more likely to be mildly food insecure (OR=3.25; 95%CI=1.42-7.39). Age, marital status, and frequenting soup kitchens were not associated with food security status.
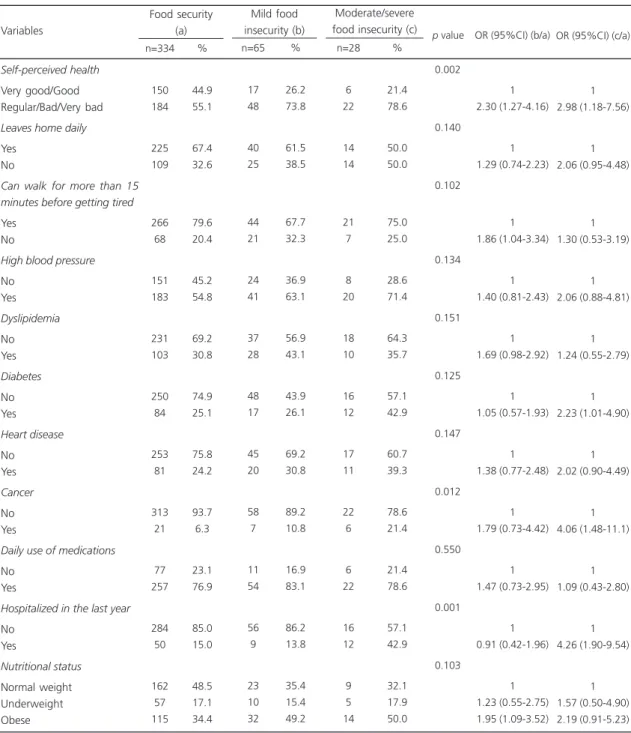
Table 2. Food security status according to health variables and the Odds Ratio (OR) of mild and moderate/severe food insecurity using food security as the reference category¹. Campinas (SP) Brazil, 2011.
Self-perceived health
Very good/Good Regular/Bad/Very bad
Leaves home daily
Yes No
Can walk for more than 15 minutes before getting tired
Yes No
High blood pressure
No Yes Dyslipidemia No Yes Diabetes No Yes Heart disease No Yes Cancer No Yes
Daily use of medications
No Yes
Hospitalized in the last year
No Yes Nutritional status Normal weight Underweight Obese Food security (a) 150 184 225 109 266 68 151 183 231 103 250 84 253 81 313 21 77 257 284 50 162 57 115 44.9 55.1 67.4 32.6 79.6 20.4 45.2 54.8 69.2 30.8 74.9 25.1 75.8 24.2 93.7 6.3 23.1 76.9 85.0 15.0 48.5 17.1 34.4 n=334 % Mild food insecurity (b) Moderate/severe food insecurity (c)
17 48 40 25 44 21 24 41 37 28 48 17 45 20 58 7 11 54 56 9 23 10 32 26.2 73.8 61.5 38.5 67.7 32.3 36.9 63.1 56.9 43.1 43.9 26.1 69.2 30.8 89.2 10.8 16.9 83.1 86.2 13.8 35.4 15.4 49.2 n=65 % 6 22 14 14 21 7 8 20 18 10 16 12 17 11 22 6 6 22 16 12 9 5 14 21.4 78.6 50.0 50.0 75.0 25.0 28.6 71.4 64.3 35.7 57.1 42.9 60.7 39.3 78.6 21.4 21.4 78.6 57.1 42.9 32.1 17.9 50.0 n=28 % 0.002 0.140 0.102 0.134 0.151 0.125 0.147 0.012 0.550 0.001 0.103
p value OR (95%CI) (b/a) OR (95%CI) (c/a)
1 2.30 (1.27-4.16) 1 1.29 (0.74-2.23) 1 1.86 (1.04-3.34) 1 1.40 (0.81-2.43) 1 1.69 (0.98-2.92) 1 1.05 (0.57-1.93) 1 1.38 (0.77-2.48) 1 1.79 (0.73-4.42) 1 1.47 (0.73-2.95) 1 0.91 (0.42-1.96) 1 1.23 (0.55-2.75) 1.95 (1.09-3.52) 1 2.98 (1.18-7.56) 1 2.06 (0.95-4.48) 1 1.30 (0.53-3.19) 1 2.06 (0.88-4.81) 1 1.24 (0.55-2.79) 1 2.23 (1.01-4.90) 1 2.02 (0.90-4.49) 1 4.06 (1.48-11.1) 1 1.09 (0.43-2.80) 1 4.26 (1.90-9.54) 1 1.57 (0.50-4.90) 2.19 (0.91-5.23) Variables
Females, non-Caucasians, and those without a job were more likely to be food insecure, but the differences, confirmed by the confidence interval, were not significant (Table 1).
The elderly who reported having regular/ bad/very bad health were two times more likely to be mildly (OR=2.30; 95%CI=1.27-4.16) or moderately/severely food insecure (OR=2.98; 95%CI=1.18-7.56). Those who could not walk 15 minutes without getting tired were also more likely to be mildly food insecure (OR=1.86; 95%CI=1.04-3.34). Obese elderly were almost twice as likely to be mildly food insecure (OR=1.95; 95%CI=1.09-3.52). Moderately/ severely food insecure elderly were more likely to have diabetes (OR=2.23; 95%CI=1.01-4.90) or cancer (OR=4.06; 95%CI=1.48-11.1), or to have been hospitalized in the past year (OR=4.26; 95%CI=1.90-9.54). Leaving home daily, high blood pressure, dyslipidemia, heart disease, and daily use of medication were positively associated with food insecurity, but the differences, confirmed by the confidence interval, were not significant (Table 2).
The elderly who did not consume fruits daily were three and four times more likely to be mildly (OR=3.16; 95%CI=1.80-5.56) and moderately/severely food insecure (OR=4.53; 95%CI=1.87-10.9), respectively. Likewise, the elderly who did not consume meats daily were two and four times more likely to be mildly (OR=1.98; 95%CI=1.15-3.42) and moderately/ severely food insecure (OR=3.72; 95%CI=1.54-8.99), respectively. Those who replaced supper by a snack and did not consume milk, leaf vegetables, and vegetables daily, and consumed soda at least once a week were more likely to be mildly and moderately/severely food insecure, but the differences were not confirmed by the confidence interval (Table 3).
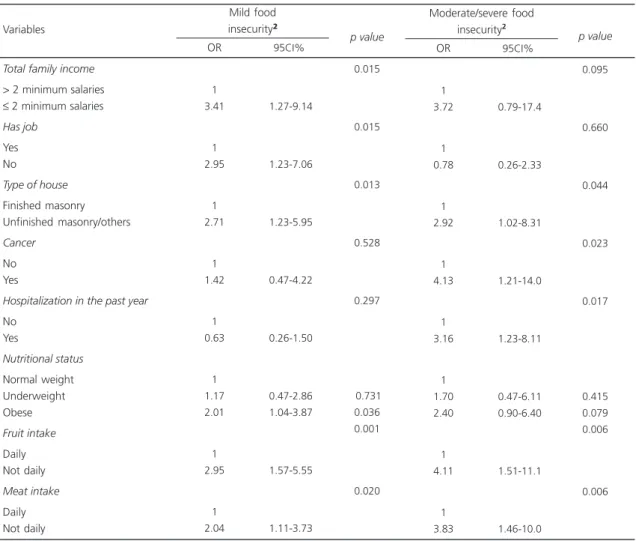
In addition to the variables presented in Table 4, the final model was adjusted for sex and age. Elderly with a total family income ≤2 minimum salaries (OR=3.41; 95%CI=1.27-9.14), without a job (OR=2.95; 95%CI=1.23-7.06), and
who were obese (OR=2.01; 95%CI=1.04-3.87) were more likely to be mildly food insecure. Those who had had cancer (OR=4.13; 95%CI 1.21-14.0) and been hospitalized in the past year (OR=3.16; 95%CI 1.23-8.11) were more likely to be moderately/severely food insecure. The elderly were more likely to be mildly and moderately/ severely food insecure if they lived in unfinished masonry or other types of houses (OR=2.71; 95%CI=1.23-5.95 and OR=2.92; 95%CI=1.02-8.31, respectively) and did not eat fruits (OR=2.95; 95%CI=1.57-5.55 and OR=4.11; 95%CI=1.51-11.1, respectively) or meats daily (OR=2.04; 95%CI=1.11-3.73 and OR=3.83; 95%CI=1.46-10.0).
D I S C U S S I O N
Despite the increasing size of the elderly population and the current importance of the food security theme, there are few studies about food insecurity among the elderly. Although EBIA investigates only access to food and not whether the food is obtained in a socially acceptable manner or whether the diet meets the individual’s requirements established by Consea, its use helps to identify the vulnerable population, complementing the socioeconomic indicators used for planning.
Since this is not a population-based study, one of its limitations is the impossibility of estimating prevalences representative of the elderly in the municipality. Another issue worthy of mention is that the higher coverage of welfare programs and/or the greater availability of credit for the population have reduced the prevalences of food insecurity, so a larger sample size would be necessary to investigate the association between food insecurity and frequenting soup kitchens.
Table 3. Food security status according to eating habits and the Odds Ratio (OR) of mild and moderate/severe food insecurity using food security as the reference category¹. Campinas (SP) Brazil, 2011.
Soup kitchen user
Yes No
Replaces supper by snack
Never
Once or more per week
Milk intake Daily Not daily Fruit intake Daily Not daily
Leaf vegetable intake
Daily Not daily
Vegetable intake
Daily Not daily
Meat intake²
Daily Not daily
Deep-fried food intake
< once per week ≥ once per week
Sausage intake
< once per week ≥ once per week
Soda intake
< once per week ≥ once per week
Food security (a) 162 172 137 197 215 119 201 133 92 242 81 253 185 149 103 231 137 197 126 208 48.5 51.5 41.0 59.0 64.4 35.6 60.2 39.8 27.5 72.5 24.3 75.7 55.4 44.6 30.8 69.1 41.0 59.0 37.7 62.3 n=334 % Mild food insecurity (b) Moderate/severe food insecurity (c)
34 31 35 30 38 27 21 44 11 54 9 56 25 40 20 45 33 32 23 42 52.3 47.7 83.8 46.1 58.5 41.5 32.3 67.7 16.9 83.1 13.8 86.2 38.5 61.5 30.8 69.2 50.8 49.2 35.4 64.6 n=65 % 14 14 9 19 15 13 7 21 5 23 4 24 7 21 9 19 17 11 12 16 50.0 50.0 32.1 67.9 53.6 46.4 25.0 75.0 17.9 82.1 14.3 85.7 25.0 75.0 32.1 67.9 60.7 39.3 42.9 57.1 n=28 % 0.851 0.084 0.387 0.000 0.127 0.107 0.001 0.989 0.061 0.792
p value OR (95%CI) (b/a) OR (95%CI) (c/a)
1 0.85 (0.50-1.46) 1 0.59 (0.34-1.01) 1 1.28 (0.74-2.20) 1 3.16 (1.80-5.56) 1 1.86 (0.93-3.72) 1 1.99 (0.94-4.20) 1 1.98 (1.15-3.42) 1 1.00 (0.56-1.78) 1 0.67 (0.39-1.14) 1 1.10 (0.63-1.92) 1 0.94 (0.43-2.03) 1 1.46 (0.64-3.34) 1 1.56 (0.72-3.40) 1 4.53 (1.87-10.9) 1 1.74 (0.64-4.73) 1 1.92 (0.64-5.70) 1 3.72 (1.54-8.99) 1 0.94 (0.41-2.15) 1 0.44 (0.20-1.00) 1 0.80 (0.37-1.76) Variables
Note: ¹OR calculated by univariate multinomial logistic regression; 2Beef, chicken, pork. 95%CI: Confidence Interval of the 95%.
insecurity, possibly because the retirement pension increases the family income25. A study conducted in 2009 in Australia found a frequency of food insecurity among adults of 25.0%, and those who reported lower incomes were approximately nine times more likely to be food insecure (OR=8.96; 95%CI=4.41-12.21)26. In Texas, USA, city data of 2006 showed that 18.6% of adults and elderly aged ≥50 years were food insecure, especially women and those below the poverty line; moreover, the prevalence of food insecurity decreased as the education level and age increased (p<0.000)27.
Like education level and income, economic class has been pointed out as an important indicator of food security status. A population-≥1 minimum salary to 34.1% for those whose
per capita income was less than 25.0% of a minimum salary) and education levels (0.7% for those with more than 10 years of formal education to 9.6% for those with less than one year of formal education), and the prevalences increased as these conditions worsened11. For the
Distrito Federal, the same survey showed that the prevalences of mild and severe food insecurity in households headed by elderly individuals was 12.9% and 4.3%, respectively, and in households not headed by elderly individuals, the prevalences were 8.2% and 3.0%, respectively24. Brasilia’s situation is opposite to that of the rest of the country, where the presence of elderly individuals heading the household protects against food
Table 4. Final multiple multinomial regression model, Odds Ratio (OR) adjusted for sex and age group¹. Campinas (SP) Brazil, 2011.
Total family income
> 2 minimum salaries ≤ 2 minimum salaries
Has job
Yes No
Type of house
Finished masonry Unfinished masonry/others
Cancer
No Yes
Hospitalization in the past year
No Yes
Nutritional status
Normal weight Underweight Obese
Fruit intake
Daily Not daily
Meat intake
Daily Not daily Variables
¹OR calculated by multinomial logistic regression; ²Reference category: food security; 95%CI: Confidence Interval of the 95%. 1
3.41
1 2.95
1 2.71
1 1.42
1 0.63
1 1.17 2.01
1 2.95
1 2.04
OR 95CI%
Mild food insecurity²
1.27-9.14
1.23-7.06
1.23-5.95
0.47-4.22
0.26-1.50
0.47-2.86 1.04-3.87
1.57-5.55
1.11-3.73
0.015
0.015
0.013
0.528
0.297
0.731 0.036 0.001
0.020
1 3.72
1 0.78
1 2.92
1 4.13
1 3.16
1 1.70 2.40
1 4.11
1 3.83
OR 95CI%
Moderate/severe food insecurity2
0.79-17.4
0.26-2.33
1.02-8.31
1.21-14.0
1.23-8.11
0.47-6.11 0.90-6.40
1.51-11.1
1.46-10.0
p value p value
0.095
0.660
0.044
0.023
0.017
0.415 0.079 0.006
based study done in a municipality of the metropolitan region of the city of Rio de Janeiro
in 2005 found a prevalence of food insecurity of 53.8%, and households in the economic class E had a prevalence of severe food insecurity of 44.6% (p<0.001)28. The present study found that the highest frequency of mild and moderate/ severe food insecurity occurred among elderly in the economic classes D+E (32.7%) and C (20.3%), and those in the classes D+E were almost three times more likely to be mildly food insecure (p=0.011). Food insecurity is unexpected in higher economic classes. However, in the present sample, 12.9% of the elderly in classes A+B were food insecure. All the moderately/severely food insecure elderly in the classes A+B were taking medication daily (data not shown), so it is possible that other expenses, such as those with pharmaceuticals, affected their food purchasing power. Food insecurity in higher economic classes may be associated with expenses, such as pharmaceuticals not provided by the government, paid medical visits, health insurance, or even financial aid to other family members.
Despite the plenty of evidence that food insecurity is inversely associated with education level and income since most elderly belong to a generation with low education level, this study found that type of house is a stronger indicator of socioeconomic status as it was more strongly associated with mild and moderate/severe food insecurity. Socioeconomic status reflects asset acquisition, ownership, and accumulation over the years. Food insecurity and housing instability may also be responsible for low access to health care, as reported by Kushel et al.29, who studied a sample of adult, low-income Americans and found that 23.6% experienced housing instability and 42.7% experienced food insecurity.
Food security status was not associated with frequenting soup kitchens. In fact, the frequency of mild food insecurity was slightly greater among the elderly who frequented the soup kitchen (52.3% vs 47.7%). This finding indicates that soup kitchens are in fact reaching their target population, that is, socially vulnerable elderly19. Although the food security status of
soup kitchen users and non-users did not differ significantly, the socioeconomic status of non-users was significantly better than that of non-users (data not shown). If soup kitchens did not exist, the prevalence of food insecurity among their users would be higher than that of their non-user neighbors. Hence, soup kitchens and community kitchens are a strategy to increase the vulnerable population’s access to food. Additionally, given that not all elderly are capable of going to a soup kitchen and that there may be a number of nutritionally vulnerable (underweight) elderly ignored by this study, the creation of programs that deliver meals to these people’s homes should be considered. Between 1999 and 2000 in the USA, roughly 39.6% of the food insecure elderly were benefited by at least one food assistance program, and 11.0% received their meals at home or in retirement homes9.
Food security is one of the many requirements for a population to be healthy and well nourished9. Consistent with other studies26,30, the elderly who reported regular, poor, or very poor health were more likely to be food insecure. According to Ramsey et al.26, the physiological and psychological changes caused by nutritional deficiencies and the concern caused by restricted access to food may explain the association between food insecurity and many diseases. A study conducted in Canada in 1996 with 153 women found that those who had experienced food insecurity in the past twelve months, including the past thirty days, were twice as likely to report activity limitations due to disease or disability30.
type 2 diabetes found that moderate/severe food insecurity was associated with worse glycemic control (p=0.04), and, according to the authors, this may indicate that food insecure individuals are more susceptible to diabetes complications32. Similarly, food insecure Australians were more likely to require hospitalization (OR=2.17; 95%CI=1.14-4.14)26.
The present study found that mildly food insecure elderly were approximately twice as likely to be obese. Food insecurity does not always reflect undernutrition. Overweight and obesity may be associated with food insecurity because monotonous diets and diets high in simple carbohydrates and fats are inexpensive, a strategy used against food insecurity17,33. A higher frequency of obesity (BMI ≥30kg/m²) was found in severely food insecure diabetics (p=0.023)32.
No study was found in the literature reporting an association between cancer and food insecurity. The present study included an analysis stratified by nutritional status and smoking status to investigate possible confounders or interactions between these variables. A limitation is that we did not investigate the type of cancer or the time since diagnosis. A study with a convenience sample of 115 cancer patients of an outpatient clinic in Kentucky, USA, showed that 17.4% were food insecure, 7.8% severely so, and that the rates of nutritional risk and depression were higher among food insecure patients, who also had lower quality of life. The authors mentioned that the cross-sectional nature of the study was a limitation, but they suggested that food insecurity may be an important consideration for oncology practice, especially regarding patients of low socioeconomic status34.
Finally, the consumption of fruits and meats tended to decrease as food insecurity increased. The association between food insecurity and low intake of fruits, vegetables, and meats has been described by other studies30,35. In Campinas, a cross-sectional, population-based study done in 2003 with households with elderly individuals found that food secure families were significantly
more likely to consume leaf vegetables (OR=7.4; 95%CI=2.9-19.6), meats (OR=3.8; 95%CI=1.9-7.3), and fruits (OR=3.6; 95%CI=1.8-6.9) on a daily basis10. The high cost of these foods may be one of the main reasons for their low consumption, especially by lower socioeconomic classes and individuals at higher risk of food insecurity. For the Associação Brasileira pela Nutrição e Direitos Humanos (Brazilian Association for Nutrition and Human Rights), “the increase in food cost is the most visible of a set of factors that have historically promoted social exclusion and the systematic violation of the human right to adequate food” (p.14)36.
C O N C L U S I O N
Public policy makers must be aware that food insecure elderly are more susceptible to chronic diseases and have worse socioeconomic condition, worse nutritional status, and inappropriate diets. Welfare programs should expand the number of soup kitchens, since the price of a meal in these facilities is much lower than that of the same meal made at home, especially for the elderly who are often unable to buy at cheaper and better grocery stores. Additionally, we suggest the development of a system to deliver meals to the homes of food insecure elderly who are bedridden or homebound.
A C K N O W L E D G E M E N T S
We thank Fundação de Amparo à Pesquisa do Estado de São Paulo for sponsoring the study. We also thank Professor Dr. Ana Maria Segall-Correa for the rich discussions she has encouraged about food insecurity since 2005.
C O N T R I B U T O R S
R E F E R E N C E S
1. Brasil. Lei nº 11.346, de 15 de julho de 2006. Cria o Sistema Nacional de Segurança Alimentar e Nutricional (SISAN) com vistas em assegurar o direito humano à alimentação adequada e dá outras providências. Diário Oficial da Presidência da República. Brasília, 15 de setembro de 2006. 2. Rose DD. Interventions to reduce household food
insecurity: A synthesis of current concepts and approaches for Latin America. Rev Nutr. 2008; 21:159-73. doi: 10.1590/S1415-52732008000 700014.
3. Bickel G, Nord M, Price C, Hamilton W, Cook J. Measuring food security in the United States: Guide to measuring household food security. Alexandria: United States Departament of Agriculture; 2000. 4. Radimer KL, Olson CM, Greene JC, Campbell CC,
JP. H. Understanding hunger and developing indicators to assess it in women and children. J Nutr Educ. 1992; 24(1):36-44. doi: 10.1016/j.bbr.201 1.03.031.
5. Coates J, Frongillo EA, Rogers BL, Webb P, Wilde PE, Houser R. Commonalities in the experience of household food insecurity across cultures: What are measures missing? J Nutr. 2006; 136(5):1438S-48S. 6. Carvalho JAM, Garcia RA. O envelhecimento da população brasileira: um enfoque demográfico. Cad Saúde Pública. 2003; 19:725-33. doi: 10.1590/ S0102-311X2003000300005.
7. Brasil. Ministério da Saúde. Informações de saúde: população residente - Brasil. Brasília: Ministério da Saúde; 2011 [acesso 2011 nov 24]. Disponível em: <http://tabnet.datasus.gov.br>.
8. Coleman-Jensen A, Nord M, Andrews M, Carlson S. Program Household Food Security in the United States in 2010. Alexandria: United States Department of Agriculture; 2011.
9. Nord M. Food security rates are high for elderly households: Economic research Service, USDA. Food Rev. 2002; 25(2):19-24.
10. Instituto Brasileiro de Geografia e Estatística. Pes-quisa nacional por amostra de domicílios: Seguran-ça Alimentar 2004/2009. Rio de Janeiro: IBGE; 2010.
11. Rosa TEC, Mondini L, Gubert MB, Sato GS, Benício MHDA. Segurança alimentar em domicílios che-fiados por idosos, Brasil. Rev Bras Geriatr Gerontol. 2012; 15(1):69-77. doi: 10.1590/S1415-790X2011 000300005.
12. Instituto Brasileiro de Geografia e Estatística. Pes-quisa nacional por amostra de domicílios: Segu-rança Alimentar 2004. Rio de Janeiro: IBGE; 2006.
13. Marín-León L, Segal-Corrêa AM, Panigassi G, Maranha LK, Sampaio MFA, Pérez-Escamilla R. A percepção de insegurança alimentar em famílias com idosos em Campinas, São Paulo, Brasil. Cad Saúde Pública. 2005; 21(5):1433-40. doi: 10.1590/ S0102-311X2005000500016.
14. World Health Organization. Global strategy on diet, physical activity and health. Geneva: WHO; 2004. 15. Wilde PE, Peterman JN. Individual weight change is associated with household food security status. J Nutr. 2006; 136(5):1395-400.
16. Kim K, Frongillo EA. Participation in food assistance programs modifies the relation of food insecurity with weight and depression in elders. J Nutr. 2007; 137(4):1005-10.
17. Kepple AW, Segall-Corrêa AM. Conceituando e me-dindo segurança alimentar e nutricional. Ciênc Saúde Colet. 2011; 16:187-99. doi: 10.1590/S14 13-81232011000100022.
18. Brasil. Ministério do Desenvolvimento Social e Combate à Fome. Restaurantes populares. Brasília: MDS; [s.d.] [acesso 2011 out 14]. Disponível em: <http://www.mds.gov.br/segurancaalimentar/ equipamentos/restaurantespopulares>.
19. São Paulo. Secretaria de Estado de Desenvolvimento Social. Bom Prato. São Paulo: Secretaria de Estado de Desenvolvimento Social [s.d.] [acesso 2011 nov 29]. Disponível em: <http://www.desenvolvimento social.sp.gov.br/portal.php/bomprato>.
20. Associação Brasileira de Empresas de Pesquisa. Critério de classificação econômica Brasil. São Paulo: ABEP; 2008 [acesso 2013 jun 5]. Disponível em: <www.abep.org/novo/Content.aspx?Content ID=301> .
21. Troiano R, Frongillo Jr E, Sobal J, Levitsky D. The relationship between body weight and mortality: A quantitative analysis of combined information from existing studies. Int J Obes Relat Metab Disord. 1996; 20(1):63-75.
22. Hoffmann R. Determinantes da insegurança ali-mentar no Brasil: análise dos dados da PNAD de 2004. Segur Aliment Nutr. 2008;15 (1):49-61. 23. Marín-León L, Francisco PMSB, Segall-Corrêa AM,
Panigassi G. Bens de consumo e insegurança ali-mentar: diferenças de gênero, cor de pele autorrefe-rida e condição socioeconômica. Rev Bras Epidemiol. 2011; 14:398-410. doi: 10.1590/S1415-790X20 11000300005.
24. Gubert MB, Santos LMP. Determinantes da inse-gurança alimentar no Distrito Federal. Comum Ciênc Saúde. 2009; 20(2):143-50.
instru-mento de medida aos primeiros resultados na-cionais. In: Ministério do Desenvolvimento Social e Combate à Fome. Avaliação de políticas e pro-gramas do Ministério do Desenvolvimento Social: resultados: Segurança Alimentar e Nutricional. Brasília: MDS; 2007.
26. Ramsey R, Giskes K, Turrell G, Gallegos D. Food insecurity among adults residing in disadvantaged urban areas: Potential health and dietary consequences. Public Health Nutr. 2012; 15(2): 227-37. doi: 10.1017/S1368980011001996. 27. Dean W, Sharkey J, Johnson C. Food insecurity is
associated with social capital, perceived personal disparity, and partnership status among older and senior adults in a largely rural area of Central Texas. J Nutr Gerontol Geriatr. 2011; 30(2):169-86. doi: 10.1080/21551197.2011.567955.
28. Salles-Costa R, Pereira RA, Vasconcellos MTL, Veiga GV, Marins VMR, Jardim BC, et al. Associação entre fatores socioeconômicos e insegurança alimentar: estudo de base populacional na Região Metro-politana do Rio de Janeiro, Brasil. Rev Nutr. 2008; 21(Supl):99-109.
29. Kushel MB, Gupta R, Gee L, Haas JS. Housing instability and food insecurity as barriers to health care among low-income Americans. J Gen Intern Med. 2006; 21(1):71-7. doi: 10.1111/j.1525-14 97.2005.00278.x.
30. Tarasuk VS. Household food insecurity with hunger is associated with women’s food Intakes, health and household circumstances. J Nutr. 2001; 131(10): 2670-6.
31. Seligman HK, Bindman AB, Vittinghoff E, Kanaya AM, Kushel MB. Food insecurity is associated with diabetes mellitus: Results from the national health examination and nutrition examination survey (NHANES) 1999-2002. J Gen Intern Med. 2007; 22(7):1018-23.
32. Bawadi HA, Ammari F, Abu-Jamous D, Khader YS, Bataineh Sa, Tayyeme RF. Food insecurity is related to glycemic control deterioration in patients with type 2 diabetes. Clini Nutr. 2012; 31:250-4. doi: 10.1016/j.clnu.2011.09.014.
33. Panigassi G, Segall-Corrêa AM, Marin-León L, Pérez--Escamilla R, Maranha LK, Sampaio MFA. Insegu-rança alimentar intrafamiliar e perfil de consumo de alimentos. Rev Nutr. 2008; 21:135s-44s. doi: 10.1590/S1415-52732008000700012.
34. Simmons LA, Modesitt SC, Brody AC, Leggin AB. Food insecurity among cancer patients in Kentucky: A pilot study. J Oncol Pract. 2006; 2(6):274-9. 35. Kirkpatrick SI, Tarasuk V. Food insecurity is
associated with nutrient inadequacies among Canadian Adults and Adolescents. J Nutr. 2008; 138(3):604-12.
36. Associação Brasileira pela Nutrição e Direitos Humanos. Direito humano à alimentação adequada no contexto da segurança alimentar e nutricional. Brasília: Abrandh; 2010.