Household appliances and
food insecurity: gender,
referred skin color and
socioeconomic differences
Bens de consumo e insegurança
alimentar: diferenças de gênero, cor
de pele autorreferida e condição
socioeconômica
Leticia Marin-LeonI
Priscila Maria Stolses Bergamo FranciscoI Ana Maria Segall-CorrêaI
Giseli PanigassiI
IDepartamento de Medicina Preventiva e Social da Faculdade de Ciências
Médicas da Universidade Estadual de Campinas – Campinas (SP), Brasil
Trabalho realizado no Departamento de Medicina Preventiva e Social da Faculdade de Ciências Médicas da Universidade Estadual de Campinas – Campinas (SP), Brasil.
Fonte de financiamento: nenhuma.
Correspondência: Leticia Marin-Leon – Rua dos Alecrins 234 apto. 62 – Cambui – CEP: 13024-410 – Campinas (SP), Brasil – E-mail : [email protected]
Conflito de interesse: nada a declarar.
Abstract
Objective: Data from the National Household Survey 2004 was analyzed to compare diferences in prevalence among moderate or severe food insecurity. Also, it was compared food security or mild food insecurity households in relation to the assets and other socioeconomic and demographic conditions of the household. Method: Private permanent households, with per capita monthly income of up to one minimum wage and with the Brazilian Food Insecurity Scale answered by a household resident were studied (n=51,357). Associa-tion of variables with the dependent varia-ble (food security) was veriied using χ2 test,
with 5% signiicance level. Crude prevalen-ce ratio, respective 95% conidenprevalen-ce inter-val and adjusted analyses were carried out using Poisson multiple regression Stata 8.0. It considers the weights of the complex sampling design of the survey. Results: he
among those headed by women and black people. Among poor people, the absen-ce of assets identiies the most vulnerable population to food insecurity and may be used as complementary indicator, mainly in local studies with poor technical resources for data collection and more sophisticated analyzes.
Keywords: social conditions; food security; social inequality; poverty; family character-istics; socioeconomic factors.
Resumo
Objetivo: Com base nos dados da Pesqui-sa Nacional por Amostra de Domicílios (PNAD, 2004), foram comparadas as diferenças na prevalência de insegurança moderada/grave em relação à segurança alimentar, e insegurança leve quanto à posse de bens de consumo e outras condi-ções socioeconômicas e demográficas. Métodos: Foram estudados os domicílios particulares permanentes, com rendimen-to domiciliar per capita de até um salário mínimo, utilizando-se a Escala Brasilei-ra de InseguBrasilei-rança Alimentar respondida por morador do domicílio (n=51.357). A associação entre as variáveis e a variá-vel dependente (segurança alimentar) foi verificada pelo teste do χ2 com nível
de significância de 5%. Foram calculadas razões de prevalência brutas e intervalos de confiança de 95% e a análise ajusta-da foi conduziajusta-da por meio de regressão múltipla de Poisson, utilizando Stata 8.0, que incorpora as ponderações do desenho amostral com delineamento complexo. Resultados: A renda domiciliar mensal
Introduction
The Brazilian Food Insecurity Scale (EBIA), used in the National Household Sample Survey (PNAD) 20041 is a direct
measure of the interviewee´s food insuffi-ciency and his family in the three months preceding the survey at several levels of relative intensity2.
EBIA is an adaptation and validation for Brazil of the Household Food Security Scale Measurement3 that was built in
the United States from qualitative and quantitative surveys of the 1980s4-6. It is an
instrument that by enquiring for daily life access to food leads the respondents to the symbolic, cultural and social aspects of feeding, but does not replace the indirect instruments to measure food insecurity vulnerability, such as income and other social conditions linked to poverty.
The inclusion of this scale in the PNAD-2004 answers the need for infor-mation on the dimension of food insecurity and its population distribution. Using EBIA, the various spheres of government can identify the most vulnerable population and propose actions to assure permanent access to enough quantity and adequate quality of food, which has been recognized as a fundamental human right by the Brazilian legislation7.
In Brazil, using simple descriptive analysis of PNAD 2004 data, it was observed a higher prevalence of moderate or severe food insecurity (MSFI) in households: with low per capita monthly income, those located in rural areas, with at least, one resident under 18 years, female-headed, with low schooling and self-referred black (black or brown)1.
Usually, family income and schooling of heads of household are the most used indicators to define socioeconomic condi-tions. However, income is a questionable reliability variable because informants may refuse to report it or ignore the income of other household members. Some publications have used an index that includes the possession of some home por homens brancos e menores nos de
mulheres negras. Conclusão: Em nível nacional e em domicílios com renda de até um salário mínimo, condições socio-econômicas mais precárias estão associa-das à insegurança alimentar, sendo a situação agravada naqueles chefiados por mulheres e onde residem pessoas de cor autorreferida como negra. A ausên-cia de bens identifica, entre os pobres, a população mais vulnerável à insegurança alimentar e pode se constituir em indica-dor complementar, sobretudo em estudos locais, onde há escassez de recursos técni-cos para coleta de dados e análises mais sofisticadas.
appliances and the schooling of heads of household, as an indicator of socio-economic status8,9, enabling the
classifi-cation of the population into categories of economic classes. In 1997, ABA (Brazilian Association of Advertisers), ABIPEME (Brazilian Association of Market Research Institutes) and ANEP (National Association of Research Companies) published “Criterion Brazil”, which in 2008 edition, published by ABEP (Brazilian Association of Research Companies), has five classes ranging from A (the wealthiest) to E (the poorest), and classes A, B and C have two subclasses10. The questions on household
goods in PNAD-2004 are insufficient for the construction of the economic index of ABIPEME because, although some specific home appliances are listed, it does not quantify each of them and does not report the existence of a housemaid.
By studying families with familiar
per capita monthly income of up to ½ minimum wage (MW), living in metro-politan areas, Torres et al11 pointed out
that between 1995 and 2004 access to household goods increased primarily for telephone, washing machine and refrig-erator. For these authors, the increase in consumption could be explained by the relative reduction in prices of food and home appliances and increase in consumer credit. The “marketing” of the household appliance industry and retailers that have used strategies aimed at stimulating consumption in low income population12, would be an explaining
factor for increase of home goods in this social group.
One advantage of individually analyzed home appliances information would be its use as an indicator of the economic condition of poor population, particularly in cities with limited resources for more complex analysis, as the assembly of an index. It is therefore justified to study the role that household goods have on food security, assuming that home appliances could be related to both food security and food insecurity among poor population.
The aim of this study was to compare, based on PNAD 2004 data, the differences in MSFI prevalence by ownership of home appliances and other demographic and socioeconomic conditions in households with an income of up to one minimum wage per capita by month.
Methods
In PNAD-2004 interviews were conducted in 112,716 households, from which were selected 51,357 permanent private households with a per capita
monthly income up to 1 MW, and those where the Brazilian Food Insecurity Scale (EBIA) was answered by a household resident.
The dependent variable was food security, although it is defined in four categories by EBIA2, for this analysis it
was dichotomized joining the categories with the greatest similarity among themselves, which are food security and mild insecurity (FS/mFI) against moderate and severe insecurity (MSFI). The criterion used to link the categories was the construct similarity between food security, which is the condition of absence of any restriction, and mild insecurity, that can only represent the concern that food may come to lack or decrease the quality of diet, in other words, monotonous diet due to lack of money for greater variety of foods. Moderate insecurity is charac-terized not only by monotony of the diet but also by reduced amount of food at each meal, while severe insecurity also includes reduction in the number of meals representing the experience of hunger. The similarity of the categories that composed the dependent variable is even supported by the psychometric characteristics of the scale, where low severity items have high frequency of positive answers and as the question severity increases towards hunger direction, it reduces the frequency of positive answers13.
income dichotomized in to up to ¼ of MW and more than ¼ up to 1 MW; place of residence (urban vs rural); metropolitan location (yes vs no); characteristics of heads of household (gender, schooling up to 4 years and 5 years or more, self-referred color (white vs black/brown), age (up to 44 years and 45 or more); family characteristics – size (up to 5 vs 6 and more residents) and composition (with children and adolescent under 18 years or without residents under 18 years); elderly residents (60 and more – yes vs no) and home appliances possession (stove of two or more burners, water filter, color television, refrigerator, freezer, washing machine, cell phone, landline phone and microcomputer).
Crude prevalence and 95% confi-dence intervals of lack of specific home appliances were calculated, stratified by income, chi-square test was also used for statistical significance.
Also MSFI crude prevalence and their 95% confidence intervals were estimated, stratified by gender and color of heads of household and possession of a refrigerator, controlled by household income, place of residence, family size and schooling level of heads of household.
The association between independent variables and the dependent variable was tested by chi-square test with significance level of 5%. Crude prevalence ratios and 95% confidence intervals were calculated and adjusted analysis was conducted using Poisson multiple regression14.
In the multivariate model, the inclusion criterion was the association with moderate or severe food insecurity (MSFI) at p=0.20 in bivariate analysis, controlled for income range (up to ¼ of MW and more than ¼ up to 1 MW). As besides the per capita monthly household income it also has been described the associations of severe insecurity1,15 with
some socioeconomic characteristics of the family and heads of households, these independent variables were included in the model as confounding variables.
Backward selection procedure was used to exclude not significant variables and in the final model only remained those with p<0.01.
We decided to build yet another final model excluding the household goods except the refrigerator, considering the comments of a Rio Grande do Sul study12
which described that for the urban poor population the basic appliances are the stove and refrigerator, its absence was perceived as inconceivable. Although the refrigerator represents a monthly expense for the energy it consumes, allows, however, the purchase of perishable foods and their fractionated availability. Stove has an almost universal presence and the refrigerator is present with an intermediate frequency in the population studied. Finally, we present separate models for the four categories of house-holds by color and gender of the heads. It is noteworthy that the number of non-re-sponse to the specific questions used in this study, the highest value was found for schooling (0.6%), other variables do not exceed 0.4%. These records were excluded from multivariate procedures.
Data analysis were performed using STATA 8.0 for analysis procedures whose population survey commands incor-porate the weights required to correct the unequal selection probabilities derived from the complex sampling design.
Being an examination of a public database, managed and executed by IBGE, and the data available without identifying the respondents, the research plan of this study was not submitted to the Ethics Committee in Research, FCM-UNICAMP. The authors declare no conflicts of interest.
Results
households. For each gender and range of schooling, households with no income and with up to ¼-MW showed the highest MSFI prevalence (data not mentioned in tables).
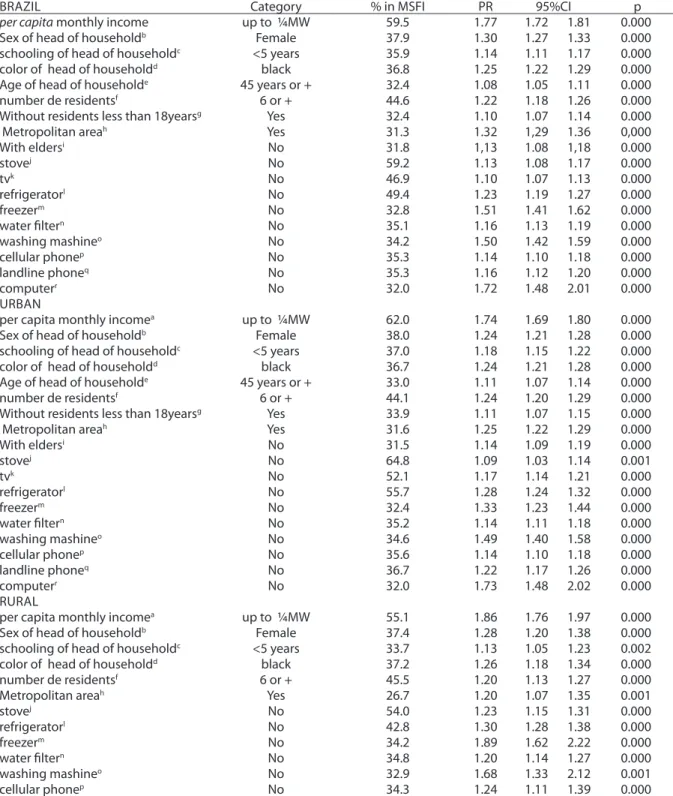
Table 1 shows the percentage of absence of specific home appliances according to per capita monthly household income and food security conditions. MSFI households had a greater proportion than FS/mFI households of absence of each specific home assets and still higher rates of lack of ownership of these assets were observed in households where the per capita monthly income was up to ¼ MW in comparison with households with income >1/4-1 (p<0.001). In households with up to 1 MW, the lack of stove was rare, refrigerator was intermediate, washing machine and phones high, and the presence of a computer was exceptional. Table 2 presents three explanatory models of MSFI. Although per capita monthly income is the variable that presents the
highest prevalence ratio, all variables of specified home appliance remained in the model for Brazil as a whole. In the model for rural households some variables were not significantly different: “lack of resident younger than 18 years”, “lack of elderly”, lack of television, telephone and computer (p>0.01). Both in urban and rural areas, the highest prevalence ratio of MSFI were: in female headed households, black headed, with six or more residents and metropolitan location.
Table 3 shows that households without a refrigerator had a higher prevalence of the MSFI than those with refrigerator, especially those headed by black women (p=57.9%; 95%CI 55.4–60.3). When strat-iied by several variables it was observed among households headed by men and those female-headed and with no refrig-erator, that the households with the highest MSFI prevalence were those with
per capita monthly income up to ¼ MW (59.2% for white male-headed and 76.2 for
Income<1/4 MW Income>1/4 – 1 MW
Specific assets Food Security/
Mild Food Insecurity
Moderate/Severe Food Insecurity
Food Security/ Mild Food Insecurity
Moderate/Severe Food Insecurity
% (95%CI) % (95%CI) % (95%CI) % (95%CI)
Stove 5.7 (4.9–6.5) 12.5 (11.6–13.5)*# 1.9 (1.8–2.1) 4.8 (4.4–5.3)*
TV 31.3 (29.7–33.0) 44.7 (43.3–46.2)*# 14.9 (14.5–15.3) 25.9 (25.0–26.8)*
Refrigerator 33.9 (32.2–35.5) 49.4 (47.9–50.8)*# 13.7 (13.3–14.1) 26.2 (25.3–27.1)*
Freezer 93.1 (92.1–94.0) 97.9 (97.4–98.2)*# 90.1 (89.7–90.4) 96.0 (95.6–96.3)*
Water Filter 56.7 (54.9–58.4) 64.9 (63.5–66.3)*# 49.8 (49.2–50.4) 57.4 (56.4–58.4)*
Washing machine 89.8 (88.6–90.9) 96.8 (96.2–97.3)*# 81.1 (80.6–81.6) 91.6 (91.0–92.2)*
Cellular Phone 79.4 (78.0–80.8) 87.7 (86.8–88.7)*# 64.4 (63.8–65.0) 74.3 (73.4–75.2)*
Landline Phone 85.0 (83.7–86.3) 92.2 (91.4–92.9)*# 67.0 (66.4–67.6) 77.7 (76.8–78.5)*
Computer 97.5 (96.8–98.0) 99.6 (99.4–99.8)*# 95.8 (95.6–96.1) 98.7 (98.4–98.9)*
Table 1. Absence of specific assets by household monthly per capita income bracket and food security condition in Brazil
Tabela 1. Ausência de bens específicos segundo faixa de renda domiciliar mensal per capita e condição de segurança alimentar no Brasil
Source: PNAD, 2004.
*p<0,001; #p<0,001 in the comparison between income groups in moderate/severe food insecurity. Fonte: PNAD, 2004.
Table 2. Prevalence, prevalence ratio (PR) and Poisson Regression Model for moderate/severe food insecurity by charac-teristics of the head of the household and residence situation. Brazil, PNAD 2004
Tabela 2. Prevalência, razão de prevalência e modelo de regressão de Poisson para insegurança moderada ou grave segundo características da pessoa de referência (PR) e situação de residência. Brasil, PNAD 2004
Prevalence Ratio (PR) was calculated in relation to the reference category food security/ mild insecurity and the other reference categories “>1/4 to <1 minimum wage (MW) a”, “maleb”, “5 years or more of schoolingc”, “ white color”, “head of household with up to 44 years olde”, “up to 5 people in the
householdf”, “with residents of <18 yearsg”, “not metropolitan areah”, “without elders in the householdi” and “presence of each assetjklmnopqr”.
A razão de prevalência (PR) foi calculada em relação à categoria de referência SA/IL e as respectivas categorias de referência “>1/4 a <1 SMa”, “sexo masculinob”, “5
anos ou mais de estudoc”, “cor brancad”, “pessoa de referência com até 44 anose”, “até 5 moradores no domicíliof”, “com moradores <18 anosg”, “área não
metropoli-tanah”, “sem idosos no domicílioi” e “presença de cada bemjklmnopqr”.
BRAZIL Category % in MSFI PR 95%CI p
per capita monthly income up to ¼MW 59.5 1.77 1.72 1.81 0.000
Sex of head of householdb Female 37.9 1.30 1.27 1.33 0.000
schooling of head of householdc <5 years 35.9 1.14 1.11 1.17 0.000
color of head of householdd black 36.8 1.25 1.22 1.29 0.000
Age of head of householde 45 years or + 32.4 1.08 1.05 1.11 0.000
number de residentsf 6 or + 44.6 1.22 1.18 1.26 0.000
Without residents less than 18yearsg Yes 32.4 1.10 1.07 1.14 0.000
Metropolitan areah Yes 31.3 1.32 1,29 1.36 0,000
With eldersi No 31.8 1,13 1.08 1,18 0.000
stovej No 59.2 1.13 1.08 1.17 0.000
tvk No 46.9 1.10 1.07 1.13 0.000
refrigeratorl No 49.4 1.23 1.19 1.27 0.000
freezerm No 32.8 1.51 1.41 1.62 0.000
water filtern No 35.1 1.16 1.13 1.19 0.000
washing mashineo No 34.2 1.50 1.42 1.59 0.000
cellular phonep No 35.3 1.14 1.10 1.18 0.000
landline phoneq No 35.3 1.16 1.12 1.20 0.000
computerr No 32.0 1.72 1.48 2.01 0.000
URBAN
per capita monthly incomea up to ¼MW 62.0 1.74 1.69 1.80 0.000
Sex of head of householdb Female 38.0 1.24 1.21 1.28 0.000
schooling of head of householdc <5 years 37.0 1.18 1.15 1.22 0.000
color of head of householdd black 36.7 1.24 1.21 1.28 0.000
Age of head of householde 45 years or + 33.0 1.11 1.07 1.14 0.000
number de residentsf 6 or + 44.1 1.24 1.20 1.29 0.000
Without residents less than 18yearsg Yes 33.9 1.11 1.07 1.15 0.000
Metropolitan areah Yes 31.6 1.25 1.22 1.29 0.000
With eldersi No 31.5 1.14 1.09 1.19 0.000
stovej No 64.8 1.09 1.03 1.14 0.001
tvk No 52.1 1.17 1.14 1.21 0.000
refrigeratorl No 55.7 1.28 1.24 1.32 0.000
freezerm No 32.4 1.33 1.23 1.44 0.000
water filtern No 35.2 1.14 1.11 1.18 0.000
washing mashineo No 34.6 1.49 1.40 1.58 0.000
cellular phonep No 35.6 1.14 1.10 1.18 0.000
landline phoneq No 36.7 1.22 1.17 1.26 0.000
computerr No 32.0 1.73 1.48 2.02 0.000
RURAL
per capita monthly incomea up to ¼MW 55.1 1.86 1.76 1.97 0.000
Sex of head of householdb Female 37.4 1.28 1.20 1.38 0.000
schooling of head of householdc <5 years 33.7 1.13 1.05 1.23 0.002
color of head of householdd black 37.2 1.26 1.18 1.34 0.000
number de residentsf 6 or + 45.5 1.20 1.13 1.27 0.000
Metropolitan areah Yes 26.7 1.20 1.07 1.35 0.001
stovej No 54.0 1.23 1.15 1.31 0.000
refrigeratorl No 42.8 1.30 1.28 1.38 0.000
freezerm No 34.2 1.89 1.62 2.22 0.000
water filtern No 34.8 1.20 1.14 1.27 0.000
washing mashineo No 32.9 1.68 1.33 2.12 0.001
black female-headed) and those with 6 or more residents (54.2% and 70.0% for white male and black female-headed respec-tively). Besides these variables, households headed by women and located in metro-politan areas also had high MSFI preva-lence (56.6% among white-headed and
68.5% among black-headed). In this table the statistical signiicance between types of households with diferent characteristics of gender and color of heads of household and possession of a refrigerator was veriied by lack of overlap of the 95% conidence interval of the MSFI prevalence. Among
Variable
Male Female
White Black White Black
Refrigerator Refrigerator Refrigerator Refrigerator
%Yes %No %Yes %No %Yes %No %Yes %No
95%CI 95%CI 95%CI 95%CI 95%CI 95%CI 95%CI 95%CI
Per capita monthly Income
None 18.1 40.9 28.5 50.6 27.5 46.8 39.0 57.9
17.4–18.9 38.7–43.1 27.8–29.3 49.2–51.9 26.0–29.0 42.8–50.9 37.7–40.4 55.4–60.3
>¼-1MW 15.4 31.6 24.0 39.8 24.7 36.6 34.4 48.8
14.7–16.1 29.2–34.1 23.2–24.8 38.1–41.4 23.2–26.3 32.3–41.2 32.9–35.8 45.8–51.7
up to ¼SM 43.0 59.2 54.5 68.5 51.8 78.0 64.5 76.2
40.1–46.0 55.4–63.0 52.4–56.6 66.5–70.5 46.6–57.0 70.6–84.0 61.0–67.9 72.4–79.6
Schooling of Head of Household
5 years or + 15.1 36.1 23.0 45.7 24.2 51.5 34.5 55.1
14.1–16.1 31.8–40.5 22.0–24.1 42.8–48.7 22.2–26.4 43.7–59.2 32.6–36.5 50.2–60.0
0-4 years 21.3 42.4 32.6 51.6 30.0 44.8 42.2 58.6
20.2–22.4 39.9–44.9 31.6–33.7 50.2–53.1 27.9–32.1 40.2–49.6 40.4–44.1 55.8–61.4
Metropolitan Area
No 17.5 40.3 28.0 50.0 26.2 45.0 38.1 55.7
16.6–18.3 38.0–42.6 27.2–28.9 48.6–51.4 24.5–28.1 40.6–49.5 36.4–39.8 52.9–58.4
Yes 20.1 47.6 29.8 56.5 29.8 56.6 40.6 68.5
18.6–21.6 41.2–54.2 28.4–31.2 52.7–60.3 27.4–32.4 47.3–65.4 38.4–42.8 63.8–72.8
Residence Situation
Rural 14.9 35.7 27.0 45.2 24.1 36.6 36.4 47.0
13.4–16.4 32.8–38.6 25.4–28.7 43.4–47.1 19.1–29.9 29.3–44.6 31.8–41.3 42.3–51.7
Urban 18.9 47.2 28.9 57.0 27.8 50.5 39.2 62.2
18.1–19.8 44.0–50.5 28.1–29.7 55.1–58.9 26.3–29.3 45.8–55.2 37.8–40.7 59.4–64.9
Number of Residents
1- 5 16.8 38.2 26.6 47.6 27.1 44.8 38.3 56.5
16.1–17.6 35.9–40.6 25.8–27.4 46.1–49.1 25.6–28.6 40.6–49.1 36.9–39.7 53.9–59.0
6 or + 31.1 54.2 38.8 61.7 36.8 67.2 47.7 70.0
28.3–34.0 48.8–59.5 36.8–40.9 58.9–64.5 29.2–45.2 53.1–78.7 42.8–52.7 62.3–76.7
Table 3. Prevalence of moderate or severe food insecurity by sex and color of the head of the household and refrigerator ownership and other socioeconomic and demographic characteristics
Table 4. Poisson multiple regression model for moderate or severe food insecurity by sex, color of the head of the household, refrigerator ownership and some characteristics of the head of the households and residence. Brazil, PNAD 2004
Tabela 4. Modelo múltiplo de regressão de Poisson para insegurança moderada ou grave segundo sexo, cor autorreferida da pessoa de referência (PR), posse ou não de geladeira e algumas caracterís-ticas da pessoa de referência e situação de residência. Brasil, PNAD 2004
Category PR 95%CI p
BRAZIL
gender of Head of Household Female 1.29 1.25–1.33 0.000
color of Head of Household black 1.23 1.20–1.28 0.000
per capita monthly income up to ¼ MW 1.90 1.85–1.96 0.000
schooling of Head of Household <5 years 1.31 1.27–1.35 0.000
number of residents 6 or + 1.18 1.14–1.22 0.000
residence situation Urban 1.34 1.30–1.39 0.000
metropolitan area Yes 1.17 1.13–1.20 0.000
region North 1.34 1.26–1.43 0.000
Northeast 1.38 1.31–1.46 0.000
refrigerator No 1.42 1.38–1.46 0.000
Male White Head of Household
per capita monthly income up to ¼ MW 2.20 2.04–2.36 0.000
schooling of Head of Household <5 years 1.39 1.29–1.49 0.000
number of residents 6 or + 1.37 1.26–1.48 0.000
residence situation Urban 1.55 1.43–1.68 0.000
metropolitan area Yes 1.20 1.11–1.31 0.000
region North 1.36 1.20–1.55 0.000
Northeast 1.52 1.39–1.67 0.000
refrigerator No 1.60 1.48–1.73 0.000
Male Black Head of Household
per capita monthly income up to ¼ MW 1.85 1.77–1.92 0.000
schooling of Head of Household <5 years 1.31 1.26–1.38 0.000
number of residents 6 or + 1.14 1.09–1.19 0.000
residence situation Urban 1.33 1.27–1.39 0.000
metropolitan area Yes 1.19 1.13–1.24 0.000
region North 1.27 1.14–1.41 0.000
Northeast 1.32 1.19–1.46 0.000
refrigerator No 1.42 1.37–1.48 0.000
Female White Head of Household
per capita monthly income up to ¼ MW 2.13 1.94–2.34 0.000
schooling of Head of Household <5 years 1.24 1.12–1.36 0.000
residence situation Urban 1.28 1.09–1.51 0.002
geladeira No 1.49 1.34–1.66 0.000
Female Black Head of Household
per capita monthly income up to ¼ MW 1.73 1.65–1.83 0.000
schooling of Head of Household <5 years 1.23 1.16–1.31 0.000
residence situation Urban 1.24 1.13–1.35 0.000
metropolitan area Yes 1.10 1.04–1.16 0.001
region North 1.26 1.09–1.47 0.002
Northeast 1.22 1.06–1.41 0.006
households in metropolitan areas and with six or more residents no signiicantly diferent MSFI prevalence were observed between black and white–headed house-holds without a refrigerator.
The multiple logistic model for MSFI presented in Table 4 differs from model in Table 2 in that the only home appliance included was the refrigerator. The categories with no significative values (p≥0.01) were excluded from this table. For Brazil as a whole and consid-ering gender and color of the heads, the highest prevalence ratio were observed in per capita monthly income of up to ¼ MW (PR=1.90; 95%CI 1.85-1.96) and lack of refrigerator (PR=1.42; 95%CI 1.38-1.46). Comparing to the other gender and color groups, white male-headed households had the highest PR for MSFI. Among white and black female-headed households, the number of residents equal or higher than 6 was not a determinant of MSFI. Living in the North and Northeast regions and in metropolitan areas, were also not determining factors of MSFI among white female-headed households.
Discussion
The main limitation of this study is the cross-sectional design of the PNAD restricting the inference of causality.
Whereas the prevalence of MSFI for Brazil was 18.8%1, it was found that
among households with up to 1 MW, and whose heads had 4 years of schooling or less the MSFI prevalence was higher than the national average. Households without any specific home appliances showed higher MSFI prevalence than the national average, regardless of gender and schooling level of heads of household.
In the model developed for the general population of Brazil, the per capita
monthly household income was the variable with strongest association with food security, both in urban and rural areas, experiencing high prevalence ratio for moderate or severe food insecurity
in households headed by women, black, with six or more residents, metropolitan location and with lack of specific home appliances (stove, water filter, refrig-erator, freezer, washing machine and cell phone). The income importance was pointed in a study that also used PNAD 2004 data, noting that every R$10.00 (ten reais) added to the family income, from some social income transfer program, the household chances of food security increased in 8%16.
Comparing urban with rural house-holds it was observed that the lower food restriction in rural location is probably related to food production for self-consumption, and lower spending on non-food items such as housing, trans-portation, clothing, purchase of vehicles, health care, and home maintenance. In the Household Budget Survey (POF) 2008-200917 it was observed that total
rural expenditures represented one-tenth of urban expenditure. It was also observed that housing expenses were much higher than food expenses in urban areas (36
vs 18.8%) than in rural ones (29.5 vs
26.5%)17. The non-monetary expenses,
those obtained through own production, hunting, fishing, gathering, exchange, donation or business withdrawal, reached 20.8% in rural areas while in urban areas was 14.7%17.
It also contributes to the urban/rural differences, the family composition, such as having elderly member and younger than 18 years. As noted by a study with an urban population in Campinas18,
house-holds with elderly residents benefit from their income, from pensions, as well as the benefits from income transfer programs19.
In urban areas the risk of MSFI increased in households without elderly. Children less than 18 years in urban areas represent a higher expenditure on food and non-food items. Probably the higher risk of MSFI in urban households headed by a person 45 years or more is related to the greater difficulty of remaining employed19, while
highest unemployment (16.8%) and lowest proportion of formal work contractamong the population with the lowest tenth of
per capita monthly household income20.
It is noteworthy that, considering only poor population, inequality is still evident and it is related to self-referred color, as described by Pinheiro et al.19, these
differ-ences are greater when the home lacks in refrigerator, washing machine, TV and telephone.
In relation to gender differences, it is important to point out that even though household appliances integrate the feminine symbolic space12, the
greater lack of these items on female-headed households may point out to the existence of higher responsibility toward the cost of maintaining the equipment or, less debt capacity to acquire them.
Core families, or arrangements with few residents, though they may have lower total household income, generally they have higher resources for food. In this study, was observed a higher risk of MSFI in households with six or more residents in both urban and rural areas. The vulnerability of large families or extended with aggregates, was also observed by Torres et al.11.
Panigassi et al.21 suggested the
possi-bility of using the direct measure of food security assessed by EBIA to complement social indicators and identify groups with social vulnerability. To the traditional indicators, it was added, in this study, the possession of some specific home appliances.
Gender inequality is marked by food restriction of female-headed house-holds, being higher in households that do not have the specific home appliances studied. Even within a poor population, households with a per capita monthly income of less than ¼ of MW had higher MSFI prevalence and even higher among female-headed households. Although income inequality is the most important factor in determining food restriction, low schooling and being black contributed
to differences in MSFI. Still other condi-tions that contribute to inequalities in access to food are: living in urban areas and large size family. By stratifying house-holds by gender and skin color of heads of household the MSFI inequality is more evident. Households with a refrigerator and white male-headed had the lowest restriction and those without a refrig-erator and headed by black women the highest. White female-headed house-holds and those headed by black men had a similar condition of food restriction. Among the four groups of households, low income was the condition of greatest risk for MSFI and in all groups the risk of food restriction related to lack of refrigerator was also noteworthy.
The use of household goods individ-ually, enabled more detailed findings than if a consumption index had been used. But when the goal is the assessment of socioeconomic status and analysis of food security conditions, the use of an indicator of family income is still indispensable.
As noted by Panigassi et al.22 and
Salles-Costa et al.9 households in food
insecurity have a reduced consumption of fruits, vegetables and meats. Thus the income has the explanatory power of FI and could not be otherwise since the Brazilian society is very monetized and, most of the questions in EBIA inquire the situation of food restriction related to lack of money.
It was not confirmed, based on data from PNAD 2004, that household goods that represent an operation cost or monthly expenses would compete with the purchase of food and thus would be associated with MSFI. Rather, it was the absence of specific appliances that was associated with this condition and reflects the current and past poverty situation of these families.
References
1. Instituto Brasileiro de Geograia e Estatística (IBGE). Pesquisa Nacional por Amostra de Domicílios: PNAD 2004: suplemento de segurança alimentar. Rio de Janeiro: IBGE; 2006.
2. Pérez-Escamilla R, Segall-Correa AM, Maranha LK, Sampaio MF, Marín-León L, Panigassi G. An adapted version of the US Department of Agriculture Food Insecure Module is a valid tool for assessing food insecurity in Campinas, Brasil. J Nutr. 2004;134:1923-8.
3. Bickel GW, Nord M, Hamilton W, Cook J. Guide to measuring household food security in the United States. Revised 2000. Washington, DC: USDA Economic Research Service; 2000.
4. Radimer KL, Olson CM, Campbell CC. Development of indicators to assess hunger. J Nutr 1990; 120: 1544-8.
5. Wehler, C. Community Childhood Hunger Identiication Project: New Haven Risk Factor Study. Connecticut Association for Human Services, Hartford, CT; 1987.
6. Campbell C. Food Insecurity: a nutritional outcome or a predictor variable? J Nutr. 1991;121:408-15.
7. Brasil. Presidência da República Casa Civil Subcheia para Assuntos Jurídicos Lei Nº 11.346, de 15 de Setembro de 2006. Cria o Sistema Nacional de Segurança Alimentar e Nutricional - SISAN com vistas em assegurar o direito humano à alimentação adequada e dá outras providências [internet]. [citado 04 set 2010]. Disponível em: <https:// www.planalto.gov.br/Consea/3Conferencia/Static/ Documentos/LOSAN%2520FINAL.pdf>.
8. Dachs JN, Santos W, Rocha AP. Auto-avaliação do estado de saúde no Brasil: análise dos dados da PNAD/2003. Ciênc Saúde Coletiva. 2006;11:887-94.
9. Salles-Costa R, PereiraRA, Vasconcellos MTL, Veiga GV, MarinsVMR, Jardim BC, et al. Associação entre fatores socioeconômicos e insegurança alimentar: estudo de base populacional na Região Metropolitana do Rio de Janeiro, Brasil. Rev Nutr. 2008;21(Suppl):99s-109s
10. Associação Brasileira de Empresas de Pesquisas (ABEP). Critério padrão de classiicação econômica Brasil 2008 [internet]. Junho 2007 [citado 12 fev 2009]. Disponível em: <www.abep.org/codigosguias/Criterio_Brasil_2008.pdf>.
11. Torres HG, Bichir RM, Carpim TP. Uma pobreza diferente? Mudanças no padrão de consumo da população de baixa renda. Novos Estudos Cebrap. 2006;74:17-22.
12. Rocha A, Silva JF. Inclusão social e marketing na base da pirâmide: uma agenda de pesquisa. RAE-eletrônica, v. 7, n. 2, art. 23, jul./dez. 2008 [citado 14 set 2009]. Disponível em: <http://www16.fgv.br/rae/eletronica/index.cfm?FuseAction =Artigo&ID=5367&Secao=ARTIGOS&Volume=7&Numero=2 &Ano=2008>.
13. Hackett M, Melgar-Quiñonez H, Pérez-Escamilla R, Segall-Corrêa AM. Gender of respondent does not afect the psychometric properties of the Brazilian Household Food Security Scale. Int J Epidemiol. 2008;37:766-74.
14. Barros AJ, Hirakata VN. Alternatives for logistic regression in cross-sectional studies: an empirical comparison of models that directly estimate the prevalence ratio. BMC Med Res Methodol. 2003;3:21.
15. Segall-Corrêa AM, Marin-Leon L, Sampaio MFA, Panigassi G, Pérez-Escamilla R. Insegurança alimentar no Brasil: do desenvolvimento do instrumento de medida aos primeiros resultados nacionais. In: Brasil. Ministério do Desenvolvimento Social e Combate à Fome (Org). Avaliação de políticas e programas do MDS: resultados Vol. I. Segurança alimentar e nutricional. Brasília DF: Ministério do Desenvolvimento Social e Combate à Fome; 2007. p. 385-407.
16. Segall-Corrêa AM, Marin-Leon L, Helito H, Pérez-Escamilla R, Santos LMP, Paes-Sousa R. Transferência de renda e segurança alimentar no Brasil: análise dos dados nacionais. Rev Nutr. 2008;21(Suppl):39s-51s.
17. IBGE. Coordenação de Trabalho e Rendimento. Pesquisa de orçamentos familiares 2008-2009: despesas, rendimentos e condições de vida. Rio de Janeiro: IBGE; 2010.
conditions are associated with food insecurity in households, and the situation is worsened in those headed by women and people self-reported as black. he absence of household goods identiies, among the poor, the most vulnerable population to food insecurity and may constitute an additional indicator, mainly in local studies, where there is shortage of technical resources for data collection and more sophisticated analysis.
Collaborators
18. Marín-León L, Segall-CorrêaAM, Panigassi G, Maranha LK, Sampaio MFA, Pérez-Escamilla R. A percepção de insegurança alimentar em famílias com idosos em Campinas, São Paulo, Brasil. Cad Saúde Pública. 2005;21:1433-40.
19. Pinheiro L, Fontoura N, Prata AC, Soares V. Retrato das desigualdades 2ª edição. Brasília: Instituto de Pesquisa Econômica Aplicada (IPEA) e Fundo de Desenvolvimento das Nações Unidas para a Mulher (UNIFEM) setembro 2006. [citado10 jul 2009]. Disponível em: <http://www.ipea.gov.br/ sites/000/2/pdf/retrato_segundaedicao.pdf>.
20. Schwartzman S. Redução da desigualdade, da pobreza, e os programas de transferência de renda. Rio de Janeiro: Instituto de Estudos do Trabalho e Sociedade (IETS) [internet]. Fev 2006. [citado 4 set 2010]. Disponível em:
<http://www.desenvolvimentosocial.sp.gov.br/usr/ File/2006/imprensa/Simon%20Schwartzman_2006.pdf>.
21. Panigassi G, Segall-Corrêa AM, Marín-León L, Perez-Escamilla R, Sampaio MF, Maranha LK. Insegurança alimentar como indicador de iniqüidade: análise de inquérito populacional. Cad Saúde Pública. 2008;24:2376-84.
22. Panigassi G, Segall-Corrêa AM, Marín-León L, Perez-Escamilla R, Maranha LK, Sampaio MF. Insegurança alimentar intrafamiliar e peril de consumo de alimentos. Rev Nutr. 2008;21(Suppl):135s-144s.