1
Article based on the thesis of MF CARVALHO, entitled “Experimental diet based on the foods listed in the Family Budget Survey (POF) - 2002/2003 given during pregnancy and lactation: repercussions on the reproductive performance and physical and biochemical parameters of rat pups”. Universidade Federal de Pernambuco; 2012.
2
Universidade Federal de Pernambuco, Centro Acadêmico de Vitória, Núcleo de Nutrição. Vitória de Santo Antão, PE, Brasil. 3
Acadêmica, Universidade Federal de Pernambuco, Centro Acadêmico de Vitória, Núcleo de Nutrição. Vitória de Santo Antão, PE, Brasil.
4
Universidade Federal de Pernambuco, Centro de Ciências da Saúde, Departamento de Nutrição. Av. Prof. Moraes Rego, 1235, Cidade Universitária, 50670-901, Recife, PE, Brasil. Correspondence to/Correspondência para: E NASCIMENTO. E-mail: <[email protected]>.
Experimental diet based on the foods
listed in the Family Budget Survey
is more detrimental to growth
than to the reflex development of rats
1Dieta experimental baseada em alimentos
listados pela Pesquisa de Orçamento
Familiar é mais agressiva ao crescimento
que ao desenvolvimento reflexo de ratos
Michelle Figueiredo CARVALHO2
Meury Kétteryn Monteiro Evangelista da COSTA3
Gisélia de Santana MUNIZ2
Raul Manhães de CASTRO4
Elizabeth do NASCIMENTO4
A B S T R A C T
Objective
The present study assessed the pregnancy and lactation performances of rats fed an experimental diet based on the foods listed in the Family Budget Survey (Pesquisa de Orçamento Familiar)2002/2003 and the impact of said diet on the growth and development of the pups until weaning.
Methods
Wistar (n=12) rats were randomly divided into two groups: a control group (control group, n=6) fed a commercial chow (Labina®, Brazil) and an experimental group (n=6) fed the Family Budget Survey diet during the entire
Results
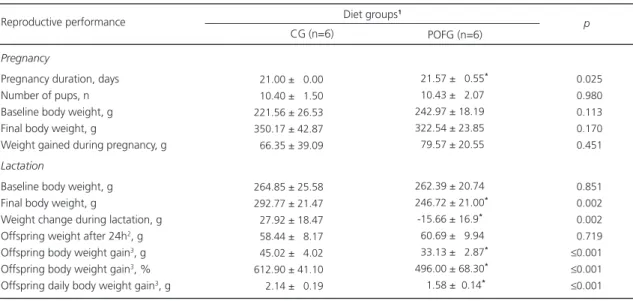
The Family Budget Survey diet increased the duration of pregnancy (control group=21.00±0.00; POFG=21.57±0.55, p=0.025) and made the dams lose weight during the lactation period (control group=27.92±18.47g; POFG=-15.66±16.90g). The Family Budget Survey group presented low food, energy and nutrient intakes during pregnancy, which became even lower during lactation. Pups from Family Budget Survey dams presented lower body weight at weaning (control group=52.38±4.49g; POFG=39.88±2.78g, p=0.001) and lower nose-to-anus length (control group= 117.37±0.64mm; POFG=125.62±0.96mm, p=0.001). However, some physical milestones and reflexes occurred earlier, such as the placing response reflex [control group= 12.00 (9.00-15.00) days; POFG=9.50 (9.00-14.00) days] aerial righting reflex [control group=18.00 (17.00-20.00) days; POFG=16.00 (13.00-18.00) days] and unfolding of the external ear [control group=3.00 (3.00-3.00) days; POFG=2.00 (2.00-3.00) days].
Conclusion
The Family Budget Survey diet seems to be more detrimental to the physical growth of the pups than to their brain growth, according to the assessed reflexes and physical milestones and measures. This may be due to the low protein content of the diet for rat reproduction and growth combined with adequate fat and essential fatty acid contents. Providing an adequate amount of protein to the Family Budget Survey diet may normalize pup growth.
Indexing terms: Diet. Growth. Lactation. Rats.
R E S U M O
Objetivo
O estudo se propõe avaliar os desempenhos de prenhez e lactação de ratas alimentadas com dieta experimental baseada nos alimentos adquiridos para consumo pela Pesquisa de Orçamento Familiar 2002-2003 e as repercussões no crescimento e desenvolvimento da prole até o desmame.
Métodos
Ratas Wistar (n=12) foram aleatoriamente divididas em dois grupos experimentais: um grupo-controle alimentado com dieta comercial Labina®, Brasil (n=6) ou dieta experimental (n=6) por toda gestação e lactação. Ração e água foram oferecidas ad libitum por todo período.
Resultados
A dieta Pesquisa de Orçamento Familiar na gestação e lactação aumentou a duração da gestação (grupo--controle=21,00±0,00; GPOF=21,57±0,55, p=0,025) e induziu uma variação negativa de peso nas mães ao final da lactação (grupo-controle=27,92±18,47g; POFG=-15,66±16,90g). Durante a gestação houve redução no consumo de alimentos, energia e nutrientes, exceto de lipídios no grupo experimental Pesquisa de Orçamento Familiar e esta foi intensificada na lactação. A prole proveniente das mães com dieta Pesquisa de Orçamento Familiar apresentou menor peso corporal ao desmame (grupo-controle=52,38±4,49g; POFG=39,88±2,78g, p=0,001) e menor comprimento naso-anal (grupo-controle=117,37±0,64mm; POFG=125,62±0,96mm, p=0,001). No entanto, o desenvolvimento físico e reflexo não mostrou diferenças em alguns resultados ou apresentou adiantamento como observado na colocação pelas vibrissas [grupo-controle: 12,00 (9,00-15,00) dias; POFG=9,50 (9,00-14,00) dias] e queda livre [grupo-controle:18,00 (17,00-20,00); POFG=16,00 (13,00-18,00) dias], bem como da abertura do pavilhão do conduto auditivo [grupo-controle=3,00 (3,00-3,00); POFG=2,00 (2,00-3,00) dias].
Conclusão
A dieta Pesquisa de Orçamento Familiar parece causar maior agressão ao crescimento somático que ao desenvolvimento cerebral da prole avaliado pela ontogênese reflexa e os caracteres físicos. Estas resultantes podem estar associadas a uma possível inadequação proteica da dieta para o período de reprodução e crescimento dos ratos em conjunto com suficiente aporte de lipídeos e ácidos graxos essenciais. Sugere-se que uma adequação de proteína na dieta Pesquisa de Orçamento Familiar possa promover apropriado crescimento somático da prole.
I N T R O D U C T I O N
Growth, development and reproductive performance are crucial indicators of dietary
adequacy1. In this context, protein adequacy
stands out because protein seems to be more critical than energy for a satisfactory reproduction1. The sum of low protein intake plus low food intake may be highly detrimental to the developing organism. In rats, the first postnatal weeks, that is, the lactation period, corresponds to the period of greatest vulnerability of the nervous system to environmental insults given the speed with which neurogenesis, synaptogenesis
and cell morphology occur2. During this time,
appropriate nutrient availability, especially
proteins2 and fats3, is essential for the
development of the central and peripheral nervous systems2.
Protein is essential not only for the maturation of the nervous system but also a
determinant of cranial and body growth4. Its
availability depends on appropriate protein intake by dams and quality of the protein source, consequently, the bioavailability of essential amino acids. Hence, low protein intake affects pregnancy and lactation performance, and the protein content of the dam’s milk5,6. There are numerous reports in the literature about the relationship between protein quality7 and quantity2,5,6,8 in the dam’s diet and the changes it causes on the somatic, metabolic and functional systems of the dam and her offspring.
The importance of fats for the dam’s
performance9 and offspring’s maturation and
nervous system development10 has also been
reported. However, fat quantity11,12 and type12,13 impact both the energy density of the diet and the availability of essential fatty acids. Thus, the beneficial and/or adverse repercussions of dietary fats are directly associated with their quantity, quality and fatty acid ratios.
Fats have been the focus of many studies not only because of their importance for body
development but also because of their growing participation in the human diet. There are clear associations between excess fat intake, especially saturated fat, and the development of overweight, obesity and related metabolic diseases. Based on this premise, experimental high-fat diets have been developed to induce excess weight and metabolic disorders in rats. One of the most common is the cafeteria diet, whose aim is to induce eating disorders and excess weight gain in the offspring14. Most cafeteria diets that combine commercial chow with high-fat foods culminate with the dilution of some nutrients, especially protein, making the diet unsuitable for the animal’s growth and development15. Additionally, the use of these diets during pregnancy and/or lactation results in unsatisfactory dam and offspring performance16,17.
In Brazil and other developing countries, the phenomenon known as nutrition and epidemiological transition reduced the rates of malnutrition and increased the rates of overweight and obesity in all age groups18. Concomitantly, the foods purchased by the population according to the greatest national survey, the Family Budget
Survey (Pesquisa de Orçamento Familiar - POF)
from 2002/2003 and 2008/200918 points out
However, these changes in the Brazilian dietary pattern have not been studied in animal models. Likewise, there are no reports of their consequences during the critical growth and development periods of rats. Therefore, the present study assessed the effects of an experimental diet based on the foods most commonly purchased by Brazilians on the dam’s performance and offspring’s growth and development until weaning. The commercial
chow Labina® was chosen as the control diet
because it is made from natural products, such as cereal grains and meatmeal, so it is similar to the experimental diet. According to the National
Research Council1, diets can be classified as
chemically defined, purified/semipurified and natural, according to their ingredients.
M E T H O D S
Experimental groups and environmental conditions
This study was approved in 2008 by the Committee of Anunal Experimental of the Center
of Biological Siences, Universidade Federal de
Pernambuco (UFPE) under protocol number 23076.004773/2008-42. Albino Wistar rats (Rattus novergicus) were obtained from the bioterium of the UFPE Departament of Nutrition and housed in a colony room at 22±1ºC and 12 hour light/dark cycle (lights on at 6:00 a.m.), with free access to food (Labina®, Agribands Purina
do Brasil Ltda, Paulínia, SP, Brazil, or the experimental diet) and water.
Nulliparous rats (n=13) aged 90 to 120 days and weighing 240±20g were mated with male rats of the same line and origin, in the proportion of 1 female to 2 males. The rats were considered pregnant when sperms were present in their vaginal discharge, collected by vaginal
smear20. Their weights were then followed
regularly. The rats were randomly divided into two groups, a Control Group (CG) fed with the commercial diet and an experimental group
(POFG), fed with the POF 2002/2003-based diet. Each group had 6-7 pregnant rats which were kept in individual polypropylene cages with ad libitum access to food and water during the entire pregnancy and lactation periods.
Twenty-four hours after delivery, the pups were weighed and the litter size was adjusted to 6 pups per litter for better lactational performance21, in the proportion of 3:3 or 4:2 males to females.
Diet
The experimental diet was based on the foods most commonly consumed by Brazilians according to the POF of 2002/2003. The food items used for preparing the diet and the relative participation of each macronutrient, food and food group to the total energy was based on the mean national values published by Levy Costa et al.19. The percentage caloric contribution of the foods that were not included in the experimental diet were redistributed to ensure the total contribution of each food group and each food was increased by 0.08% to represent the group ready-to-eat meals. The experimental diet was prepared from the most representative, inexpensive and easy-to-prepare foods of each food group.
The amount of raw foods in grams was proportional to the percentage contribution of each group to the total energy of the diet. A cooking factor was then used on the foods that required cooking to determine the correct amount of cooked food that should compose the diet.
-0.5; cake mix - 0.20. All foods were from the same brands and bought at the same location. Food moisture was removed by placing them in a ventilated incubator at 50-60ºC for 24 hours. The resultant flours per 100g of feed (%) were used to prepare the experimental feed. Once the flours of the cooked foods were ready, they were mixed with the other flours in a plastic bowl and sieved three times. The soft and fluid foods were carefully added to the flour mix in the following sequence: tomato sauce, lard, margarine, oil, chicken stock and the broth obtained from cooking the meat (100mL of broth for 1kg of feed). The mixture was then homogenized. The homogenate was placed in a ventilated incubator at 50-60ºC for another 24 hours for drying and pellet formation. The centesimal compositions of the flours (potato,
chicken and meat) and of the dried homogenate were determined at the Laboratory for Food
Esperimentation and Analysis (Laboratório de
Experimentação e Análisis de Alimentos - LEAAL) of the UFPE Department of Nutrition. No vitamin or mineral supplement was added to the POF diet. The fatty acids were determined by gas chromatography (Shimadzu GC-14B, Japan) with a Flame Ionization Detector. The column was a SUPELCOWAX (30mx0.25mmx0.25mL) column with a helium flow of 1.3mL/min, split ratio of 20:1 and a run time of 60 minutes. Chart 1 shows the fatty acid contents of the commercial and POF diets.
This study did not use the foods listed in the POF 2008/2009 because the experiments had
Chart 1. Percentage composition of fatty acids in relation to the total fat content of the diets. Recife (PE), Brazil, 2011.
C4:0 C6:0 C10:0 C12:0 C14:0 C15:0 C16:0 C18:0 C23:0
ΣΣΣΣΣ SFA C16:1 C18:1
ΣΣΣΣΣ MUFA C18:2 n-6 C18:3n-6 C20:2n-6 C20:4n-6 AA
ΣΣΣΣΣ (n-6) PUFA C18:3n-3 C20:5n-3 EPA C22:5n-3 C22:6n-3 DHA
ΣΣΣΣΣ (n-3) PUFA 18:2n-6/ 18:3n-3
C22:2
ΣΣΣΣΣ PUFA P/S
ND ND ND ND ND ND ND ND ND 27.41 ± 0.85
ND ND 22.52 ± 1.28 45.48 ± 1.15 00.13 ± 0.01 02.87 ± 0.20 00.31 ± 0.03 46.39 ± 1.36
02.87± 0.09 00.16± 0.01 00.21± 0.02 00.31± 0.03 3.44± 0.07
15:1 NI 49.83
1.82
00.26 11.00 00.37 00.27 01.40 01.76 15.30 05.80 00.24 36.41 00.42 23.44 23.86
35.84 NI NI NI 35.84 03.63 NI NI NI 03.63 009:10
00.24 39.74 01.09
Fatty acids Standard diet1 Experimental diet based on the Family Budget Survey1 (POF)
Note: NI: Not Identified; ND: Not Determined; SFA: Saturated Fatty Acids; MUFA: Monounsaturated Fatty Acids; PUFA: Polyunsaturated Fatty Acids; AA: Arachidonic Acid; P/S: Polyunsaturated/Saturated. ΣΣΣΣΣ (n-3) PUFA: Sum of all the linolenic acid series; P/S: Σ Σ Σ Σ Σ PUFA to Σ Σ Σ Σ Σ SFA ratio. 1Data obtained
from the analysis done at the Physiology and Pharmacology Laboratory of Universidade Federal de Pernambuco.
already begun by 2008 and the results of the said
survey were only published by the Instituto
Brasileiro de Geografia e Estatística (IBGE) in 2010. Since the present study is linked to a doctoral thesis, it would not be viable to remake the diet and restart the experiments.
Twenty-eight percent of the energy of the POF diet came from fats, 14% from proteins (9% animal protein and 5% plant protein) and 58% from carbohydrates. The centesimal macronutrient composition (g/100g of feed) was 12.6g of fats, 14.5g of proteins, 66.9g of carbohydrates (14.1g of simple carbohydrates) and 2.0g of fiber. The energy density was 4.4kcal/g. Meanwhile, 11% of the energy of the commercial diet came from fats, 26% from proteins and 63% from carbohydrates. The centesimal macronutrient composition (g/100g of feed) of the commercial diet was 4.2g of fats, 23.3g of proteins, 51.8g of carbohydrates and 5.0g of fiber. The energy density was 3.6kcal/g. The POF diet provides 17% more calories from fats and 12% less calories from proteins than the standard diet. The qualitative and quantitative composition of the diets was determined at the LEAAL of the UFPE Departament of Nutrition by the following methods: protein by the Association of Analytical Communities (AOAC) method 991.20 (1998) and fats by the AOAC method 963.15 (1998). Fiber content was calculated by consulting food composition databases and nutrient facts labels. Carbohydrates were obtained by difference and the total energy content was calculated.
According to the literature, the commercial diets used in the bioterium, such as Labina®, are based on the National Research Council (NRC/USA) and National Institutes of Health recommendations. This commercial chow does not reveal its formula. It only lists the basic composition on the packaging, having fishmeal as the protein source, a vitamin and mineral supplement, and an important proportion of bran. The feed may contain calcium carbonate, soybean meal, wheat bran, alfalfa meal, dicalcium
phosphate, cornmeal, crude soybean oil and sodium chloride, among others, at the manufacturer’s discretion.
Dam’s performance
The dams’ weights were measured weekly on pregnancy and lactation days 1, 7, 14 and 21. Their body weights were determined by a digital electronic scale of the brand Marte, model S-4000, with 4kg capacity and 0.01g accuracy.
The two groups received daily 30-40g of feed pellets during pregnancy and 40-80g during lactation. Weekly food intake was determined by the equation FC=FO-R, where Consumed Food (FC) is the amount of food consumed per week,
Food Offer (FO)is the amount of food given to
the animals in grams and Reject (R) is the amount of leftover food in grams. The energy, fat, protein, carbohydrate and fiber intakes were then calculated by multiplying the total intake of each dam in grams by the centesimal composition of each nutrient in the relevant food and dividing by 100. Weekly food intake was assessed for the 3 weeks of pregnancy and 3 weeks of lactation, even though the pups start eating fourteen days after birth, despite suckling22. The daily intake of each dam was given by dividing the total amount of food consumed during the 3 weeks of pregnancy by 21 and during the 3 weeks of lactation by 21.
Once the food intake was determined, it was possible to calculate the Weight Gain Coefficient per Energy Intake (WGCEI). WGCEI was determined weekly during pregnancy and lactation and calculated for each group according to the equation WGCEI=(WW-BW)/TEV, where Weekly Weight (WW) is the weekly weight of the animal in grams, Body Weight (BW)is the baseline weight of the animal in grams and Total Energy Value (TEV)is the total energy content of the food
in calories23. The WGCEI were expressed as
Indicators of the physical and reflex developments
Physical growth and the development of the reflexes and some physical characteristics were assessed daily from the first to the twenty-first day of lactation. The measurements were done by a digital caliper of the brand Starrett, with an accuracy of 0.01mm. The following measurements were taken: tail length by gently extending the tail of the animal and measuring it from base to tip; longitudinal body axis by gently laying the animal on a flat surface, marking the spots that coincided with the nose and base of the tail and measuring the distance between the two marks with a digital caliper; Skull Laterolateral Axis (SLLA), represented by an imaginary line joining the midpoints of the two pinnae perpendicular to the longitudinal axis of the skull, by holding the animal with one hand with its head between the thumb and forefinger, and measuring the SLLA with a caliper; Skull Anteroposterior Axis (SAPA), represented by a line going from the tip of the nose to an imaginary line running tangent to the posterior ends of the pinnae, by holding the animal as mentioned above and measuring the SAPA with a caliper.
The reflex responses were determined as recommended by Fox, 196524. The day of the full reflex response to a given stimulus was taken down. The day of the full reflex response was considered the first of three consecutive days that the reflex was fully present. The tests were done away from the dams, between 8 and 10 a.m., by the same researcher. The pups had a time limit of 10 seconds to display the reflex25.
The following physical characteristics were taken down: unfolding of the external ear, ear opening and eye opening.
The following reflexes were investigated: righting - when a pup is placed on its back, it immediately turns over to rest in the normal position with all four feet on the ground; placing response - when a pup is suspended by the tail and lowered so that the vibrissae make contact
with a solid object (table), the head is raised and the forelimbs are extended to grasp the object; cliff avoidance - when a pup is placed on the edge of a board with nose and feet forced just over the edge, it shows withdrawal of head and both forefeet from edge and attempts to walk away from it; negative geotaxis - when a pup is placed on a 45º slope (34.0x24.0cm board covered with non-slip crepe paper) with its head pointing down the incline, it turns around and crawls up the slope; aerial righting - when a pup is held by the four paws, upside down, from a height of 30.0cm and released over a 30.0x12.0cm synthetic foam bed, it rotates its body and lands on all fours; and acoustic startle response - when a loud, sharp noise using a metal rod hitting a metal cup (4.5cm diameter and 6.0cm high) is done approximately 10.0cm away from a pup, it startles and withdraws into a crouching position. The dams were sacrificed at the twenty-first day of lactation and the litters were followed for future adulthood studies.
Statistical treatment
The results are expressed as mean standard deviation or median and interquartile ranges (P25-P75), and the number of animals is shown in parenthesis. The normality of all data was tested by the Kolmogorov-Smirnov test. The groups were compared by the Student’s t-test or Mann-Whitney test for two samples and two-way Analysis of Variance (Anova) for three or more samples, according to normality and variance, followed by the Bonferroni correction when significant differences were found. The significance level for all tests was set at 5% (p<0.05). The data were treated by the software SigmaStat 3.5 (Systat Software, Inc.) and the graphs created by the software Prisma 4® (GraphPad Software Inc., La Jolla, CA, USA).
R E S U L T S
POFG=242.97±18.19g, p=0.113). The POF diet increased pregnancy duration (CG=21.00±0.00
days; POFG=21.57±0.55 days, p=0.025) but not
the amount of weight gained by the dams (CG=350.17±42,87g; POFG=322.54±23.85g,
p=0.170) or litter size or weight on the first day of life (24 hours after delivery).
On the other hand, POF diet during lactation promoted greater weight loss in the dams (CG=27.92±18.47g; POFG=-15.66±16.90g,
p=0.002) and, consequently, lower final weight
at weaning (POFG 16% lighter than CG). The pups of the POFG group also gained less weight during the lactation period (CG=45.02±4.02g;
POFG=33.13±2.87g, p≤0.001), roughly 26%
less than the controls, and gained 0.56g less per day than the CG (CG=2.14±0.19g/day;
POFG=1.58±0.14g/day, p≤0.001)(Table 1).
Other observations regarding the POFG include lower intakes of food, energy, proteins, carbohydrates and fibers and higher intake of fibers during pregnancy and lactation (Table 2). However, these differences were even greater during lactation.
The energy and food intake of the POFG dams was approximately 25 and 30% lower than those of the CG, respectively. This represented a decrease of 56% in protein intake (CG=44.82±7.71g; POFG=101.44±12.50g,
p≤0.001) and of 72% in fiber intake
(CG=22.05±2.72g; POFG=6.35±1.09g, p≤0.001)
(Table 2). On the other hand, the fat intake of the POFG during pregnancy was two times higher than that of the CG (CG=18.70±2.30g;
POFG=39.05±6.72g, p≤0.001). The daily fat
intake of the POFG dams was 1.86±0.32g/day and of the CG dams, 0.89±0.11g/day (Table 2).
During lactation, the food and energy intakes of the POFG dams were approximately 55% of those of the CG dams. This represented a 71% lower protein intake (CG=133.33±17.39g; POFG=38.45±3.49g, p≤0.001) (Table 2). This low
intake decreased the amount of protein consumed daily by the POFG dams considerably (CG=6.35±0.83g/day; POFG=1.83±0.14g/day,
p≤0.001) (Table 2). On the other hand, total and
daily fat intakes remained high in the POFG because of the higher fat content of the POF diet. During lactation, the POFG dams consumed
Table 1. Effects of the experimental Family Budget Survey (POF) diet on dam’s pregnancy, lactation and reproductive performance, and
offspring development. Recife (PE), Brazil. 2011.
Pregnancy
Pregnancy duration, days Number of pups, n Baseline body weight, g Final body weight, g
Weight gained during pregnancy, g Lactation
Baseline body weight, g Final body weight, g
Weight change during lactation, g Offspring weight after 24h2, g
Offspring body weight gain3, g
Offspring body weight gain3, %
Offspring daily body weight gain3, g
021.00 ± 00.00 010.40 ± 01.50 221.56 ± 26.53 350.17 ± 42.87 066.35 ± 39.09
264.85 ± 25.58 292.77 ± 21.47 027.92 ± 18.47 058.44 ± 08.17 045.02 ± 04.02 612.90 ± 41.10 002.14 ± 00.19
Note: Values expressed as mean ± Standard Deviation or median (P25-P75), n=6-7.
*Differences according to the Student’s t test or Mann-Whitney
test, p≤0.05; 1CG rats in the Control Group fed commercial chow; POFG: rats in the experimental Group fed Family Budget Survey diet; 2Body
weight of the offspring (males and females) 24 hours after birth; 3values regarding the offspring’s first 21 days (males), n=11-14.
Reproductive performance
CG (n=6)
-021.57 ± 00.55*
-010.43 ±0 2.07 -242.97 ± 18.19 -322.54 ± 23.85 -079.57 ± 20.55
-262.39 ± 20.74*
-246.72 ± 21.00*
0-15.66 ± 16.9*
-060.69 ±0 9.94 0-33.13 ± 02.87*
-496.00 ± 68.30*
0-01.58 ±00.14*
POFG (n=6)
≤0.025
≤0.980
≤0.113
≤0.170
≤0.451
≤0.851
≤0.002
≤0.002
≤0.719
≤0.001
≤0.001
roughly 1.4 times more fat than the CG dams
(CG=24.58±3.21g; POFG=33.50±3.04g, p≤0.001)
(Table 2), with daily fat intakes of CG=1.17±0.15g/
day and POFG=1.59±0.14g/day, p≤0.001 (Table
2).
When the energy coefficient (weight gain in grams divided by energy intake in kcal) was
assessed (Table 2), the POFG energy coefficients during pregnancy and lactation were significantly lower than those of the CG. However, during lactation the mean weight variation per calorie consumed was negative (CG=1.37±0.92;
POFG=-1.35±1.47%, p≤0.001). These values are
coherent with the final dam weights and reflect
Table 2. Total and daily food, energy and nutrient intakes of the dams during pregnancy and lactation according to diet. Recife (PE),
Brazil, 2011.
Total food intake, g Daily food intake, g Total energy intake, Kcal
Daily energy intake, Kcal Food intake 1º week, g Food intake 2º week, g Food intake 3º week, g WGCEI2, g/%
Protein intake, g Daily protein intake, g Carbohydrate intake, g Daily carbohydrate intake, g Fat intake, g
Daily fat intake, g Fiber intake, g Daily fiber intake, g Lactation
Total food intake, g Daily food intake, g Total energy intake, Kcal Daily energy intake, Kcal Food intake 1º week, g Food intake 2º week, g Food intake 3º week, g WGCEI2,a, g/%
Protein intake, g Daily protein intake, g Carbohydrate intake, g Daily carbohydrate intake, g Fat intake, g
Daily fat intake, g Fiber intake, g Daily fiber intake, g
0441.03 ±054.36 0021.00 ±002.59 1587.70 ± 195.71
0075.00 ±009.32 0129.55 ±038.31 0114.42 ±039.53 0197.05 ±019.12 0008.22 ±001.80 0101.44 ±012.50 0004.83 ±000.59 0250.55 ±030.88 0011.93 ±001.47 0018.70 ±002.30 0000.89 ±000.11 0022.05 ±002.72 0001.05 ±000.13
0579.71 ±075.60 0027.60 ±003.60 2086.96 ± 272.18 0099.38 ±012.96 0187.47 ±048.05 0392.24 ±031.59 0467.55 ±041.76 0001.37 ±000.92 0133.33 ±017.39 0006.35 ±000.83 0329.33 ±042.95 0015.68 ±002.04 0024.58 ±003.21 0001.17 ±000.15 0028.99 ±003.78 0001.38 ±000.18 Pregnancy
Mean ± SD CG (n=6)
0-309.94 ±053.32**
00-14.76 ±002.54**
-1358.14 ± 233.65*
00-64.67 ±011.13*
00-98.09 ±021.84*
00-95.30 ±025.90 0-116.55 ±013.05*
0-005.97 ±001.66*
00-44.82 ±007.71**
0-002.13 ±000.37**
0-201.15 ±034.60*
0-009.58 ±001.65*
00-39.05 ±006.72**
0-001.86 ±000.32**
0-006.35 ±001.09**
0-000.30 ±000.05**
0-265.89 ±024.17**
00-12.66 ±001.15**
-1165.14 ± 105.91**
00-55.48 ±005.04**
00-99.39 ±017.66***
0-166.51 ±033.94***
0-221.24 ±037.47***
000-1.35 ±001.47**
-0038.45 ±003.49**
0-001.83 ±000.17**
0-172.56 ±015.69**
00-08.22 ±000.75**
00-33.50 ±003.04**
0-001.59 ±000.14**
0-005.45 ±000.49**
0-000.26 ±000.024**
Mean ± SD POFG (n=6) ≤0.001 ≤0.001 ≤0.084 ≤0.05 ≤0.05 0.22 ≤0.05 ≤0.039 ≤0.001 ≤0.001 ≤0.021 ≤0.05 ≤0.001 ≤0.001 ≤0.001 ≤0.001 ≤0.001 ≤0.001 ≤0.001 ≤0.001 ≤0.0001 ≤0.0001 ≤0.0001 ≤0.001 ≤0.001 ≤0.001 ≤0.001 ≤0.001 ≤0.001 ≤0.001 ≤0.001 ≤0.001 p Diet groups1
Note: Values expressed as mean ± Standard Deviation, n=6/group. *Differences according to the Student’s t test or two-way Repeated Measures
Anova (two-way RM Anova) followed by the Bonferroni correction, *p≤0.05; **p≤0.001;***≤0.0001. 1CG: rats in the Control Group fed commercial
chow; POFG: rats in the experimental group fed Pesquisa de Orçamento Familiar diet; 2WGCEI: Weight gain Coefficient per Energy Intake. aWGCEI:
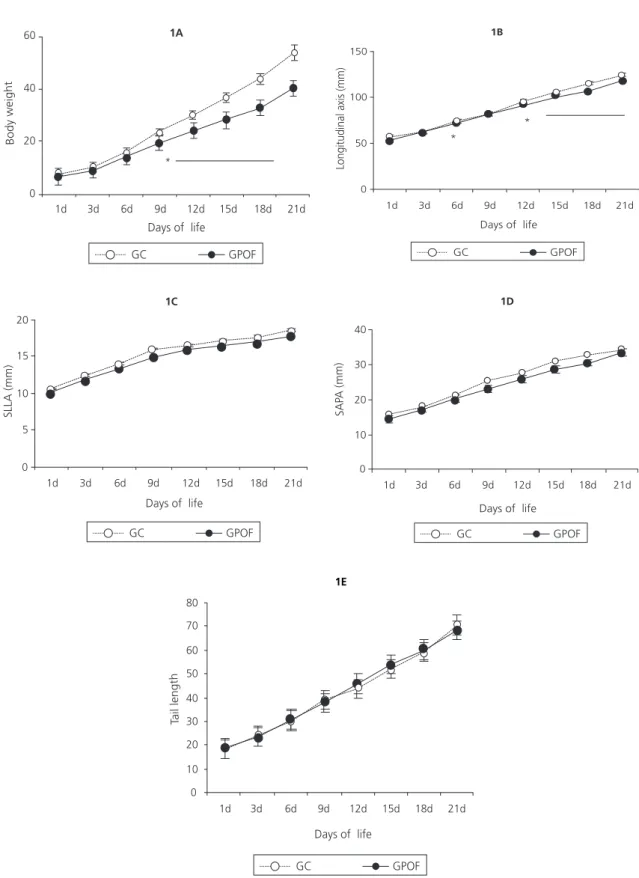
Figure 1. Offspring growth (body weight (1A) longitudinal body axis (1B) skull laterolateral axis (1C), skull anteroposterior axis (1D) and tail length (1E) according to the diets consumed by the dams during pregnancy and lactation. Recife (PE), 2011.
Note:*p≤0.01. Values expressed as mean ± Standard Deviation, n=11-14. Differences according to two-way Repeated Measures Analysis of
Variance (two-way RM Anova) followed by the Bonferroni correction. SLLA: Skull Laterolateral Axis; SAPA: Skull Anteroposterior Axis. CG: rats in the Control Group fed commercial chow; POFG: rats in the experimental group fed Family Budget Survey diet.
0 20 40 60
1d 3d 6d 9d 12d 15d 18d 21d
Days of life *
1A
GC GPOF
Body weight
0 50 100 150
1d 3d 6d 9d 12d 15d 18d 21d Days of life
* *
1B
Longitudinal axis (mm)
GC GPOF
0 5 10 15 20
1d 3d 6d 9d 12d 15d 18d 21d
Days of life 1C
SLLA (mm)
GC GPOF
0 10 20 30 40
1d 3d 6d 9d 12d 15d 18d 21d
Days of life 1D
SAP
A (mm)
GC GPOF
0 10 20 30 40 50 60 70 80
1d 3d 6d 9d 12d 15d 18d 21d
Days of life
1E
Tail length
a lower efficiency of the POF diet to increase or maintain weight per kilocalorie consumed. Table 2 shows the lower daily food intakes of the POFG dams during pregnancy and lactation.
The POFG dams consumed less food during the first (CG=129.55±38.31g;
POFG=98.09±21.84g, p=0.014) and last
(CG=197.05±19.12g; POFG=116.55±13.05g,
p=0.014) weeks of pregnancy (Table 2). However, they consumed less food during the entire lactation period (Table 2). Food intake by the POFG dams was roughly 30% lower during pregnancy and 50% lower during lactation. During pregnancy, intragroup assessment showed that the CG dams consumed a similar amount of food in the first and second weeks and significantly more in the third week, while the POF dams consumed a similar amount of food during the entire pregnancy. However, during lactation, the food intake of both groups increased weekly. However, this increase was less pronounced in the POFG.
The growth of the pups was determined by measuring body weight, nose-to-anal length, tail length and skull axes. From the ninth day of life onward, the POFG pups’ weights were smaller
than those of the CG pups (CG=23.00±3.00g;
POFG=19.80±1.64g, p≤0,001), and this trend
continued until weaning (CG=52.38±4.49g;
POFG=39.88±2.78g, p≤0.0001) (Figure 1A). The
nose-to-anus lengths of the POFG pups were smaller on the sixth day of life (CG=74.70±3.20mm; POFG=71.08±1.92mm,
p≤0.01), and from the twelfth day onward
(CG=89.76±1.40mm; POFG=94.52±3.21mm,
p≤0,001) (Figure 1B). The SLLA of the POFG pups
were 7-10% smaller than those of the CG pups from birth but the differences w’ere not significant (Figures 1C). No difference also found to skull anteroposterior axis (Figure 1D) or tail length (Figure 1E). During this period, the tail length reflects the development of the nervous system.
With respect to physical and reflex development, the POFG pups developed the placing response reflex [CG=12.00 (9.00-15.00
days); POFG=9.50 (9.00-14.00 days), p=0.023]
and aerial righting reflex [CG=18.00 (17.00-20.00 days); POFG=16.00 (13.00-18.00 days), p≤0.001] before the CG pups. Their ears also unfolded before those of the CG pups [GG=3.00 (3.00-3.00 days); POFG=2.00 (2.00-(3.00-3.00 days), p=0.03] (Table 3).
Table 3. Postnatal reflex development and physical characteristics of the offspring of dams fed a commercial diet or the experimental
Family Budget Survey (POF) diet during pregnancy and lactation1. Recife (PE), Brazil, 2011.
Reflexes
Median (P25-P75)
CG (n=11)
Median (P25-P75)
POFG (n=14) p
Diet groups2
Righting Placing response Cliff avoidance Negative geotaxis Acoustic startle Aerial righting Physical characteristics
Unfolding of the external ear Ear opening
Eye opening
day
05.00 (4.00-8.00) 12.00 (9.00-15.00) 09.00 (7.00-10.00) 12.00 (12.00-13.75) 12.00 (12.00-12.00) 18.00 (17.00-20.00)
day
03.00 (3.00-3.00) 12.00 (12.00-12.00) 15.00 (15.00-15.00)
06.50 (4.00-9.00) 09.50 (9.00-14.00)*
07.00 (6.00-9.00) 13.50 (13.00-14.00) 12.00 (12.00-13.00) 16.00 (13.00-18.00)*
02.00 (2.00-3.00)*
12.50 (12.00-13.00) 14.00 (13.00-15.00)
Note:Differences according to the Mann-Whitney test, p≤0.05. 1Values expressed as median (P
25-P75), n=11-14/group.
2CG: Control Group fed
standart chow dut; POFG: experimental group fed Family Budget Survey diet; day: first day in which the reflexes and physical characteristics occurred.
<0.270 <0.020 <0.260 <0.120 <0.310 <0.001
D I S C U S S I O N
The present study found that when female rats consume the POF diet during pregnancy and lactation, their reproductive performance and the growth and development of their pups are affected. On the other hand, the ears of the pups of these dams unfolded sooner than those of the control group and some of their reflexes also developed sooner.
The main characteristics of the POF diet is high fat content, three times higher than that of the control diet, a commercial diet for rodents, and low protein content, roughly half that of the control diet. Its macronutrient composition is similar to those of most cafeteria diets discussed in the literature. Cafeteria diets also have high-fat contents and usually low-protein contents, and are routinely used for inducing obesity in rodents. Generally, cafeteria diets have a negative impact
on maternal performances16,17 since mixing
commercial chows with high-fat foods reduces the fiber, micronutrient and protein contents, preventing the mixture from meeting the animals’ requirements during reproduction and growth25. The delayed physical growth of the offspring and hazards to the reproductive process of the dams observed in the present study are similar to those obtained with cafeteria diets.
Like cafeteria diets, the POF diet has inadequate protein content for the growth and development of rats. Protein seems to be more critical than energy for reproduction1. Proper amounts of protein in chows with high-fat content increases pup growth and does not change serum protein levels15, which indicate protein adequacy. Studies have found that high-fat and low-protein diets increased duration of pregnancy and reduced pup survival16,17,25. The present study also found an increased duration of pregnancy in the POFG, but litter size or pup survival was unaffected.
Rats on the POF diet also consumed less food, which further decreased their protein and energy intakes during pregnancy and lactation.
However, since the POF diet was more energy-dense, their fat intake remained higher than that of the control group. A similar result was found by Brito et al.,9 who reported that dams fed a high-fat (24.2%) and low protein (7.0%) diet consumed less food during pregnancy, resulting in 82.0% less protein intake and 23.0% less energy intake, but fat intake was three times higher.
According to the literature, rats usually experience polyphagia (excess hunger) at the end of pregnancy and during the lactation period. The present study found that the POFG presented a lower food intake during the first week of pregnancy and even lower on the third week of pregnancy, when the rats should be hungrier, and during the entire lactation period, demonstrating absence of polyphagia during the entire study period. The absence of a higher food intake by the POFG may be due to the satiety produced by the high-fat content of the diet and/or their low protein intake.
Both high fat25 and small protein5 intakes are associated with low food intake. Polyphagia is not seen in pregnant and lactating rats fed the cafeteria diet. These rats usually consume less food and lose more weight during lactation. Intense weight loss stems from greater mobilization of the adipose tissues during lactation, that is, of the maternal reserves stored
during pregnancy26, fact observed in the POFG
dams.
promote polyphagia, and the prolactin-induced leptin resistance helps to increase hunger further. This way, it is likely that physiological mechanisms responsible for the delayed growth of the POFG pups are similar to the ones listed above.
Low-protein diets reduce serum prolactin by 70%, evidenced by less suckling and milk production, which in turn does not promote leptin resistance, characteristic of this phase27. Shaw et
al.25 stated that the third week of pregnancy is characterized by continuous hyperinsulinemia and insulin resistance. Accordingly, the intake of high-fat diets (35%) has a smaller impact on serum insulin during pregnancy and greater during lactation, while the opposite is observed in control rats. This peculiar phenomenon partly explains the food intake changes presented by rats consuming low-protein and/or high-fat diets. Moreover, fats provide per gram more than double the amount of energy provided by carbohydrates and proteins. High fat intake may increase the levels of peptides that inhibit appetite, such as cholecystokinin, promoting greater satiety and smaller food intake. This quantitative reduction balances energy intake28 but reduces the intake of other nutrients. According to Shaw et al.25, the high-fat (35%), high-energy diet reduced the food intake of the dams significantly. Guo & Jen29 also observed that dams on a high-fat diet (40%) presented low food and energy intakes. Together, these facts found the findings of the present study regarding the POF diet.
Although the POFG dams consumed less food and energy during pregnancy, their weight gains were not significantly different from those of the control group. During pregnancy the body uses different energy substrates to meet its requirements. More adipose tissue is mobilized to increase the availability of glucose to the fetus30. Therefore, the greater fat content of the POF diet may have contributed to greater lipogenesis, facilitating the storage of triglycerides in the maternal reserves and so promoting similar weight gain to that of the controls.
Lipids are known to have greater metabolic efficiency than other macronutrients, which
promotes greater storage and weight gain28.
Although weight gain is caused by an unbalance between energy intake and expenditure, the macronutrient composition of the diet has an important impact on body weight regardless of energy intake28. Diets with greater amounts of energy coming from fats are capable of promoting weight gain even when food intake is smaller and energy intake is smaller or equal28.
The balanced body weight seen during pregnancy did not occur during lactation. The significant decrease in food and energy intakes caused the POFG dams to lose a considerable amount of weight. Brito et al. (2006)9 also observed that dams fed a high-fat (24.2%), low-protein (7.0%) diet had lost 14.0% more weight by the end of the lactation period than the controls. During lactation, the negative weight gain coefficient per energy intake of the POFG is in agreement with their greater weight loss. Hence, even though the POF diet had more fat and energy density than the commercial chow, food intake during lactation was low enough to deplete the POF dams’ reserves. During lactation, consumption of high-fat, low-protein diets seems to increase serum triiodothyronine by 74.0% and decrease thyroid-stimulating hormone by 26.0%. These changes induce thyroid hyperfunction,
promoting greater iodine uptake and T39
synthesis, which in turn promotes greater energy expenditure and weight loss.
The low food and energy intakes and intense weight loss presented by the POFG dams impaired the growth and development of their pups. POFG pups gained less weight and body length during the first 21 days of life. Maternal low protein intake during pregnancy and lactation impairs pups’ growth permanently, causing irreversible changes in organ size and function, especially the liver, and in body composition and
growth hormone secretion31. High-fat,
low-protein diets seem to impair pup growth11 by
In addition, food intake during lactation has a direct impact on the availability of nutrients for milk synthesis. In turn, milk availability has a direct impact on pup growth26,32. Pups from dams fed a high-fat diet (20%) with adequate protein content are significantly heavier than controls on the sixth day of life, and the difference in weight is even greater by day nine32. These dams not only produced more milk, but their milk also presented higher fat, protein and energy contents. Together, these factors probably made the pups grow more33.
The lower gain in body weight and length of the POFG pups likely reflects the low protein and energy intakes of the POFG dams. Meanwhile, the greater fat content of the POF diet may have contributed to the normal development of the nervous system, not impacting skull growth. This fact may stem from the moderate increase in dietary fat. According to Gadja et al.14, diets with as much as 30% of their energy coming from fats are appropriate for rats. On the other hand, when more than 50% of the dietary energy comes from fats, typical of ketogenic diets, the effect of low protein intake is marked, causing more stunting11. Also, low dietary protein increases the fat content of milk from the fourth day of lactation6. High-fat diets increase the fat content and energy density of the milk, causing greater satiety and, therefore, less intake32. These facts may explain to a certain degree the smaller skull growth seen in the POFG pups, but the difference was not significant.
The laterolateral and anteroposterior axes of the skull are correlated with regions called neurocranium and viscerocranium, respectively. The viscerocranium is used for feeding, is more subject to muscle overload and seems to be more vulnerable to epigenetic factors, such as low protein intake. The neurocranium is the part of the skull that houses the brain. Its development is mainly influenced by brain growth. At birth, this part has already completed much of its growth. Thus, after birth the viscerocranium grows faster than the neurocranium, in accordance with
the functional demand4. The viscerocranium of
rats fed a low-protein diet (4%) grow less, probably because of faster growth4.
The results of the present study show that the anteroposterior axis of the skulls of POFG pups grew approximately 7-10% less than that of controls. Their neurocrania also grew 6% less but the difference was not significant. These findings are in agreement with those of Miller & German4 who reported the vulnerability of this axis to a low-protein diet during perinatal life. However, the differences found in Miller & German’s4 study stemmed from a very low-protein diet (4%) with normal fat content. So the axes may have been preserved in the present study because the POF diet was not extremely low in protein and was high in fats.
At the same time, some developmental milestones of the POFG pups developed sooner, namely the reflexes placing response and aerial righting, and unfolding of the external ear. According to Torres et al.10, moderate protein restriction (10%) reduces the amount of Arachidonic Acid and Docosahexaenoic Acid (DHA) in the dam’s liver, along with the enzymes that elongate and desaturate essential fatty acids, resulting in lower fat content in the fetal brain. Marin et al.33 then showed that these events are minimized when dietary fat consists of soybean oil, even if protein content is below 5%. This is probably due to the fact that soybean oil has higher alpha-linolenic (n-3) and linoleic (n-6) contents, at a ratio of 1:6, respectively33.
On the contrary, low-protein (8%), high-fat diets (ketogenic) with low essential fatty acid contents delay the development of reflexes
and physical milestones in pups11. The early
development of the POFG pup reflexes seen in the present study may stem from the not-so-low protein content (14%) of the diet, adequate n-6 to n-3 ratio, and moderate, not high, fat content according to Gadja’s et al.14 classification.
intrauterine life11. DHA peaks on the twentieth day of intrauterine life. Therefore, when pups are born before the twenty-first day of intrauterine life, the fetal brain content of these fatty acids is lower. Other factors that may reduce brain Polyunsaturade Fatty Acids (PUFA) levels is low n-3 intake, since these fatty acids are usually less abundant in foods than n-6, and inappropriate n-6 to n-3 intake ratio12.
The Family Budget Survey diet does not seem to have an unfavorable n-3 content or n-3 to n-6 ratio. When n-3 is low, these acids are replaced by n-6 in cell compartments, causing a quantitative, not qualitative, compensation. This quantitative deficit is hard to correct once desaturase activity in the liver decreases radically after the eighth day of life and, consequently, the conversion of essential fatty acids into long-chain PUFAs. In addition, essential fatty acid requirement varies from organ to organ and with tissue nature12. Thence, early and adequate availability of essential fatty acids and preformed long-chain PUFAs to the developing brain is crucial to avoid deficits during the critical development period of the nervous system.
The sudden reduction in desaturase levels in the first days of life may also decrease the synthesis of long-chain PUFA that use linolenic
and linoleic acids as precursors12. The
Polyunsaturated to Saturated fatty acid (P/S) ratio is equally important for enzyme activity; the acceptable ratio is 1:612.
The Family Budget Survey diet has an n-6 to n-3 ratio close to the recommendations for proper PUFA levels in the pups’ brains12. Medium-and long-term adverse effects that may stem from the POF diet may be due to its total saturated fat content or its P/S ratio, since its P/S ratio is far from the accepted ratio.
With respect to the physical milestones, ear duct and eye development seem to be more susceptible to dietary changes, especially unbalanced fat intake, which impacts negatively
the myelination of the sensory systems11,13.
Hearing develops after birth and is complete by
the fourth week of life13. Timely development of this function seems to depend on the dietary availability of polyunsaturated fatty acids, such as arachidonic and docosahexaenoic acids, which accumulate in the developing brain. Appropriate fatty acid levels in the POF diet may have prevented deleterious effects on the physical development of the pups or even accelerated them, since the auditory and visual systems seem to be more sensitive to dietary fat unbalances.
Not only inadequate nutrients but also excess nutrients may impair growth and/or development. Intake of a high-fish oil diet (high n-3 content) by dams increased the DHA levels in the brains of the pups but delayed their auditory startle response and auditory brainstem conduction times13. It seems that high-omega-3 diets reduce myelination-related enzyme activity, thereby impairing auditory system myelination.
In conclusion, the present results suggest that the POF diet is detrimental to pup growth but according to reflex development, brain growth was less affected. The results stem from the moderate fat content, appropriate essential fatty acid content and low protein content of the diet for the critical growth phase of the pups. The results may have also been affected by the low food intake of the POFG. Once the protein content of the POF diet is corrected, macronutrient intakes will not be affected during pregnancy and lactation, and body growth will not be impaired.
The authors emphasize that the present results cannot be extrapolated to human beings because of the distinct metabolic rates and nutritional requirements of both species. Additionally, the POF diet is based on a food purchasing pattern, not on a food survey that distinguishes the different food patterns associated with different life phases.
A C K N O W L E D G M E N T S
statistical analyses, Food Experimentation and Analysis Laboratory, Professor Dr. Belmira Lara Silveira Andrade da Costa from the Universidade Federal de Pernambuco Laboratory of Physiology and Pharmacology and Dr. Edeones Tenório França, veterinarian from the Universidade Federal de Pernambuco Department of Nutrition bioterium.
C O N T R I B U T O R S
MF CARVALHO participated in the development of the practical research, data collection and analysis and article preparation. MKME COSTA participated in the development of the practical research and data collection. GS MUNIZ helped to prepare the article and analyze data. RM Castro helped in the final revision of the article. E NASCIMENTO planned the study and helped in the preparation of the article, supervising the writing and data analysis.
R E F E R E N C E S
1. National Research Council. Nutrient Requirements of Laboratory Animals. 4th ed. Washington:
National Academy Press; 1995 [cited 2011 Jun 27]. Available from: <http://www.nap.edu/openbook. php?record_id=4758&page=154>.
2. Morgane PJ, Austin-LaFrance R, Bronzino J, Tonkiss J, Díaz-Cintra S, Cintra L, et al. Prenatal malnutrition and development of the brain. Neurosc Biobehav Reviews. 1993; 17:91-128. doi: 10.1016/S0149-76 34(05)80234-9.
3. Bourre JM, Bonneil M, Clément M, Dumont O, Durand G, Lafont H, et al. Function of dietary polyunsaturated fatty acids in the nervous system PLEFA. 1993; 48:5-15. doi: 10.1016/0952-3278 (93)90003-F.
4. Miller JP, German RZ. Protein malnutrition affects the growth trajectories of the craniofacial skeleton in rats. J Nutr. 1999 [cited 2011 Jul 10]; 129:2061. Available from: <http://jn.nutrition.org/content/ 129/11/2061.long>.
5. Cherala G, Shapiro BH, D’Mello AP. Two low protein diets differentially affect food consumption and reproductive performance in pregnant and lactating rats and long-term growth in their offspring. J Nutr. 2006 [cited 2011 Jul 10]; 136:2827-33. Available from: <http://jn.nutrition. org/content/136/11/2827.full>.
6. Pine AP, Jessop NS. Maternal protein reserves and their influence on lactational performance in rats 3: The effects of dietary protein restriction and stage of lactation on milk composition. Br J Nutr. 1994 [cited 2011 Jul 10]; 72(6):815-30. Available from: <http://journals.cambridge.org/abstract_S00 07114594000887>.
7. Sampson DA, Hunsaker HA, Jansen GR. Dietary protein quality, protein quantity and food intake: Effects on lactation and on protein synthesis and tissue composition in mammary tissue and liver in rats. J Nutr. 1986; 116(3):365-75.
8. Moura EG, Lisboa PC, Custódio CM, Nunes MT, Souza KP, Passos MCF. Malnutrition during lactation changes growth hormone mRNA expression in offspring at weaning and in adulthood. J Nutrit Biochem. 2007; 18(2):134-9. doi: 10.1016/j.jnutbio. 2006.04.002.
9. Brito PD, Ramos CF, Passos MCF, Moura LG. Adaptive changes in thyroid function of female rats fed a high-fat and low-protein diet during gestation and lactation. Braz J Med Biol Res. 2006; 39(6):809-6. doi: 10.1590/S0100-879X2006000600015. 10. Torres N, Bautista CJ, Tovar AR, Ordáz G,
Rodríguez-Cruz M, Ortiz V, et al. Protein restriction during pregnancy affects maternal liver lipid metabolism and fetal brain lipid composition in the rat. Am J Physiol Endocrinol Metab. 2010; 298(2):E270-E7. doi: 10.1152/ajpendo.00437.2009.
11. Soares AKF, Guerra RGS, Castro ML, Amâncio-dos-Santos A, Guedes RCA, Cabral-Filho JE, et al. Somatic and reflex development in suckling rats: Effects of mother treatment with ketogenic diet associated with lack of protein. Nutr Neurosci. 2009; 12(6):260-6. doi: 10.1179/147683009X4 23427.
12. Carlson SE, Carver JD, House SG. High fat diets varying in ratios of polyunsaturated to saturated fatty acid and linoleic to linolenic acid: A comparison of rat neural and red cell membrane phospholipids. J Nutr. 1986; 116(5):718-25.
13. Saste MD, Carver JD, Stockard JE, Benford VJ, Chen LiT, Phelps CP. Maternal diet fatty acid composition affects neurodevelopment in rat pups. J Nutr. 1998 [cited 2011 Jul 10]; 128:740-8. Available from: <http://jn.nutrition.org/content/128/4/740.full. pdf+html>.
14. Gajda AM, Michael MS, Pellizzon M, Ricci MR, Ulman EA. Diet induced metabolic syndrome in rodent models. Animal Lab News; 2007.
16. Rolls BJ, Rowe EA, Fahrbach SE, Agius L, Williamson DH. Obesity and high energy diets reduce survival and growth rates of rat pups. Proc Nutr Soc. 1980; 39(2):51A.
17. Rolls BJ, Rowe EA. Pregnancy and lactation in the obese rat: Effects on maternal and pup weights. Physiol Behav. 1982; 28(3):393-400. doi: 10.1016/0 031-9384(82)90130-5.
18. Instituto Brasileiro de Geografia e Estatística. Pes-quisa de Orçamento Familiar, 2002- 2003: análise da disponibilidade domiciliar de alimentos e do es-tado nutricional no Brasil. Rio de Janeiro: IBGE; 2004.
19. Levy-Costa RB, Sichieri R, Pontes NS, Monteiro CA. Disponibilidade domiciliar de alimentos no Brasil: distribuição e evolução (1974-2003). Rev Saúde Pública. 2005; 39(4):530-40. doi: 10.1590/S0034-89102005000400003.
20. Marcondes FK, Bianchi FJ, Tanno AP. Determination of the estrous cycle phases of rats: some helpful considerations. Braz J Biol. 2002; 62(4):609-14. doi: 10.1590/S1519-69842002000400008.
21. Fishbeck KL, Rasmussen K. Effect of repeated reproductive cycles on maternal nutritional status, lactational performance and litter growth in ad libitum-fed and chronically food-restricted rats. J Nutr. 1987; 117:1967-75.
22. Ebisui L, Fontes, RS, Lapchik VBV. Rato. In: Lapchik VBV, Mattaraia VGM, KO GM. Cuidados e manejo de animais de laboratório. São Paulo: Atheneu; 2009.
23. Campbell JA. Method for determination of PER & NPR. In: Food and Nutrition Board: Evaluation of protein quality. Washington (DC): Food and Nutrition Board; 1963.
24. Fox WM. Reflex-ontogeny and behavioural development of the mouse. Anim Behav. 1965; 13(2): 234-41. doi: 10.1016/0003-3472(65)90041-2. 25. Shaw MA, Rasmussen KM, Myers TR. Consumption
of a high fat diet impairs reproductive performance in Sprague-Dawley rats. J Nutr. 1997 [cited 2009 Feb 1]; 127(1):64-9. Available from: <http://jn. nutrition.org/content/127/1/64.long>.
26. Rasmussen KM. The influence of maternal nutrition on lactation. Annu Rev Nutr. 1992; 12:103-17. doi: 10.1146/annurev.nu.12.070192.000535. 27. Moretto VL, Ballen MO, Gonçalves TSS, Kawashita
NH, Stoppiglia LF, Veloso RV, et al. Low-protein diet during lactation and maternal metabolism in rats. Obstet Gynecol. 2011; 2011:876502. doi: 10.54 02/2011/876502.
28. Xu RY, WanYP, Tang QY, Wu J, Cai W. Carbohydrate-to-fat ratio affects food intake and body weight in Wistar rats. Exp Biol Med. 2010; 235(7):833-8. doi: 10.1258/ebm.2010.009276.
29. Guo F, Jen K-LC. High-fat feeding during pregnancy and lactation affects offspring metabolism in rats. Physiol Behavior. 1995; 57(4):681-6. doi: 10.1016/00 31-9384(94)00342-4.
30. Fernandes FS, Carmo MGT do, Herrera E. Influence of maternal diet during early pregnancy on the fatty acid profile in the fetus at late pregnancy in rats. Lipids. 2012; 47(5):505-17. doi: 10.1007/s11745-01 2-3660-7.
31. Ballen MLO, Moretto VL, Santos MP dos, Gonçalves TSS, Kawashita NH, Stoppigli LF, et al. Protein restriction in pregnancy: Effects related to dam metabolism. Arq Bras Endocrinol Metab 2009; 53(1):87-94. doi: 10.1590/S0004-2730200 9000100013.
32. Del Prado M, Delgado G, Vilalpando S. Maternal lipid intake during pregnancy and lactation alters milk composition and production and litter growth in rats. J Nutr. 1997 [cited 2011 Sept 18]; 127:458-62. Available from: <http://jn.nutrition.org/content/ 127/3/458.long>.
33. Marín MC, Alaniz MJT de. Relationship between dietary oil during gestation and lactation and biosynthesis of polyunsaturated fatty acids in control and in malnourished dam and pup rats. J Nutr Biochem. 1998; 9(7):388-95.