ABSTRACT
original ar
José Salvador Rodrigues
in Hodgkin’s disease
Division of Hematology and Transfusion Medicine, Hospital São Paulo,
Universidade Federal de São Paulo – Escola Paulista de Medicina
(Unifesp-EPM), São Paulo, Brazil
INTRODUCTION Hodgkin’s disease (HD) is a neoplasm that has the characteristic of containing a small number of scattered large multinucleated or mononucleated cells, designated Reed-Sternberg cells and Hodgkin cells respectively, residing in a heterogeneous admixture of in-fl ammatory and accessory cells.1,2 The paucity of Hodgkin and Reed-Sternberg (HRS) tumor cells initially made it diffi cult to determine the origins of these cells.1-3 However, high-density genomic expression and immunoglobulin H (IgH) variable-region gene rearrangements using single-cell analysis obtained by microdis-section techniques have now demonstrated an origin in germinative B cell centers.4-9
There are few previous studies in the lit-erature evaluating cell proliferation and this may be explained by the complex nature of this neoplasm and its heterogeneous cell com-position.10 It has already been described that, in HD, HRS cells express proliferating cell nuclear antigen (PCNA) and p53 in more than 50% of the cases and that these expressions may play a role in the pathogenesis of the disease.11 PCNA is a cell cycle-associated protein that interferes with cell proliferation in normal and tumor cells. It is an essential protein in DNA repair. PCNA is detected by positive reaction for the monoclonal antibody PC-10.10,11 PCNA activity in DNA repair increases resistance to chemotherapy in which the cytotoxicity de-pends on its integrity.12 PCNA expression in relapsed HD is greater than at diagnosis.12
Wild-type p53 protein encoded by the p53
gene acts in the cell cycle to interrupt it at the G1 phase.13 This suppressive activity allows DNA repair in injured cells and avoids apoptosis.14 Deletion or mutation of p53 is classically associ-ated with p53 tumor activity.13-15 Mutated p53 has a mean half-life of six to eight hours and no suppressive action, and it is easily detectable by immunohistochemistry methods. Mutated p53 replaces the wild-type p53 that is present
CONTEXT AND OBJECTIVE: Tumor cells in Hodgkin’s disease (HD) express cell proliferation markers that are evaluated according to the onco-genes involved or the expression of their proteins. Correlations between the protein expression grade and clinical data are now important for disease prognosis.
DESIGN AND SETTING: This was a retrospective analysis on proliferating cell nuclear antigen (PCNA), p53 and MDM2 (murine double minute-2) expression using immunohistochemistry, on formalin-fi xed, parafformalin-fi n-embedded tissues from diagnostic biopsies on 51 patients with HD. The study was conducted at the Division of Hematology and Trans-fusion Medicine, Hospital São Paulo, Universidade Federal de São Paulo.
METHODS:Antigen expression was evaluated as the proportions of positive Hodgkin and Reed-Sternberg (HRS) cells and reactive lymphocytes (L), which were compared using Spearman correla-tion coeffi cients. The Friedman test was used for comparisons between the markers. The Pearson test was used to investigate associations between marker expression and clinical and laboratory pa-rameters, marrow involvement, complete remission (CR) and overall survival (OS) rates.
RESULTS:There was overexpression of antigen proteins in HRS, in relation to L (p < 0.001). In HRS, MDM2 was higher than p53 and PCNA (p < 0.003), while the latter two were equivalent. In L, p53 was lower than MDM2 and PCNA (p < 0.001), while the latter two were equiva-lent. There was no relationship between protein expression and clinical and laboratory variables or outcome.
CONCLUSIONS:PCNA, p53 and MDM2 are tumor markers for HD, but showed no clinical or prognostic signifi cance in our analysis.
KEY WORDS:Proliferating cell nuclear antigen. p53 genes. Proto-oncogene proteins c-mdm2. Hodgkin disease. Immunohistochemistry.
in low intracellular concentrations, and has a shorter half-life of 20 min.13-16p53 mutation is missense and occurs mainly between exons 5 and 9.15,16p53 mutations lead to loss of sup-pressive function, thereby accelerating tumor genesis.13,14 p53 overexpression has been widely detected in HD, even in the absence of known
p53 mutations.12,15,17-20 The MDM2 (murine cell double minute-2) gene encodes the p90 protein, which binds to wild-type p5317,18 to inhibit its suppressive activity in transcription.19,20 Associ-ated expression of p53 and MDM2 is present in more than 90% of HD cases.17-19,21
The Epstein-Barr virus (EBV) genome is found in up to 50% of cases of HD.22 EBNA-1 (Epstein-Barr nuclear antigen-1) bonds with p53 and it has been suggested that EBNA-1 expres-sion results from that interaction.23 The exact role of EBV in HD genesis is not clear yet.22,23
OBJECTIVE The present study had the aims of evalua-ting p53, PCNA and MDM2 protein expres-sion using immunohistochemical methods, on formalin-fi xed, paraffi n-embedded preserved tissue samples used for HD diagnosis, and correlating these expressions with clinical and laboratory parameters in order to evaluate their impact on HD outcome.
PATIENTS AND METHODS
Patients
Patients
Our sample consisted of 126 patients with HD that were followed up over the period from Janaury 1992 to December 1996 at Hemato-logy Division of Unifesp/EPM. The admissions for the fi rst-line treatment of these patients were from December 1976 to December 1996. Suf-fi cient parafSuf-fi n-embedded blocks of diagnostic tissues were available in relation to 51 patients from this sample for performing new histo-logical analyses with hematoxylin-eosin staining and for making immunohistochemistry slides
for PCNA, p53 and MDM2 analysis. Fifty-one other patients out of the remaining 75 were randomly selected as a control group. The paraffi n-embedded blocks were obtained from the Pathology Department of Unifesp.
The patients’ records were retrospectively reviewed to collect data on gender, age, Ann Arbor clinical stage, B symptoms (fever, weight loss and night sweating), histological subtype, hemoglobin level, white blood count (WBC), erythrocyte sedimentation rate (ESR), alkaline phosphates and bone marrow involvement. First complete remission (CR) and overall survival (OS) were also evaluated (Table 1). Nine of these patients (six in the study group and three in the control group) were not evaluated with regard to the achievement of fi rst CR and OS, but they had diagnostic and staging data available and therefore they were included because of these criteria.
The fi rst patient was treated and followed up starting in 1976 and the remainder from 1980 onwards. Subsequently, the treatment proto-cols changed over the course of time. Patients treated before 1985 received chemotherapy us-ing the MOPP (mechlorethamine, vincristine, prednisone and procarbazine) protocol, while those treated after that year received either the MOPP/ABV (MOPP plus doxorubicin, bleomycin and vincristine) hybrid protocol or the MOPP/ABVD (ABV plus dacarbazine) alternative regimen.24 Involved-fi eld radiation therapy was performed on all stage I and II
pa-tients and on most stage III papa-tients, except those with bulky disease, who received extended-fi eld radiation therapy.24
There were no signifi cant differences between the control and study groups with regard to the following variables: age (p = 0.19), hemoglobin level (p = 0.99), WBC (p = 0.53), ESR (p = 0.37) A and B symptoms (p = 0.14), bone marrow infi ltration (p = 0.46), likelihood of achieving the fi rst complete remission (CR) (p = 0.68), overall survival (OS) (p = 0.83) and stages (I + II, III + IV) (p = 0.99). In relation to histological subtypes (LP + NE), (MC + LD) (LP = lymphocyte predomi-nance; NE = nodular sclerosis; MC = mixed cel-lularity; LD = lymphocyte depletion) (p = 0.03), greater frequency of NE in the study group than in the control group was observed.
Forty-fi ve out of 51 patients in the study group and 48 out of 51 in the control group could be evaluated regarding achievement of fi rst CR and OS. There were 12 deaths: 7/48 (14%) and 5/45 (11%) in the control and studied groups, respectively.
This study was approved by the Ethics Committee of Universidade Federal de São Paulo, and informed consent was obtained from all subjects who were still alive.
Methods
All the lymph node biopsies were pre-served in formalin and embedded in paraf-fi n. Samples were then restained using the hematoxylin-eosin method and reviewed
by two hematopathologists. The minimum immunohistochemistry panel consisted of anti-CD30 and CD15 antibodies. Once HD had been confi rmed, PCNA, p53 and MDM2 antibodies were also included. The tissue sections underwent routine treatment. Antigenic recovery was performed by im-mersing the slides in 0.001 M citrate buffer (pH 6.0) and heating in a microwave oven at maximum power for 45 minutes. After cool-ing for 20 minutes at room temperature, the slides were washed under running water for fi ve minutes and distilled water for a further fi ve minutes. Endogenous peroxidase was then blocked by immersing the slides in a 0.006% hydrogen peroxide solution for two nine-minute periods, each followed by rinsing using distilled water and phosphate buffer solution (PBS).
Monoclonal antibodies were added at the concentrations recommended by the manufac-turer, as follows. For PCNA: PC-10 (Dako, catalog no. MO-879) at 1/200 concentration for 18 hours at 4° C, followed by PBS wash-ing; for MDM2: MDM2 (Novocastra, catalog no. NCR-MDM2) at 1/200 concentration; and for p53: DO7 (Novocastra, catalog no. NCL-p53DO7) and BP (Novocastra, catalog no. NCL-p53BP), at 1/50 concentration for both, incubated for 18 hours at 4º C. The secondary antibody was biotinylated rabbit anti-mouse (Dako, catalog no. E-0354), at 1/100 concentration. Development occurred after incubation with the streptavidin-biotin-peroxidase-ABC complex (Dako, catalog no. K-377 A-B), at 1/200 concentration for 30 minutes at 37° C, followed by development on a chromogenic substrate of 3,3’ diaminoben-zidine (PAB-Sigma, catalog no. D-5637) at 0.006% concentration in PBS, adding 100 µl of hydrogen peroxide at 30 volumes for each 10 ml of solution.25
The PCNA samples were counterstained with Fast-Green (Inlab, catalog no. 3870) and p53 and MDM2 with Harris hematoxylin. Negative controls were obtained from dis-tinctive parts of the same slide, by omission of the tested monoclonal antibody. Positive controls were obtained from breast cancer slides that were known to be positive for p53, MDM2 and PCNA, which were provided by the pathology department of our institution. The number of positive cells was determined from the HRS and L counts. Positive cells were defi ned as all cells with any pattern of nuclear staining; negative cells were those without this. Two of the present authors performed the counting, using an optical microscope at a magnifi cation of 1000 times,
Table 1.Dichotomization and coding of variables evaluated
Code
Variable 0 1
Gender Male Female
Age < 40 years ≥ 40 years
Histological subtype LP and NE MC and LD Clinical stage Ι and ΙΙ ΙΙΙ and ΙV
B Symptoms No Yes
Hemoglobin Level < 12 g ≥ 12 g
WBC < 10X109/l ≥ 10 X109/l
ESR < 20 mm ≥ 20 mm
Alkaline phosphatase < 150 U ≥ 150 U Bone marrow
involve-ment* Negative Positive
%HRS + MDM2 < median (= 59.37%) ≥ median %HRS + PCNA < median (= 52.72%) ≥ median %HRS + p53 < median (= 53.45%) ≥ median
with a 100-dot integrator (Zeiss), in fi ve randomly chosen different fi elds. In every case, a positive-negative ratio was calculated for HRS and L after specifi c and general proportion ratios for positive and negative L and HRS cells had been obtained.
Statistical analysis
Statistical analysis
The tests used were the Wilcoxon test and Spearman coeffi cient to compare marker expression between HRS and L, Friedman’s test to determine differences between the markers (PCNA, p53 and MDM2) in HRS and L, and Pearson’s chi-squared test to evaluate clinical and labora-tory variables. CR achievement and OS were calculated by the Kaplan-Meier method and the curves were compared using log-rank tests. Multivariate analysis was based on the Cox regression model. Variables were dichotomized for univariate and multivari-ate analysis regarding CR achievement and OS. Two-tailed p < 0.05 was considered statistically signifi cant.
RESULTS There was preponderance of male sub-jects: 34 patients were male (67%) and 17 were female (33%). Their ages ranged from 9 to 88 years (median: 32 years). Nodular sclerosis was the most common histologi-cal subtype and was found in 38 patients (74.5%), followed by mixed cellularity in seven patients (13.7%), lymphocyte de-pletion in three (5.8%) and lymphocyte predominance in three (5.8%). Ann Arbor clinical stage I was found in three patients (5.8%), II in 14 (27.4%), III in 16 (31.3%) and IV in 18 (35.3%). Therefore, 66.6% had advanced disease (stage III or IV) at diagnosis. Moreover, 36 out of the 51 pa-tients (72.5%) presented with B symptoms. The fi rst-line therapy was thus the MOPP/ ABV hybrid for 39 patients, MOPP for six patients and the MOPP/ABVD alternative scheme in four cases.24 Involved-fi eld radiation therapy was performed in 28 cases and extend-ed-fi eld radiation therapy in 12 patients.
The median hemoglobin level was 11.7 g/dl (ranging from 4.4 g/dl to 16.3 g/dl), median WBC was 8 x 10⁹/µl, median ESR was 58 mm/h and median alkaline phosphatase was 233 U/l. Bone marrow analysis was negative in 40 patients, positive in eight and not available in three patients.
The mean MDM2 expression was 60% in HRS and 20.7% in L (p < 0.001). For p53, the mean expression was 52.9% in HRS and 5.9% in L (p < 0.001). For PCNA, the mean
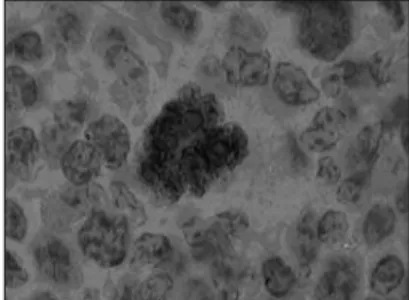
expression was 53.4% in HRS and 20% in L (p < 0.001) (Graphs 1, 2 and 3 and Tables 1, 2, 3 and 4). The expression of these tumor markers in HRS was predominantly in the nucleus, and was more positive in tumors than in reactive lymphocytes, for all three markers (Figures 1, 2 and 3 and Graphs 1, 2, 3 and 4).
PCNA, p53 and MDM2 were not as-sociated with gender, age, clinical stage, B symptoms, histological subtype, hemoglobin level, WBC, alkaline phosphatase, ESR or bone marrow involvement (Tables 2, 3 and 4). Univariate analysis between the proportions of marker expression in the tumor cells and all other variables investigated showed tendencies to cor-relate between MDM2 and PCNA (p = 0.07) (Graph 5, Table 2); PCNA and p53 (p = 0.12) (Graph 5 and Tables 3 and 4); alkaline phosphatase index higher than 150 U and MDM2 (p = 0.09); and unfavorable histology and p53 (p = 0.15) (Tables 1, 2, 3 and 4), but there was no association of marker expression between MDM2 and p53 (p = 0.88 in the Kaplan-Meier test) (Graph 5 and Tables 3 and 4). Multivariate statistical analysis also showed no signifi cant differences.
The expression of different markers had no signifi cant infl uence on CR achievement: p53 (p = 0.49); MDM2 (p = 0.59) and PCNA (p = 0.62). No signifi cant infl uence on OS was found in relation to PCNA (p = 0.13), MDM2 (p = 0.21) or p53 (p = 0.54). The median OS for the study and control groups has not yet been reached. Therefore, we used the whole avai-lable population of 93 patients to analyze any pos-sible associations for fi rst CR and OS in relation to the other variables. The univariate analysis for the likelihood of achieving the fi rst CR showed that B symptoms (p < 0.001), WBC ≥ 10 x 109/µl (p = 0.01), stage (III + IV) (p = 0.01) and hemo-globin < 12 g/dl (p = 0.04) negatively infl uenced the possibility of achieving this. The results for bone marrow infi ltration (p = 0.07) and age
(p = 0.17) were close to reaching signifi cance. The Cox regression model indicated that B symptoms (p = 0.001) and WBC ≥ 10 x 109/µl (p = 0.01) were independent from the other analyzed variables in relation to the fi rst CR.
All the patients without B symptoms (n = 22) and those with ESR less than 20 (n = 7) were still alive at the end of this study. However, these fi ndings made it impossible to input these variables for multivariate analyses for OS.
In the univariate analysis, marrow in-volvement (p = 0.05), hemoglobin < 12 g/dl (p = 0.06), WBC ≥ 10 x 109/µl (p = 0.07) and male sex (p = 0.1) showed tendencies towards lower OS. The log rank test demonstrated that bone marrow infi ltration (p = 0.002), B symp-toms (p = 0.03) and hemoglobin < 12 g/dl (p = 0.04) had a negative infl uence on OS. With regard to the CR ratios, 33/45 (73.3%) in the study group and 36/48 (75%) among the controls achieved CR; 6/45 (13.3%) in the study group and 3/48 (6.2%) among the controls obtained partial response; and 6/45 (13.3%) in the study group and 9/48 (18.7%) among the controls failed to achieve remission after the fi rst treatment measures.
Figure 1. Photomicrograph of lymph node showing nuclear p53 expression in Reed-Sternberg cells, developed by peroxidase; 1000x magnifi cation.
Figure 2. Photomicrograph of lymph node showing nuclear MDM2 expression in Hodg-kin cells (upper right and left arrows) and lymphocytes (lower right arrow), developed by peroxidase; 400x magnifi cation.
DISCUSSION HD is a unique human neoplasm consis-ting of a benign component of lymphocytes, plasmacytes, eosinophils and neutrophils with evident cellular polymorphism, in association with a much smaller component of tumor cells (HRS) comprising around 1% of the tumor mass.1-3
The cell proliferation rate is an important parameter for better understanding of the clinical picture and for guiding the appropri-ate therapy. PCNA monoclonal antibodies allow cell proliferation to be evaluated in clinical practice using immunohistochemical methods.10-12 In non-neoplastic small lym-phocytes in HD tissues, PCNA expression is always low.10-12,26,27 Schmid et al.28 evalu-ated 23 cases of HD by double labeling with PC-10 monoclonal antibody and CD20 (B cells), and PC-10 and CD45RO (T cells), and found positivity in 50.4% of HRS and 4.3% of lymphocytes. HRS cells express PCNA in 5 to 100% of the cases. It has been demonstrated that the intensity of PCNA expression has an infl uence over clinical stages and response to treatment.12,27,28
We found PCNA-positive rates for HRS cells that ranged from 36.9% to 73.68% (median of 52.7%), which were similar to previously reported studies.10-12 We found higher values for PCNA in reactive lym-phocytes than did most previous researchers (median of 18.8%).12,27,28 These differences are probably due to variations in the methods and discrepancies in manual cell counts between the individuals doing the counting.
There are many studies evaluating p53 and MDM2 expression in neoplasms. p53
mutations without differences in protein expression have been reported.15,17-19,21,22 We characterized p53 using two different clones: BP and DO7. p53 expression was similar for these two clones (data not shown). This indi-cates that p53 expression in the wild type or in the mutated form may be evaluated using immunohistochemical methods either in fresh tissue or in formalin-fi xed, paraffi n-embedded preserved material. The application of this analysis depends on the characteristics and specifi city of the monoclonal or polyclonal antibodies for p53.15,16,20,26,29
Latent EBV infection was initially sug-gested as a possible cause for p53mutation. This hypothesis has never been confi rmed in clinical studies. The possibility of an associa-tion between latent EBV infecassocia-tion and p53 was fi rst evaluated by Neidobitek et al.30 in 37 patients in 1993. Only seven cases that were positive for p53 were also positive for
100
80
60
40
20
0
0 20 40 60 80 100
MDM2 % HRS + MDM2 % L +
Graph 1. Dispersion of proportional values for MDM2 expression between Hodgkin and Reed-Sternberg (HRS) cells and lymphocytes (L).
100
80
60
40
20
0
0 20 40 60 80 100
P53 % HRS + P53 % + L
Graph 2. Dispersion of proportional values for p53 expression between Hodgkin and Reed-Sternberg (HRS) cells and lymphocytes (L).
100
80
60
40
20
0
0 20 40 60 80 100
PCNA % HRS + PCNA % L +
EBV proteins (EBER-1 or EBER-2). It is assumed that an association between p53 and EBV could be a consequence of EBV encoding proteins that are bonded to p53. Chilosi et al.17 investigated nuclear EBV using
in situ hybridization for EBER-1 and
im-munohistochemistry for LMP-1 after double staining for p53 and MDM2. They found that 12 out of 72 patients who were positive for EBV were also positive for MDM2 and p53 concomitantly.
The role of MDM2 protein expression in activating/inhibiting the p53 gene and in stabilizing p53 has also already been stud-ied. Chen et al.20 showed that there was no relationship between MDM2 expression and
p53 mutations. MDM2 and p53 expression in HRS cells ranged from 30 to 80%.12,17,21,26 In our study, concomitancy of p53 and MDM2 was found in only 37% of the cases. The lowest marker expression in reactive lymphocytes that we found, especially for p53, was comparable to previous descriptions.12,16,17,21,26 Positive lymphocyte reactions for PCNA and MDM2 at similar frequencies have also often been reported.10-12,17,18,26,31 Our positive results for PCNA, p53 and MDM2 in HRS cells are similar to those described by Martinez-Delgado et al.29 and Sánchez-Beato et al.26 In both of those studies, double staining for p53/MDM2 was performed and variable marker expression in HRS cells was also found.
Using histomorphometric techniques taking median values as thresholds, we found that the numerical expression of MDM2 was higher than those of PCNA and p53 in HRS cells, while there was no difference between PCNA and p53 expressions. The possible ex-planations for this fi nding are: 1) the antigen recovery technique utilized may have led to higher expression of epitopes for MDM2-specifi c antibodies; 2) MDM2 protein stability may be higher in formalin-fi xed, paraffi n-em-bedded tissue; 3) the characteristics of the anti-bodies utilized; and 4) the balance between the p53 and MDM2 pathways may favor MDM2 expression because of other mechanisms for p53 inhibition. We found a statistically signifi cant lower proportion of lymphocytes were positive for p53 than were positive for PCNA and MDM2. This was also observed by Smolewski et al. in 1998,31 who described mean reactivity of lymphocytes for PCNA of 39.6%. According to most published studies, PCNA was expressed at higher frequencies than was p53.21,26,31 Histomorphometry was comparable to computed readings in the study by Sánchez-Beato et al.26 in 1996, for both markers.
Graph 4. Comparison of positive lymphocyte (L) expression for MDM2, p53 and proliferating cell nuclear antigen (PCNA).
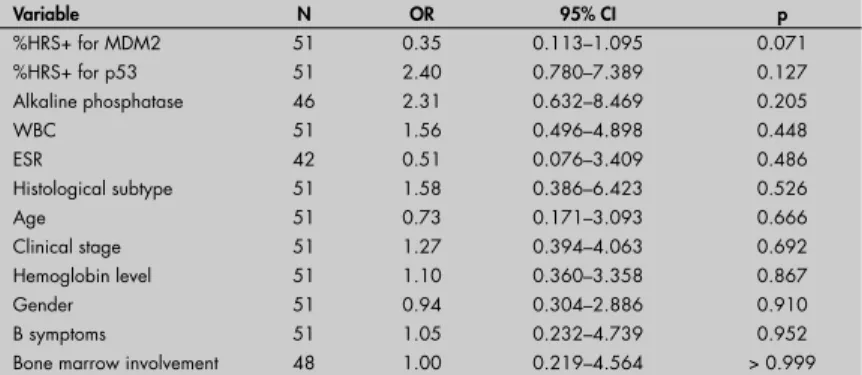
Table 2. Univariate analysis. Odds ratios (OR) for the percentage of positivity in Hodgkin and Reed-Sternberg cells (%HRS+) (≥ mean or < mean) for PCNA
Variable N OR 95% CI p
%HRS+ for MDM2 51 0.35 0.113–1.095 0.071
%HRS+ for p53 51 2.40 0.780–7.389 0.127
Alkaline phosphatase 46 2.31 0.632–8.469 0.205
WBC 51 1.56 0.496–4.898 0.448
ESR 42 0.51 0.076–3.409 0.486
Histological subtype 51 1.58 0.386–6.423 0.526
Age 51 0.73 0.171–3.093 0.666
Clinical stage 51 1.27 0.394–4.063 0.692
Hemoglobin level 51 1.10 0.360–3.358 0.867
Gender 51 0.94 0.304–2.886 0.910
B symptoms 51 1.05 0.232–4.739 0.952
Bone marrow involvement 48 1.00 0.219–4.564 > 0.999
OR = odds ratio; CI = confi dence interval; HRS = Hodgkin and Reed-Sternberg cells; PCNA = proliferating cell nuclear antigen, WBC = whole blood count; ESR = erythrocyte sedimentation rate.
60
50
40
30
20
10
0
PCNA % L + P53 % L +
MDM2 % L +
Friedman test: χ2
2gl = 59.65 (df = degrees of freedom); p < 0.001; dms = 23.67 (dms = minimum signifi cant difference); MDM2 versus p53: 123 - 57 = 66*; MDM2 versus PCNA: 123 - 126 = -3; p53 versus PCNA: 57 - 126 = -69*
Table 3.Univariate analysis. Odds ratios (OR) for the percentage of positivity in Hodgkin and Reed-Sternberg cells (%HRS+) (≥ mean or < mean) for MDM2
Variable n OR 95% CI p
%HRS+ for PCNA 51 0.35 0.113–1.095 0.071
Alkaline phosphatase 46 0.31 0.080–1.204 0.091
Clinical stage 51 1.81 0.556–5.886 0.324
B symptoms 51 0.57 0.121–2.702 0.481
Histological subtype 51 1.58 0.386–6.423 0.526
Age 51 0.73 0.171–3.093 0.666
Hemoglobin level 51 0.80 0.260–2.431 0.688
WBC 51 0.79 0.255–2.476 0.691
ESR 42 0.78 0.117–5.257 0.802
%HRS+ for p53 51 0.92 0.308–2.769 0.886
Bone marrow involvement 48 0.90 0.198–4.131 0.897
Gender 51 0.94 0.304–2.886 0.910
Our data show that, in the “benign” infl ammatory component of HD, there are proliferating and differentiating lymphocytes that are morphologically normal but carry positivity for proliferation markers near to HRS cells. These lymphocytes may corre-spond to precursors of HRS, as proposed by Hell et al.27 in 1993. The fi nding of higher expression of MDM2 than of PCNA and p53 in HRS cells may raise the possibility of a feedback mechanism between the MDM2
andp53 genes.31-33
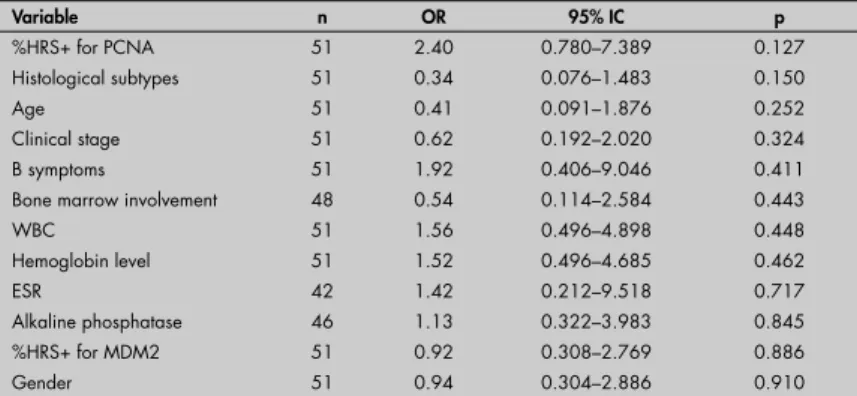
Table 4. Univariate analysis. Odds ratios (OR) for the percentage of positivity in Hodgkin and Reed-Sternberg cells (%HRS+) (≥ mean or < mean) for p53
Variable n OR 95% IC p
%HRS+ for PCNA 51 2.40 0.780–7.389 0.127
Histological subtypes 51 0.34 0.076–1.483 0.150
Age 51 0.41 0.091–1.876 0.252
Clinical stage 51 0.62 0.192–2.020 0.324
B symptoms 51 1.92 0.406–9.046 0.411
Bone marrow involvement 48 0.54 0.114–2.584 0.443
WBC 51 1.56 0.496–4.898 0.448
Hemoglobin level 51 1.52 0.496–4.685 0.462
ESR 42 1.42 0.212–9.518 0.717
Alkaline phosphatase 46 1.13 0.322–3.983 0.845
%HRS+ for MDM2 51 0.92 0.308–2.769 0.886
Gender 51 0.94 0.304–2.886 0.910
OR = odds ratio; HRS = Hodgkin and Reed-Sternberg cells; CI = confi dence interval; PCNA = proliferating cell nuclear antigen; WBC = whole blood count; ESR = erythrocyte sedimentation rate; MDM2 = murine double minute-2 antigen.
Graph 5. Comparison of positive Hodgkin and Reed-Sternberg (HRS) cell expression for MDM2, p53 and proliferating cell nuclear antigen (PCNA).
MDM2 % HRS + P53 % HRS + PCNA % HRS +
100
80
60
40
20
0
Friedman test: χ2
2df = 11.80 (df = degrees of freedom); p = 0.003; dms = 23.67 (dms = minimum signifi cant difference); MDM2 versus p53: 124 - 93 = 31*; MDM2 versus PCNA: 124 - 91 = 33*; p53 versus PCNA: 93 - 91 = 2
The occurrence of spontaneous apop-tosis, as evaluated by the TUNEL (in situ
nick-end labeling) technique, ranged from 10 to 60% in HRS cells. The apoptosis index did not correlate with the histological and clinical findings, although a negative association with outcome was reported in 110 cases by Smolewski et al.32 Its presence is not influenced by the EBV genome in HRS cells. PCNA, p53, p21 and caspase 3 are associated with greater apoptosis indices, while BCL-2, MDM2, Rb-1 and P27 are
not.32-35 In a smaller group of patients, it was confi rmed that strong expression of PCNA, p53 and BCL-2 is associated with shorter OS and worse response to treatment.31,33 Brink et al.35 showed that the BCL-2+/p53– immu-nophenotype presented the worst prognosis, while the BCL-2–/p53– immunophenotype had fi ve-year OS of more than 90% and the p53+/BCL-2+ immunophenotype had the best prognosis.35 High expressions of LMP1-EBV in HRS cells presented better response to therapy and better OS, while Rb-1 had worse prognosis. p53, BCL-2 and CD15 did not infl uence the outcome.30,36-38 We emphasize that MDM2 and PCNA, MDM2 and p53 expression, and also p53 expression versus unfavorable histology were close to reaching signifi cance in the univariate analyses. These data show that, if a larger sample were used, a signifi cant result might be found, as observed by other authors.17-19,33-35,39
B symptoms and WBC counts higher than 10x109/µl were unfavorable independ-ent factors for achieving the first CR. Bone marrow tumor infiltration, B symptoms and hemoglobin levels less than 12 g/dl had a negative influence on OS. These data have also been reported as negative prognostic factors for survival in HD.24,32,34,39 The present study was a retrospective analysis, but these findings have led us to attempt to be more specific regarding prognostic factors in this disease.38 The treatment for HD changed over the admission period for these patients, but the ratios of first CR and OS remained almost the same, because of the high sensitivity of the tumor to chemotherapy.34
1. Falini B, Stein H, Pileri S, et al. Expression of lymphoid-associated antigens on Hodgkin’s and Reed-Sternberg cells of Hodgkin’s disease. An immunocytochemical study on lymph node cytospins using monoclonal antibodies. Histopathology. 1987;11(12):1229-42. 2. Hsu SM, Hsu PL. Aberrant expression of T cell and B-cell markers
in myelocyte/monocyte/histiocyte-derived lymphoma and leukemia cells. Is the infrequent expression of T/B cell markers suffi cient to establish a lymphoid origin from Hodgkin’s Reed-Sternberg cells? Am J Pathol. 1989;134(1):203-12.
3. Morgan KG, Quirke P, O’Brien CJ, Bird CC. Hodgkin’s disease: a fl ow cytometric study. J Clin Pathol. 1988;41(4):365-9. 4. Cossman J. Gene expression analysis of single neoplastic cells
and the pathogenesis of Hodgkin’s lymphoma. J Histochem Cytochem. 2001;49(6):799-800.
5. Spieker T, Kurth J, Kuppers R, Rajewsky K, Bräuninger A, Hansmann ML. Molecular single-cell analysis of the clonal relationship of small Epstein-Barr virus-infected cells and Epstein-Barr virus-harboring Hodgkin and Reed/Sternberg cells in Hodgkin disease. Blood. 2000;96(9):3133-8. 6. Kuppers R, Sousa AB, Baur AS, Strickler JG, Rajewsky K,
Hansmann ML. Common germinal-center B-cell origin of malignant cells in two composite lymphomas, involving classical Hodgkin’s disease and either follicular lymphoma or B-CLL. Mol Med. 2001;7(5):285-92.
7. Stein H, Hummel M. Cellular origin and clonality of classic Hodgkin’s lymphoma: immunophenotypic and molecular studies. Semin Hematol. 1999;36(3):233-41.
8. Falini B, Fizzotti M, Pucciarini A, et al. A monoclonal antibody (MUM1p) detects expression of the MUM1p/IRF4 protein in a subset of germinal center B cells, plasma cells, and activated T cells. Blood. 2000;95(6):2084-92.
9. Foss HD, Reusch R, Demel G, et al. Frequent expression of the B-cell-specifi c activator protein in Reed-Sternberg cells of classical Hodgkin’s disease provides further evidence for its B-cell origin. Blood. 1999;94(9):3108-13.
10. Sabattini E, Gerdes J, Gherlinzoni F, et al. Comparison between the monoclonal antibodies Ki-67 and PC10 in 125 malignant lymphomas. J Pathol. 1993;169(4):397-403.
11. Garcia RL, Coltrera MD, Gown AM. Analysis of proliferative grade using anti-PCNA/cyclin monoclonal antibodies in fi xed, embedded tissues. Comparison with fl ow cytometric analysis. Am J Pathol. 1989;134(4):733-9.
12. Naresh KN, O’Conor GT, Soman CS, et al. A study of p53 protein, proliferating cell nuclear antigen, and p21 in Hodgkin’s disease at presentation and relapse. Hum Pathol. 1997;28(5):549-55.
13. Levine AJ, Momand J, Finlay CA. The p53 tumour suppressor gene. Nature. 1991;351(6326):453-6.
14. Fritsche M, Haessler C, Brandner G. Induction of nuclear accumulation of the tumor-suppression protein p53 by DNA-damaging agents. Oncogene. 1993;8(2):307-18. 15. Trümper LH, Brady G, Bagg A, et al. Single-cell analysis of Hodgkin
and Reed-Sternberg cells: molecular heterogeneity of gene expres-sion and p53 mutations. Blood. 1993;81(11):3097-115. 16. Xerri L, Bouabdallah R, Camerlo J, Hassoun J. Expression of
the p53 gene in Hodgkin’s disease: dissociation between im-munohistochemistry and clinicopathological data. Hum Pathol. 1994;25(5):449-54.
17. Chilosi M, Doglioni C, Menestrina F, et al. Abnormal expression of the p53-binding protein MDM2 in Hodgkin’s disease. Blood. 1994;84(12):4295-300.
18. Elenitoba-Johnson KS, Medeiros LJ, Khorsand J, King TC. P53 expression in Reed-Sternberg cells does not correlate with gene mutations in Hodgkin’s disease. Am J Clin Pathol. 1996;106(6):728-38.
19. Xerri L, Parc P, Bouabdallah R, Camerlo, J, Hassoun J. PCR-mismatch analysis of p53 gene mutation in Hodgkin’s disease. J Pathol. 1995;175(2):189-94.
20. Chen WG, Chen YY, Kamel OW, Koo CH, Weiss LM. p53 muta-tions in Hodgkin’s disease. Lab Invest. 1996;75(4):519-27. 21. Martinez JC, Mateo M, Sanchez-Beato M, et al. MDM2
expression in lymphoid cells and reactive and neoplastic lym-phoid tissue. Comparative study with p53 expression. J Pathol. 1995;177(1):27-34.
22. Weiss L, Chen YY, Liu XF, Shibata D. Epstein-Barr virus and Hodgkin’s disease. A correlative in situ hybridiza-tion and polymerase chain reachybridiza-tion study. Am J Pathol. 1991;139(6):1259-65.
23. Tzardi M, Kouvidou C, Panayiotides I, et al. Expression of p53 and mdm-2 proteins in Hodgkin’s Disease. Absence of correla-tion with the presence of Epstein-Barr virus. Anticancer Res. 1996;16(5A):2813-9.
24. Yuen AR, Horning SJ. Recent advances in Hodgkin’s disease. Curr Opin Hematol. 1996;3(4):273-8.
25. Hsu SM, Raine L, Fanger K. Use of avidin-biotin-peroxidase complex (ABC) in immunoperoxidase techniques: a comparison between ABC and unlabeled antibody (PAP) procedures. J Histochem Cytochem. 1981;29(4):577-80.
26. Sánchez-Beato M, Piris MA, Martínez-Montero JC, et al. MDM2 and p21WAF1/CIP1, wild-type p53-induced proteins, are regularly expressed by Sternberg-Reed cells in Hodgkin’s disease. J Pathol. 1996;180(1):58-64.
27. Hell K, Lorenzen J, Hansmann ML, Fellbaum C, Busch R, Fischer R. Expression of the proliferating cell nuclear antigen in the different types of Hodgkin’s disease. Am J Clin Pathol. 1993;99(5):508-603.
28. Schmid C, Sweeney E, Isaacson PG. Proliferating cell nuclear antigen (PCNA) expression in Hodgkin’s disease. J Pathol. 1992;168(1):1-6. 29. Martinez-Delgado B, Robledo M, Arranz E, et al. Correlation
between mutations in p53 gene and protein expression in human lymphomas. Am J Hematol. 1997;55(1):1-8.
30. Niedobitek G, Rowlands DC, Young LS, et al. Overexpression of p53 in Hodgkin’s disease: lack of correlation with Epstein-Barr virus infection. J Pathol. 1993;169(2):207-12. 31. Smolewski P, Niewiadomska H, Blonski JZ, Robak T, Krykowski E.
Expression of proliferating cell nuclear antigen (PCNA) and p53, bcl-2 or C-erb B-2 proteins on Reed-Sternberg cells: prognostic signifi cance in Hodgkin’s disease. Neoplasma. 1998;45(3):140-7. 32. Smolewski P, Niewiadomska H, Los E, Robak T. Spontaneous
apoptosis of Reed-Sternberg and Hodgkin cells; clinical and pathological implications in patients with Hodgkin’s disease. Int J Oncol. 2000;17(3):603-9.
33. Smolewski P, Niewiadomska H, Krykowski E, Robak T. Expression of p21 and MDM-2 proteins on tumor cells in responding and non-responding patients with Hodgkin’s disease. Neoplasma. 1999;46(4):212-8.
34. Smoleswski P, Robak T, Krykowski E, et al. Prognostic factors in Hodgkin’s disease: multivariate analysis of 327 patients from a single institution. Clin Cancer Res. 2000;6(3):1150-60. 35. Brink AA, Oudejans JJ, van den Brule AJ, et al. Low p53 and
high bcl-2 expression in Reed-Sternberg cells predicts poor clinical outcome for Hodgkin’s disease: involvement of apoptosis resistance? Mod Pathol. 1998;11(4):376-83.
36. Montalban C, Abraira V, Morente M, et al. Epstein-Barr virus-latent membrane protein 1 expression has a favorable infl uence in the outcome of patients with Hodgkin’s Disease treated with chemotherapy. Leuk Lymphoma. 2000;39(5-6):563-72. 37. Murray PG, Billingham LJ, Hassan HT, et al. Effect of
Epstein-Barr virus infection on response to chemotherapy and survival in Hodgkin’s disease. Blood. 1999;94(2):442-7. 38. Spector N, Milito CB, Biasoli I, Luiz RR, Pulcheri W, Morais
JC. The prognostic value of the expression of Bcl-2, p53 and LMP-1 in patients with Hodgkin’s lymphoma. Leuk Lymphoma. 2005;46(9):1301-6.
39. Montalban C, Garcia JF, Abraira V, et al. Infl uence of biologic markers on the outcome of Hodgkin’s lymphoma: a study by the Spanish Hodgkin’s Lymphoma Study Group. J Clin Oncol. 2004;22(9):1664-73.
Sources of funding: None Confl ict of interest: None Date of fi rst submission:June 15, 2004 Last received:April 8, 2007 Accepted:April 12, 2007
AUTHOR INFORMATION Gevina Silva Pinheiro, MD. Postgraduate student, Division of Hematology and Transfusion Medicine, Hospital São Paulo, Universidade Federal de São Paulo — Escola Paulista de Medicina, São Paulo, Brazil.
Maria Regina Régis Silva, MD, PhD. Associate professor, De-partment of Pathology, Universidade Federal de São Paulo — Escola Paulista de Medicina, São Paulo, Brazil. Celso Arrais Rodrigues, MD, PhD. Postgraduate student,
Divi-sion of Hematology and TransfuDivi-sion Medicine, Hospital São Paulo, Universidade Federal de São Paulo — Escola Paulista de Medicina, São Paulo, Brazil.
José Kerbauy, MD, PhD. Titular professor, Department of Medi-cine, Division of Hematology, Universidade Federal de São Paulo — Escola Paulista de Medicina, São Paulo, Brazil. José Salvador Rodrigues de Oliveira MD, PhD. Associate
professor, Department of Medicine, Division of Hematology, Universidade Federal de São Paulo — Escola Paulista de Medicina, São Paulo, Brazil.
Address for correspondence:
José Salvador Rodrigues Oliveira
Departamento de Medicina, Divisão de Hematologia Universidade Federal de São Paulo — Escola Paulista de Medicina
Rua Botucatu, 740 — 3o andar São Paulo (SP) — Brasil — CEP 04023-900 Tel. (+55 11) 5576-4237 / (+55 11) 5576-4240 Fax (+55 11) 5571-8806
E-mail: [email protected]
Copyright © 2007, Associação Paulista de Medicina
RESUMO Proliferação de antígeno de célula nuclear (PCNA), p53 e expressão de MDM2 em doença do Hodgkin
CONTEXTO E OBJETIVO:As células tumorais da doença de Hodgkin (HD) são positivas para marcadores de proliferação celular que são analisados por seus genes e respectivas proteínas. A correlação entre a expressão destas proteínas e os parâmetros clínico-laboratoriais são, no momento, de importância para o prognóstico da doença.
TIPO DE ESTUDO E LOCAL:Estudo retrospectivo da expressão do antígeno de proliferação celular (PCNA) e da p53 e MDM2 em tecidos obtidos ao diagnóstico, fi xados por formol, embebidos em parafi na de 51 pacientes com HD. O trabalho foi realizado na Divisão de Hematologia e Transfusão, Hospital São Paulo, Universidade Federal de São Paulo.
MÉTODOS:As expressões antigênicas foram analisadas através da proporção de células de Hodgkin e células de Reed Sternberg (HRS) e linfócitos reacionais (L) positivos. A intensidade de expressão de cada proteína foi comparada entre L e HRS através do coefi ciente de Spearman. A comparação da PCNA, p53 e MDM2 em L e HRS se fez pelo teste de Fiedman. As correlações entre variáveis clínico-laboratoriais, comprometimento da medula óssea, taxas de sobrevida geral e remissão clínica com as proteínas em HRS se fi zeram pelo coefi ciente de Pearson.
RESULTADOS:Houve superexpressão das três proteínas em células HRS comparadas aos L (p < 0,001). Nas células HRS, a MDM2 foi maior que a p53 e a PCNA (p < 0,003), que foram equivalentes. Nos L, a p53 foi menor que a MDM2 e a PCNA (p < 0,001), que foram equivalentes Não houve relação entre as expressões das proteínas com as variáveis clínico-laboratoriais e sobrevida.
CONCLUSÕES:PCNA, p53 e MDM2 são marcadores tumorais na HD, porém não mostraram signifi cado clínico-prognóstico em nossa análise.