w w w . a j e r . o r g Page 344
American Journal of Engineering Research (AJER)
e-ISSN: 2320-0847 p-ISSN : 2320-0936
Volume-3, Issue-8, pp-344-352
www.ajer.org
Research Paper Open Access
Validation of Predicted California Bearing Ratio Values from
Different Correlations
K Shiva Prashanth Kumar
1, P M B Raj Kiran Nanduri
2, Prof.N Darga Kumar
31, 2
(Lecturer, Department of Civil Engineering, Adama Science and Technology University, Adama, Ethiopia)
3
(Professor, Department of Building and Civil Engineering, Fiji National University, Suva, Fiji)
ABSTRACT : In the present study different correlations were used to validate the experimental California Bearing Ratio (CBR) values with predicted values proposed by different investigators. For the present study, 17 samples were collected at different intervals of sub grade soil samples from Modjo to Hawassa, in Ethiopia. From the collected samples, the basic index properties like Liquid Limit (LL), Plastic Limit (PL), Shrinkage Limit (SL), Sieve Analysis, Optimum Moisture Content (OMC) and Maximum Dry Density (MDD) have been evaluated in the laboratory. Finally, the experimental results are validated with the predicted results of CBR. All most all the correlations are slightly validating with the experimental results except Agarwal & Ghanekar [1], Vinod & Cletus [2] and NCHRP [3].
Keywords -CBR value, correlation, pavement design, index properties
I. INTRODUCTION
w w w . a j e r . o r g Page 345 cross verify the CBR value obtained from the laboratory testing. Along with the soil test data, some of the existing correlations are made use for further improvement of the correlations. Existing correlations for CBR are made use to validate the laboratory CBR values. The existing correlations for CBR were developed based on the soil parameters such as liquid limit, plasticity index and OMC by Venkatraman et al. [4], Karunaprema and Edirisinghe [5].
Agarwal and Ghanekar [1] developed a correlation between CBR values with the basic index properties such as Liquid Limit (LL) and Plasticity Index (PI). However, it is felt that exact information about soil LL and PI are essential to make use of the correlations for prediction of CBR. Further for prediction of CBR of a soil, they made a correlation between CBR, OMC and LL also was proposed. Instead, finally they found an improved correlation when they included the optimum moisture content and liquid limit. The correlation is defined as below.
……… (1) Where OMC = Optimum Moisture Content and LL = Liquid Limit.
Vinod and Cletus [2] had proposed a correlation based on liquid limit and gradation characteristics of soils. Based on the result obtained from experimental study on lateritic soils, they suggested a correlation as defined below.
……… (2)
Where WLM is modified Liquid Limit and is given by
……… (3)
Where LL is liquid limit on soil passing through 425 μm sieve (in percentage) and C is the fraction of soil coarser than 425 μm (percent).
Patel and Desai [6] had proposed a correlation between plasticity index, maximum dry density and optimum moisture content.
……… (4)
Where, MDD is Maximum Dry Density in gm/cc, PI is Plasticity Index in percentage and OMC is Optimum Moisture Content in percentage.
Roy et al [7] proposed a method for predicting the value of CBR in terms of the optimum moisture content and maximum dry density of a soil. The following relationship as mentioned below
w w w . a j e r . o r g Page 346 Where, γdmax or MDD = Maximum Dry Density and γw is unit weight of water. Both are in same units (i.e.,
gm/cc).
Patel and Desai [6] had proposed few correlations for alluvial soils to obtain the CBR value from liquid and plastic limit. The equation for CBR as a function of different soil properties by method of regression analysis has been established. The correlations are experienced using basic soil properties for no if samples at 100 m interval and it was checked by few test results obtained CBR values. The correlations are defined below.
……… (6)
……… (7)
Where, CBR is California bearing ratio, LL is liquid limit and PL is plastic limit.
The National Co-operative Highway Research Program (NCHRP) [3] of United States of America (USA) through the “Guide for Mechanical - Empirical Design of New and Rehabilitated Pavement Structures” had been developed some correlations that clearly describes the relationship between soil index properties and CBR values. An equation was established for soils which contain 12% fines and exhibit some plasticity. For plastic, fine-grained soils, the soil index properties chosen to correlate CBR are the percentage passing No. 200 US standard sieve or 0.075mm size sieve and plasticity index. The suggested equation by NCHRP is shown below.
……… (8) Where w is percentage passing No. 200 US sieve (in decimal) and PI is Plasticity Index.
II. EXPERIMENTAL PROGRAM
The soil samples were collected from 17 different points at each interval of 5m over a longitudinal stretch of 100m of existing sub grade soils between Modzo to Hawassa road, in Ethiopia. These samples were collected and preserved in air tight containers in the laboratory. The selected soil samples were tested for CBR value, optimum moisture content, maximum dry density, particle size distribution (or) grain size distribution, liquid limit, plastic limit, plasticity index and shrinkage limit. These tests were performed according to American Association of State Highway and Transportation Officials (AASHTO) soil code specifications. Almost all the soils are light brown to brown sandy clayey with little gravel. The index properties of soil samples are tabulated in Table 1. The comparison of CBR values predicted from different investigators with experimental values has done.
Table 1.Laboratory index properties of materials
S.No LL PL PI OMC
(%)
MDD (gm/cc)
CBR (%)
1 55 26 29 20.0 1.633 2
2 44 25 19 15.0 1.764 5
3 29 20 9 10.0 1.958 21
4 45 29 16 21.0 1.556 4
w w w . a j e r . o r g Page 347
6 41 24 17 19.0 1.690 4
7 26 18 8 14.0 1.779 10
8 25 22 3 17.5 1.595 18
9 35 27 8 17.0 1.560 9
10 36 30 6 25.0 1.537 8
11 35 32 3 17.0 1.322 18
12 23 21 2 12.0 1.847 7
13 38 30 8 17.0 1.389 4
14 40 30 10 19.0 1.674 9
15 38 35 3 10.0 1.650 18
16 56 43 13 19.5 1.066 17
17 31 25 6 15.0 1.635 8
III. RESULTS AND DISCUSSIONS
Various investigators have been made to develop suitable correlation between CBR values of compacted soils at optimum moisture content and results of some simple field tests. The CBR values are then evaluated from available correlations given by Agarwal and Ghanekar [1] (Eqn. 1), Vinod and Cletus [2] (Eqn. 2), Patel and Desai [6] (Eqn. 4), Roy et al [7] (Eqn. 5), Patel and Desai [6] (Eqn. 6 and 7) and NCHRP [3] (Eqn. 8). From different investigators, the predicted CBR values were then compared with experimental values reported in Table 1. The predicted values of various equations with experimental values are tabulated in Table 2. The values are further plotted in Fig. 1.
Table 2.Experimental and Predicted Values of CBR
S.No Predicted CBR values (Vinod and Cletus) Predicted CBR values (Patel and Desai) -1 Predicted CBR values (Roy et al) Predicted CBR values (Patel and
Desai) - 2
Predicted CBR values
(Patel and Desai) - 3
Predicted CBR values (NCHRP)
Experimen tal Values of CBR
1 7.477 4.380 3.329 6.245 2.414 5.244 2
2 10.411 4.390 2.697 6.579 2.769 8.441 5
3 39.170 3.217 1.995 6.485 3.424 39.117 21
4 14.812 6.727 3.3308 7.138 2.553 9.122 4
5 9.629 7.184 3.467 7.395 2.431 7.790 3
6 13.540 4.732 3.273 6.560 2.900 7.474 4
7 28.742 5.439 2.538 6.315 3.602 20.713 10
8 27.836 8.282 2.845 6.962 3.442 44.146 18
9 23.213 8.628 2.703 7.276 2.927 18.352 9
10 16.812 6.781 3.916 7.685 2.758 18.286 8
11 33.792 13.563 2.290 8.030 2.692 48.512 18
12 36.005 5.337 2.259 6.899 3.545 53.835 7
13 22.306 11.839 2.407 7.597 2.702 19.461 4
14 15.034 5.685 3.242 7.509 2.646 14.564 9
15 35.143 9.56 1.681 8.351 2.467 54.693 18
16 28.191 16.670 2.118 8.765 1.587 21.095 17
w w w . a j e r . o r g Page 348 From the previous investigators, it has been concluded that few relationships made by basic index properties of soil samples are matching with the laboratory test values. But the reliability of the predicted CBR values basically depends on the input parameters which we used in substituting already developed correlations by different investigators. The parameters such as Liquid Limit, Plasticity Index, Optimum Moisture Content, Maximum Dry Density and particle size or grain size values are playing vital role in predicted CBR value proposed by different investigators.
Fig. 1. Comparison of Experimental and Predicted CBR values by different investigators
w w w . a j e r . o r g Page 349
Fig. 2. Comparison of Experimental and Predicted values of CBR from Vinod and Cletus.
Fig. 2 shows the validation of CBR values between experimental and predicted from Vinod and Cletus. The values are not at all showing the similarity between experimental and predicted CBR. This may be due the variation of basic index properties for different soils such as liquid limit and percentage fractions coarser than
425 μm. The values compared to the experimental CBR and predicted CBR values from Vinod and Cletus [2]
are very higher.
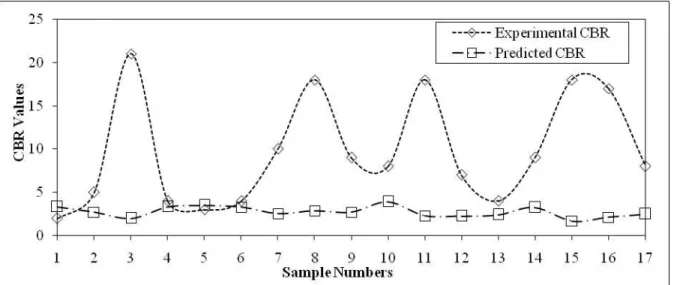
Fig. 3. Comparison of Experimental and Predicted values of CBR from Patel and Desai -1.
Fig. 3 shows the validation of experimental and predicted values of CBR from Patel and Desai [6] - 1. From the figure it is observed that the predicted CBR values are initially stated high and finally it is almost matching and moving together. The ranges of index properties such as plasticity index, optimum moisture content and maximum dry densities for the soils which we considered for laboratory testing is almost similar with investigated correlation ranges.
Fig. 4. Comparison of Experimental and Predicted values of CBR from Roy et al.
w w w . a j e r . o r g Page 350
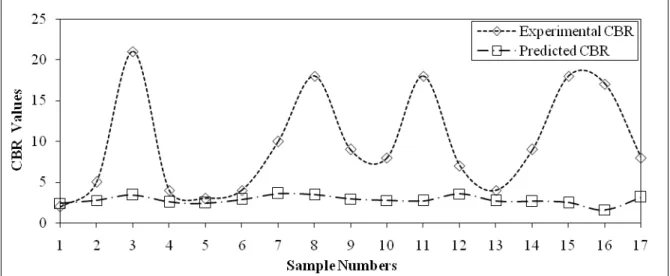
Fig. 5. Comparison of Experimental and Predicted values of CBR from Patel and Desai -2.
Fig. 5 shows the validation of experimental and predicted values of CBR from Patel and Desai [6] - 2. From the figure the values of predicted CBR is initially more than experimental CBR value. The values are matching with at sample number 10, 12 and 17. But it is not at all showing the similarity or proper trend along with the experimental data. This may be due to the variation of properties such as liquid and plastic limits of various soil samples.
Fig. 6. Comparison of Experimental and Predicted values of CBR from Patel and Desai -3.
w w w . a j e r . o r g Page 351
Fig. 7. Comparison of Experimental and Predicted values of CBR from NCHRP.
Fig. 7 shows the variation of experimental and predicted values of CBR from NCHRP [3] . From the figure it is clearly observed that almost both the values are following the trend but those values are not exactly matching together. The predicted values are little higher than the experimental values. Finally proper trend of the curve is following with slight deviation in predicted values.
IV. CONCLUSION
Experimental values of 17 samples of various index properties are given as input to validate the equations with predicted CBR values. Several tests have been conducted to measure the CBR and index properties of soils were performed. Finally few conclusions were brought out.
1) The results obtained from Agarwal and Ghanekar [1] has no way matching with the experimental as well predicted CBR values.
2) All most all the equations are moderately validating with different samples with the experimental values with predicted values of CBR except Vinod and Cletus [2].
3) From NCHRP [3] , the experimental and predicted values are following the trend but the values are not matching exactly.
V. Acknowledgements
First of all, I would also thank to my colleagues Mr. Shumi and Mr. Esaias from Adama Science and Technology University (ASTU), Adama, Ethiopia, for their assistance in the laboratory.
REFERENCES
[1] Agarwal, K.B.; and Ghanekar, K.D. (1970). Prediction of CBR from Plasticity Characteristics of Soil. Proceeding of 2nd
South-east Asian Conference on Soil Engineering, Singapore. June 11-15, Bangkok: Asian Institute of Technology, 571-576.
[2] Vinod, P.; and Cletus Reena. (2008). Prediction of CBR value of Lateritic Soils using Liquid Limit and Gradation Characteristics
Data, Highway Research Journal, Vol. I, No. 1, 89-98.
[3] NCHRP. (2003). Guide for mechanistic-empirical design of new and rehabilitated pavement structures. National Co-operative
Highway Research Program Transportation Research Board National Research Council, Illinois 61820.
[4] Venkataraman, T.S.; Samson, M.; and Ambili, T.S. (1995). Correlation between CBR and Clegg Impact Value, Proc. Nat. Sem.
On emerging trends in Highway Engineering, Centre for Transportation Engineering, Bangalore, Vol. I, 25.1-25.5.
[5] Karunaprema, K.A.K. and Edirisinghe, A.G.H.J. (2002), A Laboratory study to establish some useful relationship for the case o f
Dynamic Cone Penetration, Electronic journal of Geotechnical Engineering. Vol.7.
[6] Patel, R. S.; and Desai, M.D. (2010). CBR Predicted by Index Properties of Soil for Alluvial Soils of South Gujarat, Indian
Geotechnical Conference, Proc. IGC, Vol. I, 79-82.
w w w . a j e r . o r g Page 352
Highway Research Journal, July-Dec., 77-88.
[8] Chandrasekhar, B.P.; Vinayak Rao, V.R.; and Prasada Raju, G.V.R. (2003). A comprehensive study of soil CBR assessment
through Clegg’s Impact test, Field and Laboratory CBR test, Indian Highways, Vol.31, No 7, 39-45.
[9] Venkatasubramanian, C.; and Dhinakaran, G. (2011). ANN model for predicting CBR from index properties of soils,
International Journal of Civil and Structural Engineering, Volume 2, No.2.
[10] American Standard Test Method. (1992). Standard Test Method for CBR (California Bearing Ratio) of Laboratory- Compacted
Soils. United States of America, ASTM Designation D1883-92.
[11] Sister, N.W.; and Powell, W.D. (1976). Design Practice for Bitumen Pavements in the United Ki ngdom, Proceedings of 6th


![Fig. 7 shows the variation of experimental and predicted values of CBR from NCHRP [3]](https://thumb-eu.123doks.com/thumbv2/123dok_br/18249106.342081/8.893.115.784.95.410/fig-shows-variation-experimental-predicted-values-cbr-nchrp.webp)
