1 Recebido para publicação em 8.5.2001. Aceito para publicação em 9.9.2003.
2 Departamento de Biologia da Universidade Federal de Lavras – UFLA, Caixa Postal 37, 37200-000 Lavras-MG, Brazil, <[email protected]>. 3 Escola Superior de Agricultura ”Luiz de Queiroz”/USP, Caixa Postal 9, 13418-900 Piracicaba-SP, Brazil. 4 Aracruz Celulose S.A., Brazil.
EXPERIMENTAL ALTERNATIVES FOR EVALUATION OF PROGENIES AND
CLONES IN EUCALYPTUS BREEDING PROGRAMS
1Elaine Aparecida de Souza2, Isaias Olívio Geraldi3, Magno Antonio Patto Ramalho2 e Fernando de Lelis Garcia Bertolucci4
ABSTRACT - The feasibility of using augmented block designs and spatial analysis methods for early stage selection in eucalyptus breeding programs was tested. A total of 113 half-sib progenies of Eucalyptus urophylla and eight clones were evaluated in an 11 x 11 triple lattice experiment at two locations: Posto da Mata (Bahia,
Brazil) and São Mateus (Minas Gerais, Brazil). Four checks were randomly allocated within each block. Plots consisted of 15 m long rows containing 6 plants spaced 3 m apart. The girth at breast height (cm/plant) was evaluated at 19 and 26 months of age. Variance analyses were performed according to the following methods: lattice design, randomized complete block design, augmented block design, Papadakis method, moving means method, and check plots. Comparisons among different methods were based on the magnitude of experimental errors and precision of the estimates of genetic and phenotypic parameters. General results indicated that augmented block design is useful to evaluate progenies and clones in early selection in eucalyptus breeding programs using moderate and low selection intensities. However, this design is not suitable for estimating genetic and phenotypic parameters due to its low precision. Check plots, nearest neighbour, Papadakis (1937), and moving means methods were efficient in removing the heterogeneity within blocks. These efficiencies were compared to that in lattice analysis for estimation of genetic and phenotypic parameters.
Key words: Eucalyptus urophylla, augmented block, lattice, randomized complete block, nearest neighbour, Papadakis, moving means, check plots, genetic and phenotypic parameters.
ALTERNATIVAS EXPERIMENTAIS NA AVALIAÇÃO DE PROGÊNIES E CLONES EM
PROGRAMAS DE MELHORAMENTO DE EUCALIPTO
RESUMO - Visando estudar a viabilidade do emprego do delineamento em blocos aumentados e de métodos de análise espacial nas etapas iniciais dos programas de melhoramento de eucalipto, foram avaliados 121 tratamentos, sendo 113 progênies de meios-irmãos de Eucalyptus urophylla e oito clones, em dois locais: São Mateus, Estado do Espírito Santo, Brasil, e Posto da Mata, Estado da Bahia, Brasil. O delineamento utilizado foi um látice 11 x 11,
com três repetições por local. Em cada bloco foram colocadas, aleatoriamente, quatro testemunhas. Cada parcela foi constituída por uma linha de seis plantas, no espaçamento 3 x 3 m. Os dados da circunferência à altura do peito
dos programas de melhoramento genético de eucalipto, principalmente se for aplicada uma intensidade de seleção moderada; porém esse delineamento não se mostrou apropriado para a estimação de parâmetros genéticos e fenotípicos, devido à baixa precisão das estimativas. Os métodos de testemunha intercalar e análise de vizinhança, o Papadakis (1937) e o método das médias móveis foram eficientes no controle da heterogeneidade dos blocos, sendo esta eficiência similar àquela proporcionada pela análise em látice.
Palavras-chave: Eucalyptus urophylla, blocos aumentados, blocos ao acaso, látice, análise de vizinhança, método de Papadakis, médias móveis, testemunha intercalar e parâmetros genéticos e fenotípicos.
2. MATERIAL AND METHODS
The material used in this study consisted of 113 half-sib progenies of Eucalyptus urophylla and eight clones, evaluated in an 11 x11 triple lattice design at two locations: Posto da Mata (17º 51’48.65” S of latitude and 39º46’25.76” W of longitude in Bahia, Brazil) and São Mateus (18º 31’05.58” S of latitude and 39º47’36.33” W of longitude in Espírito Santo, Brazil). A clone of Eucalyptus grandis one of E. urophylla as well as a seedlot of E. grandis and another of E. alba, were randomly allocated within each block as controls. Using these four checks as common treatment allowed to simulate a distinct experiment in augmented block design within each lattice replication. Plots consisted of 15 m rows, each one containing 6 plants planted 3 m apart. The girth at breast height was recorded in centimeters at ages 19 and 26 months. These data were processed through several methods of variance analysis to evaluate the efficiency of each process. Initially, the analyses were conducted with lattice and randomized complete block designs. Later, using information from each replication, three variance analyses were performed, by location, in the augmented block design. To compare regular treatments (progenies) of different blocks, an effective error was estimated by using the expression developed by Ferreira (cited by Barbosa, 1996):
MSEe= 1 1
r t 1
r
t(r t 1)
r n
tn (r t 1)
k 2
k 1 b
2
+ + − + + − + + −=
∑
2 n
tn(r t 1)
b n
n (n t 1)
k 2
k 1 b
k 2
k 1 b
2
−
∑
+ −= +∑
+ −=
MSE1. INTRODUCTION
Time is a limiting factor in eucalyptus breeding programs. However, a large number of progenies must, be evaluated in the selection process. In this case, the most important restriction is the dimension of the experimental area. Because of the physical space occupied by an individual, there is restriction in the number of progenies and/or clones which can be evaluated in experiments with adequate replications.
Plant breeders have sought alternatives to solve these problems, such as using augmented block design (Federer,1956, 1961a and 1961b), which allows to evaluate a large number of material with a manageable amount of work and experimental area. However, only a few published studies are available on the comparative evaluation of this design. Studies have been conducted with potato and common bean (Bearzoti, 1994; Souza,1997). In the specific case of eucalyptus, information concerning this is scarce. Several methods of spatial analysis of experiments have been proposed. These have become available to plant breeders through the latest computering facilities. Among these are the Papadakis’ (1937) and the moving means (Townley-Smith & Hurd, 1973) methods. Interest in this type of analyses has increased and new methods have been proposed (Bartlet, 1978; Wilkinson et al., 1983; Besag & Kempton, 1986; Magnussen,1990; Samra et al., 1990; Vivaldi, 1990; Zimmerman & Harville, 1991; Loo-Dinkins, 1992, Ball et al., 1993; Brownie et al., 1993; Stroup et al., 1994; Helms et al., 1995; Anoshenko, 1994; Clarke & Baker et al., 1996). Nevertheless, information remains scarce on the relative efficiencies of these methods applied in breeding programs in Brazil.
where
MSEe = mean square of the effective error; r = number of regular treatments (progenies); t = number of common treatments (checks); b = number of blocks;
nk = number of treatments (regular + common) in the k block;
n = total number of plots, n=
n
k k=1b
∑
MSE = mean square of the in block analysis’ error. Correction was also evaluated by means of the check plots method. Thus, an environmental index was obtained from the average performance of the four checks within each block. A covariance analysis was performed in randomized complete blocks using the environmental index as covariable.
Additionally, the data were analysed by the Papadakis’ (1937) and moving average (Townley-Smith and Hurd, 1973) methods, using as adjustment the average performance of six neighbouring plots, three to the right and three to the left of the reference plot. For plots of boundary, the average of plots in front and behind of them was used.
Joint variance was carried out considering all the methods evaluated.
Comparison of these methods was made considering estimates of genetic and phenotypic parameters, such as coefficient of variation. The coefficient of variation (CV)
was estimated for expression: CV(%)= 100 x
MSError
,
where MSError is error mean square obtained in analysis of variance in each method and
x
is grand mean of experiment. Broad sense heritability on a progeny meanbasis was obtained for 100
MSP MSError MSP
(%)
h2 = − , where MSP is progeny mean square estimated in analysis of variance in each method using only the 113 half sibs progenies. Confidence intervals of heritability were estimated by the expression presented by Knapp et al. (1985).
Additionally, Spearman’s ranking correlation and Fasoulas’ (1983) differentiation index (D) were estimated.
Fasoulas’ (1983) differentiation index was obtained for expression D=200
Σ
f/[n(n-1)], where f is the number of means that a given progeny exceeds significantly, after application of means test and n is the number of progenies. Also, coincidence index in the progenies that would be selected using the different methods was used by Hamblin & Zimmerman’s (1986) expressionES (%) = AB--CC . 100
where:
A = number of selected progenies with method considered as standard method;
B = number of selected progenies;
C = number of expected progenies by random coincidence; C = b . B, where b is the intensity of selection used, and in this case b = 0.10.
3. RESULTS AND DISCUSSIONS
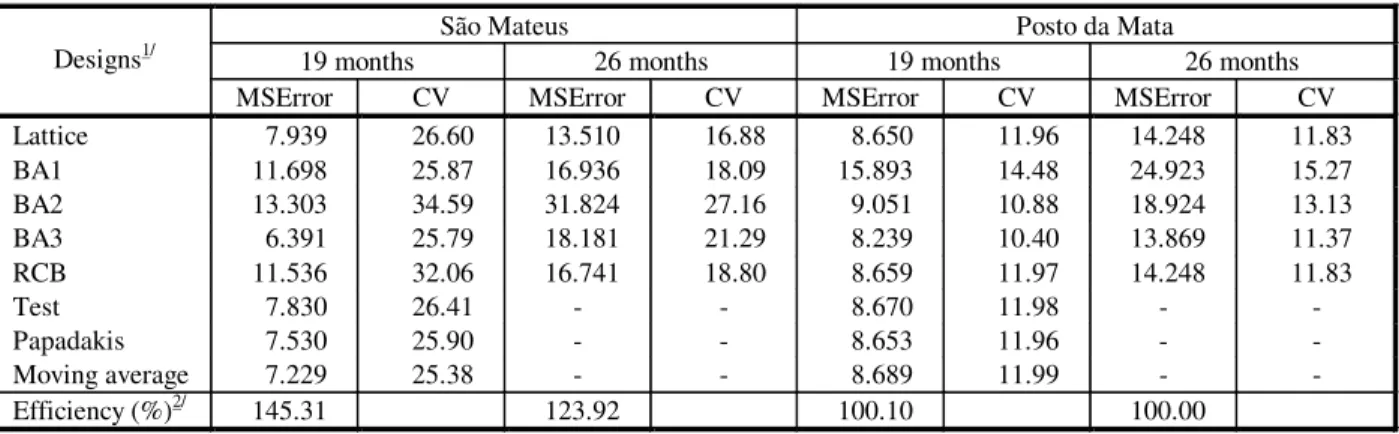
Error mean square and coefficients of variation (CV) estimates obtained at two locations and in the joint analysis of both ages are presented in Tables 1 and 3. Error mean square estimates were equivalent in both locations. The CV estimates varied from 10.40% in the augmented block design (BA3) in Posto da Mata to 34.59% in São Mateus. CV estimates obtained in São Mateus were higher than those in Posto da Mata and greater than those observed in eucalyptus experiments (Castro, 1992). This occurred because CV estimate is influenced by the average values (Pimentel Gomes, 1990). As mean squares of error were homogeneous between the two locations, the lower CV estimates obtained in Posto da Mata can be attributed to higher average at girth breast height in this location.
21%, compared to the randomized complete block design, due to the heterogeneity within the blocks in São Mateus. The augmented block design produced a CV lower than that in the randomized complete block design and higher than that in the lattice design.
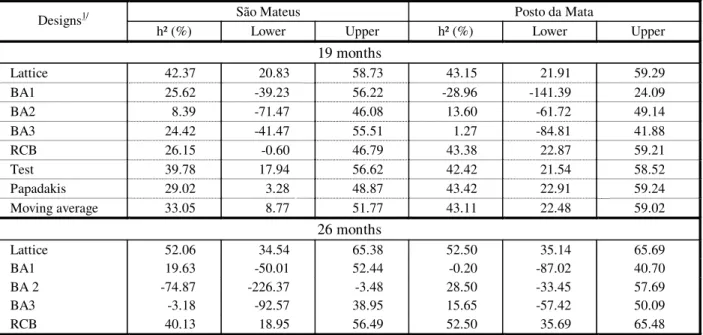
Heritability estimates were similar among the statistical methods in which replications were used because in these cases the values of the confidence interval limits were very close (Table 3). These heritability estimates do not agree with those obtained from the individual site variance analysis (Table 2) and confirm the observations made by Rosiele (1980) and Helms et al. (1995), which found that the difference between methods is evident in an isolated location, but it is not found in the joint variance analysis, due to genotypes x environments interaction. However, the results obtained in this study were similar to those reported by Pinto Júnior (1984) and Castro (1992). For the augmented block design there is a large discrepancy between the value of the h2 estimate and the others, and no agreement was observed between the values of heritability estimates and their respective confidence intervals, compared to the estimates obtained by other methods.
Spearman’s ranking correlation coefficients between family means were high, showing that there is not a great difference between the lattice design and other methods,
except for the augmented block design which was, in this case, 63% in São Mateus and 70% in Posto da Mata (Table 4 and 5).
Selection efficiency evaluated by the Hamblin & Zimmermann’s expression (1986) was estimated considering different intensities of selection, 16% (selection of the 20 best progenies and 20 worst progenies), 33% (selection of the 40 best progenies) and 50% (selection of the 60 best progenies), respectively, based on the lattice analysis. There was a good agreement among the methods of variance analysis based on replication in both locations. However, for the augmented block design, the selection efficiency was lower, although it increased when the intensities of selection were moderate with i=33% and i=50% (Table 4 and 5). These results are in agreement with those obtained by Spearman’s correlation, probably due to the fact that the averages in the augmented block design are estimated from only one replication, which affects the standard error of the progenies’ means and, consequently, their classification. Therefore, the use of experiments with replications is necessary because the selection of the best progenies should be more stricty.
The differentiation index of the augmented block design was lower than those obtained by other methods (Table 4 and 5). From the 7260 pairs of possible contrasts
Table 1 – Error mean square (MSError) and coefficient of variation (CV%) estimates for all the statistical methods of girth at breast height (cm/plant) at ages 19 and 26 months in São Mateus and Posto da Mata
Quadro 1 – Estimativas do quadrado médio do erro (MSError) e coeficientes de variação (CV%) em todos os métodos estatísticos avaliados da circunferência à altura do peito (cm/planta) do eucalipto aos 19 e 26 meses em São Mateus e Posto da Mata
São Mateus Posto da Mata
19 months 26 months 19 months 26 months
Designs1/
MSError CV MSError CV MSError CV MSError CV Lattice 7.939 26.60 13.510 16.88 8.650 11.96 14.248 11.83
BA1 11.698 25.87 16.936 18.09 15.893 14.48 24.923 15.27
BA2 13.303 34.59 31.824 27.16 9.051 10.88 18.924 13.13
BA3 6.391 25.79 18.181 21.29 8.239 10.40 13.869 11.37
RCB 11.536 32.06 16.741 18.80 8.659 11.97 14.248 11.83
Test 7.830 26.41 - - 8.670 11.98 - -
Papadakis 7.530 25.90 - - 8.653 11.96 - -
Moving average 7.229 25.38 - - 8.689 11.99 - -
Efficiency (%)2/ 145.31 123.92 100.10 100.00
1 / - Variance analysis: Lattice- in lattice design; BA1, BA2 e BA3- in augmented block design using data from replications 1, 2 and 3, respectively; RCB- in randomized complete block design.
- Covariance analysis in randomized complete block design: Test- employing the check plot as covariable; Papadakis- employing the Papadakis’ (1937) method; Moving means- employing the moving mean as covariable.
among the 121 means, only 1.4% was significant in São Mateus, i.e., 104 contrasts, while the lattice design detected significant differences among 363 comparison pairs (D=5.28%).
The general results obtained indicate that the augmented block design is a viable alternative to evaluate a greater number of genotypes in earlier stages of selection when the intensities of selection are moderate to low. For improving efficiency in this design, some other aspects should be considered such as the use of appropriate checks that represent the environmental variation of the segregating population in the study with, for example, the use of some of the genotypes being evaluated, as observed by Bearzoti (1994). On the other hand, the lower precision of the estimates of the genetic parameters obtained in this design do not rule out its usefulness in the stages for which it is recommended.
In the specific case of eucalyptus, this method can be very useful in clonal selection. Companies usually have a large number of clones to be evaluated, and obtaining
seedlings of all clones for evaluation in experiments with replications is very difficult. The augmented block design could be used and this would need less seedlings per clone because it does not require replication. Furthermore, the experimental area would be decreased allowing evaluation of a greater number of clones. At this stage early selection could be used contributing to a reduction in the selective cycle, already shown to be efficient in Brazil (Rezende et al., 1995; Marques Júnior et al., 1996). In this case, the selected clones would be evaluated precociously in experiments with replications for identification of the best ones and later introduced in the productive system.
The nearest neighbour methods (Papadakis and moving average) were shown to be efficient in removing environmental effects when heterogeneity within blocks was detected. In these cases, improvement in the experimental precision was almost always similar to the lattice design, based on genetic and phenotypic parameters estimates showing that the local control in rows and/or columns was as effective as the methods based on spatial analysis.
Table 2 – Heritability estimates and their respective confidence intervals for all the statistical methods of girth at breast height (cm/plant) at ages 19 and 26 months in São mateus and Posto da Mata
Quadro 2 – Estimativas das herdabilidades e de seus respectivos intervalos de confiança em todos os métodos estatísticos avaliados da circunferência à altura do peito (cm/planta) do eucalipto aos 19 e 26 meses em São Mateus e Posto da Mata
São Mateus Posto da Mata
Designs1/
h² (%) Lower Upper h² (%) Lower Upper
19 months
Lattice 42.37 20.83 58.73 43.15 21.91 59.29
BA1 25.62 -39.23 56.22 -28.96 -141.39 24.09
BA2 8.39 -71.47 46.08 13.60 -61.72 49.14
BA3 24.42 -41.47 55.51 1.27 -84.81 41.88
RCB 26.15 -0.60 46.79 43.38 22.87 59.21
Test 39.78 17.94 56.62 42.42 21.54 58.52
Papadakis 29.02 3.28 48.87 43.42 22.91 59.24
Moving average 33.05 8.77 51.77 43.11 22.48 59.02
26 months
Lattice 52.06 34.54 65.38 52.50 35.14 65.69
BA1 19.63 -50.01 52.44 -0.20 -87.02 40.70
BA 2 -74.87 -226.37 -3.48 28.50 -33.45 57.69
BA3 -3.18 -92.57 38.95 15.65 -57.42 50.09
RCB 40.13 18.95 56.49 52.50 35.69 65.48
1 / - Variance analysis: Lattice- in lattice design; BA1, BA2 e BA3- in augmented block design using data from replications 1, 2 and 3, respectively; RCB- in randomized complete block design.
Table 3 – Summary of the joint variance analysis, heritability estimates and their respective confidence intervals for all the statistical methods of girth at breast height (cm/plant) at ages 19 and 26 months
Quadro 3 – Resumo das análises de variância conjuntas, estimativas das herdabilidades e de seus respectivos intervalos de confiança em todos os métodos estatísticos avaliados da circunferência à altura do peito (cm/planta) do eucalipto aos 19 e 26 meses
Designs1/ F (Prog.) F
(P x L) CV (%) Average h
2 (%) Lower Upper
19 months
Lattice 2.02** 1.77** 16.37 17.59 46.73 26.82 61.85
BA 1.27NS 1.02NS 19.26 17.36 21.54 -46.86 53.82
RCB 1.83** 1.55** 18.07 17.59 39.98 18.24 56.76
Test 2.10** 1.62** 16.33 17.59 48.00 29.14 62.54
Papadakis 1.96** 1.54** 16.17 17.59 44.41 24.26 59.96
Moving average 1.97** 1.60** 16.04 17.59 44.68 24.62 60.15
26 months
Lattice 2.39** 2.32** 13.88 26.83 52.63 35.32 65.79
BA 1.06NS 0.83NS 18.71 26.92 2.83 -81.36 42.50
RCB 2.24** 2.02** 14.67 26.83 48.44 30.20 62.53 1 / BA: joint analysis in the augmented block design employing the average progenies of BA2 in São Mateus and BA2 in Posto
da Mata.
** F test significant at the level of 1 probability.
Table 4 – Spearman’s correlation coefficients and coincidence index (%) between the means estimated in lattice design and other methods of variance analysis and Fasoulas’ (1983) differentiation index (D%) of girth at breast height (cm/plant) at ages 19 and 26 months in São Mateus
Quadro 4 – Coeficientes de correlação de Spearman e índice de coincidência (%) entre as médias estimadas no látice e nos demais métodos de análise de variância e índice de diferenciação de Fasoulas’(1983) da circunferência à altura do peito (cm/planta) do eucalipto aos 19 e 26 meses em São Mateus
Spearman’s Selected proportion (%)
Designs1/
correlation 16.52/ 16.53/ 33.0 49.6 D (%)
19 months
Lattice - - - 5.28
BA1 0.6568 31.25 43.75 51.85 53.33 1.06
BA2 0.6476 25.00 37.50 51.85 56.67 0.83
BA3 0.5790 37.50 31.25 29.63 50.00 2.30
RCB 0.8808 75.00 75.00 70.37 73.33 2.80
Test 0.9556 81.25 81.25 77.78 86.67 4.97
Papadakis 0.9281 81.25 75.00 77.78 80.00 3.10
Moving average 0.9168 81.25 68.75 77.78 80.00 3.57
26 months
Lattice - - - 4.21
BA1 0.6674 50.00 50.00 44.44 46.67 2.26
BA2 0.6149 25.00 31.25 44.44 46.67 0.29
BA3 0.6050 50.00 43.75 22.22 40.00 1.09
RCB 0.9354 75.00 68.75 74.07 80.00 3.14
1/ - Variance analysis: Lattice- in lattice design; BA1, BA2 e BA3- in augmented block design using data from replications 1,
2 and 3, respectively; RCB- in randomized complete block design.
- Covariance analysis in randomized complete block design: Test- employing the check plot as covariable; Papadakis- employing the PAPADAKIS’(1937) method; Moving means- employing the moving mean as covariable.
4. CONCLUSIONS
- Augmented block design is suitable in earlier stages of selection when intensities of selection are moderate to low. However, this design is not suitable for estimating genetic and phenotypic parameters due to low precision.
- Nearest neighbour, Papadakis (1937), moving means and check plot methods were efficient in removing heterogeneity within blocks. These efficiencies were compared to that in lattice analysis for estimation of genetic and phenotypic parameters.
5. ACKNOWLEDGEMENT
ARACRUZ CELULOSE S.A. eucalyptus breeding program.
6. BIBLIOGRAFIC REFERENCES
ANOSHENKO, B. Y. Local adjustment method for field experiments. 1. The method and its examination by computer simulation. Euphytica, Wageningen, v. 90, n. 2, p. 137-148, 1994.
BALL, S. T.; MULLA, D. J.; KONZAK, C. F. Spacial heterogeneity affects variety trial interpretation. Crop Science, v. 33,p. 931-935, 1993.
BARBOSA, M. H. P. Capacidade combinatória e comparação entre critérios de seleção de clones de batata (Solanum tuberosum L.). 1996. 141 f. Tese (Doutorado em Genética e Melhoramento de Plantas) – Universidade Federal de Lavras, Lavras, 1996.
BARTLETT, M.S. Nearest neighbour models in the analysis of field experiments with large blocks. Journal of the Royal Statistical Society, v. 40, n. 2, p. 147-174, 1978.
Table 5 – Spearman’s correlation coefficients and coincidence index (%) between the means estimated in the lattice design and other methods of variance analysis and Fasoulas’ (1983) differentiation index (D%) of girth at breast height (cm/plant) at ages 19 and 26 months in Posto da Mata
Quadro 5 – Coeficientes de correlação de Spearman e índice de coincidência (%) entre as médias estimadas no látice e nos demais métodos de análise de variância e índice de diferenciação de Fasoulas’ (1983) da circunferência à altura do peito (cm/planta) do eucalipto aos 19 e 26 meses em Posto da Mata
Spearman’s Selected proportion (%)
Designs1/
correlation 16.52/ 16.53/ 33.0 49.6 D (%)
19 months
Lattice - - - - - 6.23
BA1 0.7512 56.25 37.50 59.26 63.33 1.27
BA2 0.7036 43.75 31.25 62.96 63.33 3.55
BA3 0.6395 50.00 37.50 48.14 46.67 3.11
RCB 0.9994 100.00 93.75 100.00 100.00 6.20
Test 0.9987 93.75 93.75 100.00 100.00 5.92
Papadakis 0.9964 93.75 87.50 100.00 96.67 6.22
Moving average 0.9988 93.75 87.50 100.00 100.00 6.18
26 months
Lattice - - - - - 9.48
BA1 0.7719 62.50 18.75 37.04 46.67 1.82
BA2 0.7457 56.25 50.00 62.96 63.33 3.94
BA3 0.6344 50.00 25.00 59.26 46.67 4.27
RCB 0.9999 100.00 100.00 77.78 80.00 9.42
1 / - Variance analysis: Lattice- in lattice design; BA1, BA2 e BA3- in augmented block design using data from replications 1, 2 and 3, respectively; RCB- in randomized complete block design.
- Covariance analysis in randomized complete block design: Test- employing the check plot as covariable; Papadakis- employing the Papadakis’(1937) method; Moving means- employing the moving mean as covariable.
BEARZOTI, E. Comparação entre métodos estatísticos na avaliação de clones de batata em um programa de melhoramento. 1994. 128 f. Dissertação (Mestrado em Genética e Melhoramento de Plantas) – Escola Superior de Agricultura de Lavras, Lavras, 1994.
BESAG, J.; KEMPTON, R. Statistical analysis of field experiments using neigbouring plots. Biometrics, v. 42, p. 231-251, 1986.
BROWNIE, C.; BOWMAN, D. T.; BURTON, J. W. Estimating spacial variation in analysis of data from yield trials: a comparison of methods. Agronomy Journal, v. 85, p. 1244-1253, 1993.
CASTRO, N. H. C. Número de repetições e eficiência da seleção em progênies de meios irmãos de Eucalyptus camaldulensis. 1992. 121 f. Dissertação (Mestrado em Genética e Melhoramento de Plantas) – Escola Superior de Agricultura de Lavras, Lavras, 1992.
CLARKE, F. R.; BAKER, R. J. Spatial analysis improves precision of seed lot comparisons. Crop Science, v. 36, p. 1180-1184, 1996.
FASOULAS, A. C. Rating cultivars and trials in applied plant breeding. Euphytica, v. 32, n. 3, p. 939-943, 1983. FEDERER, W. T. Augmented (hoonuiaku) designs. Hawaiian Planters’ Record, v. 55, p. 191-208, 1956. FEDERER, W. T. Augmented designs with one-way elimination of heterogeneity. Biometrics, v. 17, n. 3, p. 447-73, 1961a.
FEDERER, W. T. Augmented designs with two-, three- and higher-way elimination of heterogeneity (abstract).
Biometrics, v. 17, n. 3, p. 166, 1961b.
HAMBLIN, J.; ZIMMERMAN, M. J. O. Breeding common bean for yield mixtures. Plant Breeding Reviews, v. 4, p. 245-272, 1986.
HELMS, T. C.; ORF, J. H.; SCOTT, R. A. Nearest-neighbor-adjusted means as a selection criterion within two soybean populations. Canadian Journal of Plant Science, v. 75, p. 857-863, 1995.
KNAPP, S. J.; STROUP, W. W.; ROSS, W. M. Exact confidence intervals for heritability on a progeny mean basis. Crop Science, v. 25, p. 192-194, 1985.
LOO-DINKS, J. Field test design. In: FINS, L.;
FRIEDMAN, S. T.; BROSCHOL, J. V. (Eds.). Handbook of quantitative forest genetics. Kluwer Academic Publishers, 1992. p. 96-139.
MAGNUSSEN, S. Application and comparison of spatial models in analysing tree-genetics field trials. Canadian Journal Forest Research, v. 20, p. 536-546, 1990.
MARQUES JÚNIOR, O. G.; ANDRADE, H. B.; RAMALHO, M. A. P. Assessment of the early selection efficiency in Eucalyptus cloeziana F. Muell. In: the northwest of Minas Gerais State (Brazil). Silvae Genetica, v. 45, p. 359-361, 1996.
PAPADAKIS, J. S. Méthode statistique pour des expériences sur champ. 1937. (Bulletin Institute de L’Ameloration des Plantes à Salonique, 23)
PIMENTEL GOMES, F. Curso de estatística experimental. 13. ed. Piracicaba: Nobel. 1990. 468 p.
PINTO JÚNIOR, J. E. Variabilidade genética em progênies de uma população de Eucalyptus urophylla S.T. Blake da Iha Flores - Indonésia. 1984. 164 f. Dissertação (Mestrado em Genética e Melhoramento de Plantas) – Escola Superior de Agricultura “Luiz de Queiroz”/USP, Piracicaba, 1984.
REZENDE, G. D. S. P.; BERTOLUCCI, F. L. G.; RAMALHO, M. A. P. Eficiência da seleção precoce na recomendação de clones de eucalipto avaliados no norte do Espírito Santo e no sul da Bahia. Revista Cerne, v. 1, n. 1, p. 45-50, 1995.
ROSIELLE, A. A. Comparison of lattice designs, check plots, and moving means in wheat breeding trials. Euphytica, v. 29, p. 129-133, 1980.
SAMRA, J. S.; ANLAUF, R.; WEBER, W. E. Spacial dependence of growth attributes and local control in wheat and oat breeding experiments. Crop Science, v. 30, p. 1200-1205, 1990.
SOUZA, E. A. Alternativas experimentais na avaliação de progênies em programas de melhoramento genético vegetal. 1997. 122 f. Tese (Doutorado em Genética e Melhoramento de Plantas) – Escola Superior de Agricultura “Luiz de Queiroz”/USP, Piracicaba, 1997.
STROUP, W. W.; BAENZIGER, P. S.; MULITZE, D. K. Removing spacial variation from wheat yield trials: a comparison of methods. Crop Science, v. 86, p. 62-66, 1994. TOWNLEY-SMITH, T. F.; HURD, W. A. Use of moving means in wheat yield trials. Canadian Journal of Plant Science, v. 53, p. 447-450, 1973.
VIVALDI, L. J. Comparação entre métodos de análise espacial de experimentos de campo. Pesquisa Agropecuária Brasileira, v. 25, n. 1, p. 77-84, 1990.
WILKINSON, G. N. et al. Nearest neighbour(NN) analysis of field experiments. Journal of the Royal Statistical Society, v. 40, p. 151-211, 1983.