Introduction
Reticulocytes are precursory to the erythrocyte cells in the blood. They are anucleated cells, more rounded in shape and 20% greater, in volume, than the erythrocytes. However, when stained with panoptic dyes (Romanowski) they produce polychromatic slides, due to the presence of mature red blood cells with hemoglobin, synthesized during maturation, and reticulocytes with ribonucleic acid residues. These residues are stained with new methylene blue or brilliant cresyl blue dyes which confer the characteristic aspect of reticulum, when observed in optic microscopy. Such staining is not
Analysis of manual reticulocyte counts in the clinical laboratories of
Ponta-Grossa and Campos Gerais, Brazil
Contagem manual de reticulócitos em laboratórios de análises clínicas de Ponta Grossa e
Campos Gerais, PR, Brasil
Mackelly Simionatto1
Josiane P. Paula1
Aguinaldo J. Nascimento2
Maria Suely S. Leonart3
Domenic Cicchetti4
Reticulocyte counts are widely used in laboratories to evaluate bone marrow erythropoietic activity and have great diagnostic and prognostic importance in the treatment of anemias. Reticulocytes are supravitally stained with new methylene blue or brilliant cresyl blue, which highlight the characteristic aspect of the reticulum visible by light microscopy. Known criteria were observed for good manual reticulocyte counting with special attention being paid to the preparation of reticulocyte slides, to counting fields without overlapping cells, and to the number of evaluated cells. The aim of this study was to evaluate the inter-observer variation and also to analyze the statistical error of manual reticulocyte counting. The Intraclass correlation coefficient (ICC) according to Bartko was used to evaluate the level of agreement among 12 laboratory technicians who evaluated the same 25 blood smears. The results of statistical analyses showed that the amount of random error, defined as (1-r2), varied from 4% to 60% among the technicians. Although imprecision occurred, the overall profiles were quite similar, and intraclass correlation coefficients indicated that the results obtained have clinical significance. Rev. Bras. Hematol. Hemoter.
Key words: Haematology; statistical methods; manual reticulocytes count.
1Farmacêutico-Bioquímico.
2Professor sênior da Universidade Federal do Paraná – Curitiba-PR. 3Professora titular da Universidade Federal do Paraná – Curitiba-PR.
4Senior Professor, Department of Biometry, Yale University School of Medicine, New Haven - USA.
Programa de Pós-Graduação em Ciências Farmacêuticas, Universidade Federal do Paraná – Curitiba-PR.
Correspondence:Aguinaldo José do Nascimento Universidade Federal do Paraná
Av. Lothário Meissmer, 632 – Jardim Botânico 802210-170 – Curitiba-PR – Brasil
E-mail: [email protected] Doi:
permanent.1 The reticulocytes can be classified as mature or immature depending on the amount of granules or reticula they contain.2
reticulocyte slides; restricting the counting to fields that do not contain overlapping cells; and also taking into account the number of evaluated cells.5
Automated reticulocyte counting is based on the rapidly expanding technology of flow cytometry that makes the determination fast, accurate, and efficient by counting a great number of blood cells; and the methodology also provides information regarding the reticulocytes. Parameters such as amount of hemoglobin and degree of reticulocyte maturity allow more trustworthy diagnostic and therapeutic monitoring, mainly for patients with lower reticulocyte counts.6 However, this methodology is still expensive, and this limits its routine use in small and medium size laboratories. Considering the relevance of the quality control of reticulocyte countings for the detection of hematologic illnesses, the aim of this study was to evaluate interobserver variations; to determine the amount of statistical error in manual reticulocyte counting, using known criteria for its determination; and also to demonstrate the limitations of this method.
Material and method
Manual reticulocyte counting
Manual reticulocyte counting was carried out in accordance with Lewis et al.7 A new methylene blue or brilliant cresyl blue solution (100µl) was added to 200 - 250µl of blood, and incubated at 37ºC for 20-25 min. The blood volume to be added to the dye depends on the volume of packed red blood cells volume (PCV), 200µl for PCV equal or superior to 30% and 250µl for less than 30% PVC. After the incubation with the dye, blood smears on glass slides were prepared for reticulocyte counting, for up to 72 hours.
Criteria for adequate blood smear counts
Blood smear was observed under optic microscope objective immersion (100x). Both mature erythrocytes and well defined reticulocytes could then be observed. The mature reticulocyte possesses few RNA filaments or granules, while
to obtain an acceptable error. When the reticulocyte number exceeds 10%, the examination of a small number of cells will be enough to get a standard error of less than 10%. It is consensual that there must be about 200 erythrocytes in each field so that 20-50 fields are counted with less than 1% reticulocytes.
Blood smear screening
A total of 25 blood smears was screened by professional biochemists in 10 laboratories of Clinical Analyses in Ponta-Grossa and Campos Gerais, PR, Brazil. The technologists were blinded and identified only as A to J. In a first approach, the samples were carefully examined by technologists K and L. Each laboratory received the slides numbered from 1 to 25 and they were asked to screen from 2 to 3 times a week, during a 5 week period, between June 25th and July 30th 2008, and within 48 hours after receiving the slides.
Statistical analyses
The Intraclass correlation coefficient (ICC), due to Bartko8,9 was used to evaluate the level of agreement or concordance among technologists for parametric measurements, for more than 2 raters.10 Analyses were performed with the use of the on-line statistical package of Hong Kong University11 at the following website: http:// d e p a r t m e n t . o b g . c u h k . e d u . h k / r e s e a r c h s u p p o r t / IntraClass_correlation.asp
The data were also analyzed by Pearson correlation, one way ANOVA and with the Levey-Jennings quality control chart.12 The criterion for statistical significance was set at the nominal probability (p) level of p ≤ 0.05.
Results and discussions
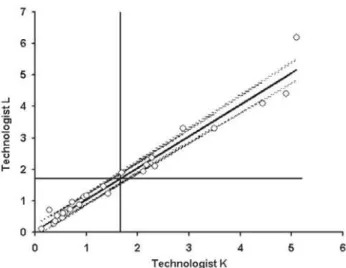
values. The random error, reflected by the variability of counts around the regression line shows very little imprecision between them. The "r" value close to unity shows a high degree of correlation and concordance between the two technologists, as evidenced by a random error (1-r2) of only 4.1%. The plot of the 25 blood smears, arranged form lowest to highest values, illustrates the reticulocyte counts of the samples.
The statistical analyses of agreement for intra-class correlation for parametric data, with more than two examiners,8 using the "on-line" statistical package of the University of Hong Kong,11 is illustrated in Table I. Highest concordances were obtained between technologists K and L. They were responsible for the blood smears mounting, in accordance with the criteria established by Lewis et al.7
According to the criteria of Cicchetti and Sparrow,13 Intraclass Correlation Coefficients (ICCs) can be classified for levels of clinical significance as follows: poor, < 0.40; fair, 0.40 to 0.59; good, 0.60 to 0.74; excellent, 0.75 to 1.00.
The analyses performed on the total data (Table I) show that, except for technologist I, all the technologists can be classified as having excellent ICCs .
With the data fractionated into low, medium and high counts, the sample sizes became small, causing some difficulty in interpreting the full meaning of the correlational analyses. However, the technologists do show certain difficulties in agreement for low counts (not shown).
Considering all the data, the amount of random error (1-r2) was observed as follows: <20% among technologists G, B, C and F; 10-40% among technologists D, J, H and A; >40% for technologists E and I. Technologist I with K and L showed the lowest ICC value (r = 0.64) (Table I).
Using the one-way ANOVA, we compared the mean values of counts for technologists K and L against each
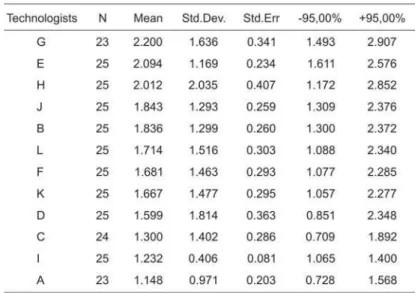
rater. The result is illustrated in Table II. No significant statistical differences were observed for the mean reticulocyte counts (p > 0.05). The mean values obtained for each rater are illustrated in Table III where it can be observed that technologist G showed the highest super-estimation in the reticulocyte countings, while A showed the lowest under-estimation.
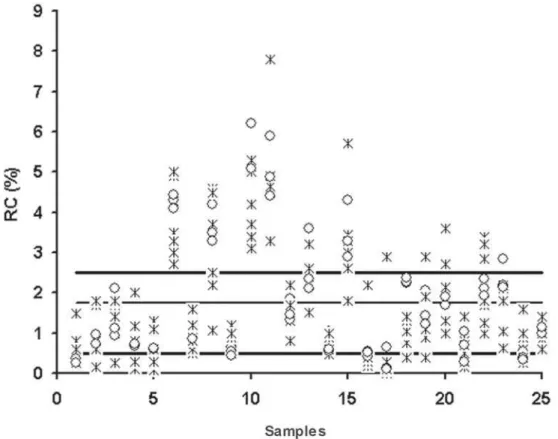
The Levey-Jennings quality control plot12 (Figure 2) for averages shows more clearly that technologists B, D, F, J, K and L had similar results; A, C and I tended to sub-estimate the counts; and E, G and H tended to super-estimate the reticulocyte counts. Figure 2 also shows the quality control chart for amplitude and the high variability of the 25 blood
reticulocyte:7,14,15
1) Pappenheimer bodies are in general a sole granule, staining darker blue then reticulocytes gra-nule. Pappenheimer bodies are secondary lysossomes, variable in their composition of iron and protein, or mitochondria with iron micelles that appears as small irregular basophilic deposits at cell periphery. The protein matrix of the granule is staining with Romanowsky stains and the iron portion of the granule is staining with Prussian blue;
2) Heinz bodies can be visualized with supravital stains as clearly blue. They are discrete inclusion in contrast to the reticular filament ma-terial in a reticulocyte. They are composed of aggregated, denatured hemoglobin and appear as masses just under or attached to the cell membrane. When appearing singly, a Heinz body is large, but when several are present in one cell, they are small;
3) Howell-Jolly bodies are dark purple or violet spherical granules in the erythrocyte, usually occurring singly, rarely more than two per cell. The granules are nuclear DNA fragments;
4) Basophilic stipplings are bluish-black gra-nules distributed intracellular, composed of aggregated ribosomes (RNA), and they are sometimes associated with mitochondria and siderosomes;
5) Protozoan inclusions as Malaria and Babesiapresent blue ring with red dot in erythrocyte and others evolution shapes (trophozoite stages) outside cells; vi) Erythrocyte artifacts that occurs when cells are mechanically traumatized, or remaining dyes, can also confound the identification of reticulocyte.
The results obtained in this work suggest that the experienced technologists involved in this work have their own criteria, and they are not calibrated as proposed by Lewis et al.7
smear counts, especially the data of technologist I that was greatly sub estimated (p < 0.05). All this said, technologist I did not perform within the 48 hour time span, as requested. These results are quite useful to signal the fact that the blood smears in glass slides are not stable beyond the 48 hour span. The stated period for counts should be observed; otherwise it will likely result in sub estimated counts.
Interesting results were obtained with the scatterplot of the 300 data points distributed across 25 blood smears (Figure
Acknowledgments
The authors wish to thank each of the laboratory participants, for a clinically valuable contribution.
Resumo
A contagem do reticulócitos é usada extensamente na rotina laboratorial para avaliar a atividade eritropoiética da medula óssea, e é de grande importância no diagnóstico e no prognóstico na terapia de anemias hemolíticas. São coradas com o azul de metileno novo e o azul cresil brilhante, o que conferem o aspecto característico de retículo quando observado ao microscópio ótico. Critérios conhecidos foram observados para um bom desempenho da contagem manual de reticulócitos, principalmente, atenção especial nas películas do sangue durante a montagem das lâminas; contagem nos campos que não contém sobreposição celular; e também no número de células avaliadas. O objetivo deste estudo foi avaliar a variação interobservadores, analisar o erro estatístico da contagem manual dos reticulócitos, e demonstrar as limitações deste método. A análise de correlação intraclasses segundo Bartko [Psychol Rep 19:3,1966; 34:418,1974] foi usada para avaliar a concordância entre 12 observadores em um total de 25 lâminas do sangue, com contagens variadas de reticulócitos. Os resultados das análises estatísticas indicam que o erro casual, calculado como (1-r2) variou de 4 a 60% entre os observadores. Embora
ocorra imprecisão entre os observadores, o perfil geral entre eles é similar, e o coeficiente de correlação intraclasse indicou que os resultados obtidos são clinicamente úteis. Rev. Bras. Hematol. Hemoter.
Palavras-chave: Hematologia; métodos estatísticos; contagem ma-nual de reticulócitos.
References
1. Wickramasinghe SN, Bain BF. Blood and Bone Marrow. 3. ed., New York: Churchill Livingstone, v. 2, 1986.
2. Lee, GR. et al. Wintrobe's Clinical Hematology. 10. ed. Baltimore: Lippincott William's & Wilkins, 1999.
3. Peebles DA, Hochberg A, Clarke TD. Analysis of manual reticulocyte counting. Am J Clin Pathol. 1981;76(5):713-7.
4. van Hove, L.; Schisano, T.; Brace, L. Anemia Diagnosis, Classification, and Monitoring Using Cell-Dyn Technology Reviewed for the New Millennium. Laboratory Hematology, 2000;6:93-108.
5. Bain, BJ. Células Sanguíneas: um guia prático. 2. ed., Porto Alegre: Artes Médicas, 1997.
6. Davis BH, Bigelow NC. Automated reticulocyte analysis. Clinical practice and associated new parameters. Hematol Oncol Clin North Am. 1994;8(4):617-30.
7. Lewis, SM.; Bain, BJ.; Bates, I. Hematologia Prática. 9 ed., São Paulo: Atmed, 2006
Avaliação: Editor e dois revisores externos Conflito de interesse: sem conflito de interesse
Recebido: 13/12/2008
Aceito após modificações: 16/02/2009 & Wilkins, 1996.