Debt Issues and Earnings Management*
Bianca Piloto Sincerre
Pontifícia Universidade Católica de São Paulo, Programa de Estudos Pós-Graduados em Administração, São Paulo, SP, Brazil
Joelson O. Sampaio
Fundação Escola de Comércio Álvares Penteado, Departamento de Administração, São Paulo, SP, Brazil
Rubens Famá
Universidade de São Paulo, Faculdade de Economia, Administração e Contabilidade, Departamento de Administração, São Paulo, SP, Brazil
José Odálio dos Santos
Pontifícia Universidade Católica de São Paulo, Departamento de Administração, São Paulo, SP, Brazil
Received on 02.08.2015 – Desk Acceptance on 03.24.2015 – 5th version approved on 03.12.2016.
ABSTRACT
The aim of this paper is to analyze earnings management (EM) surrounding debenture issues of companies listed on the BM&FBOVESPA. EM is an intentional intervention in external financial reports in order to obtain some private gain. This practice is especially important at the time of issuing debentures because if earnings are inflated, investors may pay an artificially high price. To measure earnings manage-ment, current discretionary accruals were used as a proxy, based on the Modified Jones and Modified Jones with ROA econometric mo-dels. All of the regressions considered the fixed effects of the companies and the time series effects of the analyses. Evidence was found that companies inflate their financial results in the issuing period in order to positively influence their investors. The results suggest that there is EM in the quarter preceding the issue (t = - 1), indicating the influence that investors may have been under when making the decision to invest in debentures from these companies. In addition, it was verified that companies with higher debt, profitability, and sales growth ratios have higher levels of earnings management. The reputation of the auditor was not statistically significant regarding reductions in the level of management. The results also show that companies listed on Level II and New Market had higher levels of management when considering the Modified Jones with ROA model. Therefore, it can be concluded that there is a greater level of earnings management in companies that issue debentures in the period preceding the event. Finally, the variable that is directly related to the level of earnings management is sales growth.
Keywords:earnings management, debenture, capital market.
DOI: 10.1590/1808-057x201601660
1 INTRODUCTION
to capital market incentives. In terms of market perfor-mance, he found that companies that artificially ma-naged earnings were able to attract investors; however, in the long run, the market identified the procedure, pricing this practice and penalizing shares with worse cumulative performance.
Coelho and Lopes (2007) examined the existence of earnings management and its connection with the degree of leverage in publicly-traded Brazilian compa-nies. By means of the Modified Jones model, the authors found the existence of EM in the samples examined, al-though this practice did not confirm, through statistical data, its relationship with levels of debt.
Schipper (1989) and Iudícibus and Lopes (2004) found evidence of the relationship between leverage and the level of company earnings management. These au-thors indicated that more indebted companies exhibited higher levels of EM in their financial reports, in order to generate some private gain. Nardi and Nikao (2009) highlight that, due to contractual motives and the need to acquire more favorable loans, companies can be sti-mulated into managing their earnings.
Martinez and Faria (2007) investigated whether com-panies that issued debentures in Brazil promoted ear-nings management with the intention of altering inves-tors’ risk perceptions. The results of this study showed indications of EM in the sample companies; however, they did not investigate what the EM dynamic was in the debenture issuing process. In other words, they did not analyze at which moment financial results were inflated in these companies and which operational and financial variables could be related with EM at the time of issue.
This subject has been developed and published in international journals more and more, expanding Bra-zilian academics interest in it, both from the theoretical perspective as well as that of empirical observation. Ho-wever, there are some gaps in these studies at the Brazi-lian level. One of these is in analyzing the relationship between earnings management and the process of is-suing debt securities (debentures).
Accounting, in providing information to the market, performs an important role in managing conflicts of in-terest and reducing information asymmetry. After all, according to Easley and O’Hara (2004), concise accoun-ting information reduces investor risk and proposes a relationship between the quality of information availa-ble and the returns demanded by company fund provi-ders.
Managing company earnings in order to improve them can lead users of financial information to make a mistaken analysis regarding true economic-financial performance. This study may provide evidence that managers are inflating company results in debenture is-suing periods and masking real company performance. The study is justified, in theory and practice, by con-Company accounting reports contain information
of a financial and economic nature, which can undergo adjustments carried out by managers. People with di-fferent needs and incentives may use freedoms allowed by law in order to serve private interests. The possibili-ty of exercising discretion allows managers freedom in measuring company accounting results, which is known as Earnings Management (EM). These interventions in results occur within accounting norms and principles, based on flexibility regarding the choice of certain ac-counting procedures.
The possibility of earnings being managed can cause serious problems, since the interpretation of accoun-ting reports and the measurement of company profi-tability become a combination between evaluating the company’s economic reality and identifying the possible adjustments that may have been made.
Due to accounting data containing important infor-mation that is used by a wide set of users (stakeholders), creditors use reported figures to evaluate companies in aspects related to financial health, credibility, and viabi-lity (Ge, 2009). With regards to shareholders, they mo-nitor operational performance based on, among other indicators, income. However, if shareholders cannot identify the effect of earnings management in financial statements, their interpretation regarding company per-formance may be mistaken. This bias will be revealed in future results, when company performance turns out to be very different from the estimations that were made (Cupertino, 2013).
The opportunity to manage financial reports is appealing to the executives of publicly-traded compa-nies. The causes that can contribute to this questionable behavior are many and include, notably: (i) the desire to keep their position, even if this implies compromising the quality of reported financial results; (ii) pressure from shareholders for ever greater and better quarterly results, as well as the wish to attract new investors and shareholders; and (iii) the ambition to obtain a signifi-cant bonus (compensation), even if this implies future sacrifice for the organization (Martinez, 2001).
On this point, certain accounting choices are made with the intention of misleading users with regards to real company economic-financial performance, in the desire to obtain some private gain. This practice is es-pecially important at the time of issuing debentures, be-cause if earnings are inflated, investors can pay an arti-ficially high price for these securities.
Studies carried out in Brazil have found strong evi-dence that executives have manipulated their results in response to capital market incentives.
tributions to academic knowledge, enriching the Brazi-lian literature regarding the inter-relationship between earnings management and the issuing of debt securi-ties, specifically debentures, as well as supporting the investigation into the earnings management dynamic. Another incentive for the development of this study is indicated by Iudícibus and Lopes (2004). The authors claim that the study of financial accounting, primarily in a country with particular features such as Brazil, may favor a more detailed understanding of the real incenti-ves behind managers’ actions.
With that in mind, this paper studies the earnings management dynamic surrounding the event of issuing debt securities (debenture) by companies listed on the BM&FBOVESPA, with the main aim of evaluating EM practices in debenture issuing periods, as well as iden-tifying in which debenture issuing period this interven-tion is carried out. Therefore, the study is not limited to verifying whether more or less EM occurs in companies that issue debentures and those that do not.
After a brief review of some studies that are
impor-tant to the proposed subject, it becomes evident that earnings management practices affect the quality of income, masking underlying economic transactions. When control mechanisms (auditors and regulatory bo-dies, among others) are lacking, opportunities arise for managers to manipulate earnings with the intention of achieving targets in relation to reported results, such as meeting analyst expectations, avoiding losses, maintai-ning trends for growth, or “smoothing” the level of re-ported income (Healy & Wahlen, 1999).
Thus, the study may assist various stakeholders in terms of identifying possible EM practices. Companies that have less volatile results give users more confiden-ce, making them lower risk, improving the risk-return ratio, and consequently raising their value. Moreover, earnings management can be seen as a practice that har-ms future minority shareholders, since gains obtained with the artificial overvaluation of reported earnings are enjoyed by controllers, while the onus remains on (mi-nority) shareholders who join at the time of acquiring debt securities.
2 LITERATURE REVIEW
2.1 Earnings Management
Earnings Management has aroused interest among different researchers regarding various aspects: to what extent company earnings are inflated; the quality of financial information disclosed by companies; and also the effectiveness of accounting norms and stan-dards created with the aim of protecting shareholders who act based on these statements.
According to Martinez (2001), manipulations in fi-nancial statements compromise the quality of accoun-ting information, possibly affecaccoun-ting the investments allocated to different companies. Moreover, this prac-tice can cause unmeritorious distribution of wealth, since investors with better information can increase their wealth at the expense of investors with poorer information. This often occurs as a result of the degree of subjectivity resulting from flexibility in accounting practices.
According to Scott (2011), management can use earnings management to report a smooth and rising flow over time. Given the efficiency of the stock ma-rket, this results in management taking advantage of privileged (insider) information, making earnings management a means of communicating insider infor-mation to investors. Interpreting it in this way, inco-me smoothing leads to the interesting conclusion that some earnings management may be useful, from a fi-nancial reports point of view (Scott, 2011).
However, excess earnings management may reduce
the usefulness of these financial reports for investors. This is especially true if earnings management is not totally disclosed. Moreover, earnings management can affect managers’ motivation to work hard, as a result of using EM as an instrument to facilitate their remu-neration over time, reducing the risk of compensation (Scott, 2011).
Once managers can choose accounting policies ba-sed on a set of policies, it is natural to expect them to adopt those that help them to achieve their objectives. They may also take real measures that affect income, such as cutting Research & Development (R&D) costs. These choices can be motivated not only by market efficiency and contracts (discussed further on), but also by opportunism and the rejection of market effi-ciency. Therefore, for Scott (2011), earnings mana-gement can be understood as a choice of accounting policies or real actions that affect earnings, in order to achieve some specific objective.
Healy and Wahlen (1999) claim that earnings ma-nagement occurs when managers use their judgment in financial information and in the structuring of ope-rations in order to alter financial reports, whether to mislead some interested parties with regards to com-pany economic performance, or to influence contrac-tual results that depend on reported accounting figu-res.
to exercise their judgment in financial reports, that is, there is not only earnings management via accounting choices, but also via real or operational decisions – which can also be used in the issuing of debentures. Moreover, judgment is needed to estimate countless future economic events, such as residual asset values in the long run, deferred taxes and bad debt losses, or asset impairment. Managers must also choose between accounting methods that are acceptable for reporting the same economic transactions; exercise judgment in the control of working capital, which can affect the allocation of costs and net revenues; and opt to incur or postpone R&D or advertising expenses.
The second point to highlight is that the definition given by Healy and Wahlen (1999) defines the aim of earnings management as misleading stakeholders with regards to real company economic performance. Mo-reover, this may also occur if managers have access to information that is not available to external stakehol-ders, making earnings management transparency im-probable. Thus, stakeholders are liable to expect (and tolerate) a certain amount of earnings management.
Managers can also use their accounting judgment to elaborate more informative financial reports for users. This can occur if certain accounting choices or estimates are perceived as credible signs of company financial performance.
Finally, management use of judgment in financial information, according to Healy and Wahlen (1999), has costs and benefits. The costs are poor allocation of funds that arise as a result of earnings manage-ment. The benefits include potential improvements in the management of private information for exter-nal stakeholders, improving fund allocating decisions. Therefore, it is essential to understand when norms allow managers to exercise judgment to report an in-crease in the value of accounting information for users, and when they allow a decrease in it to be reported.
Dechow, Sloan, and Sweeney (1995) discuss tech-niques for detecting earnings management: (i) chan-ges in accounting procedures; (ii) use of discretionary cash flow elements (R&D and advertising costs; ac-celerating or postponing receipt from sales); and (iii) discretionary accounting adjustments related to accru-als (increasing or reducing bad debt provisions and re-cognizing revenue in advance).
There are different models that aim to indirectly measure the level of EM in companies, since it is not directly observable. Generally, these models are based on accruals, which would be the difference between net income and net cash flow from operations. Total accruals can be divided into short term (current) and long term (non-current) components. Adjustments in current accruals only consider changes in current as-sets and liabilities, which support short term company operations. These adjustments can be made, for exam-ple, by means of recognizing sales revenues before the entry of the respective amount into cash flow; through
delaying the recognition of expenses, by means of a small provision for bad debts; and deferred recogni-tion of expenses when money is paid to suppliers in advanced. Adjustments in non-current accruals invol-ve long term liquid assets. In this case, the examples would be: non-accelerated depreciation, reduction in deferred taxes, and achievement of abnormal earnings. Due to the fact that managers have greater access, cur-rent accruals are usually used as a basis for earnings management (Teoh, Welch, & Wong, 1998).
After this brief discussion, the reason managers in-form investors of the real underlying economic situa-tion of companies is examined. The real incentives for earnings management are commented on by different international authors, especially Healy and Wahlen (1999), who present the three main ones: (i) motiva-tions linked to the capital market – the wide use of accounting information by investors and analysts cre-ates an incentive for managers to administer accoun-ting results. The aim is to alter the perception of risk regarding investments in company shares; (ii) contrac-tual motivations and regulatory motivations – earnin-gs management practices can be tied to compensation packages. Accounting data is used to help monitor and regulate contracts between companies and their va-rious stakeholders. Explicit and implicit remuneration contracts are used to align executives’ incentives and those of external stakeholders; and (iii) political costs.
Healy (1985) indicates that executives who recei-ve part of their remuneration as bonuses “inflate” ac-counting results, in order to increase their compensa-tion. This last motivation may be related to decreases in monopolists’ incomes, or to avoiding taxes and an-titrust rules.
Other interpretations regarding the subject provi-de important contributions. The study carried out by Jones (1991) showed that firms that benefit from ta-riff protection try to reduce income by adopting EM practices. The results did not reject the hypothesis that managers adopt income reducing practices in periods in which they are being investigated, in order to crea-te tariff procrea-tection. The Jones Model stood out in the academic literature in identifying the value of discre-tionary accruals. Burgstahler and Dichev (1997) also found evidence that two components of income – cash flow from operations and changes in working capital – are used to achieve an increase in income. The authors also claim that companies manage earnings to avoid losses and to maintain results.
Rangan (1998) studied the effect of EM in the sub-sequent share performance of companies that carried out a new public share offering. The author found in-flated earnings in the quarter near to the SEO (Seaso-ned Equity Offering) announcement and in the subse-quent quarter. However, the author limited himself to comparing the median value of discretionary accruals in each quarter, without controlling other variables that could affect the level of EM, such as size, sales growth, and leverage.
Hochberg (2012), based on a sample of annual data on IPOs in the United States, found evidence that IPOs of companies invested in through Private Equity and Venture Capital (PE/VC) exhibit reduced EM. The au-thor argues that larger companies have more complex financial statements, and therefore exploit this aspect to manage earnings. On the other hand, larger com-panies are also more subject to being monitored by market analysts, and this reduces the opportunities for EM.
Gioielli, Carvalho, and Sampaio (2013) showed that in IPOs of companies with PE/VC investment, EM is marginal, generally related to company characteristics, and of little relation to the phases of IPO. In contrast, in IPOs of companies not invested in through PE/VC, EM is significant, generally related to the phases of IPO, and of little relation to company characteristics.
Other studies relate earnings management with the degree of company indebtedness. Iudícibus and Lopes (2004) provided evidence of the Level of Indebtedness Hypothesis, in which more leveraged companies are predisposed to choosing accounting methods that sti-mulate increases in reported income, given that there is an interest in attracting investors to the business. Schipper (1989) had already found this relationship, suggesting that this intentional intervention in the fi-nancial reporting process could generate private gains. An, Li, and Yu (2013) also analyzed the effect of EM in financial leverage. The study aimed to verify how the EM/leverage relationship is influenced by institutio-nal environments. Evidence was found that companies involved in high levels of earnings management have, on average, greater leverage. This may be linked to the fact that a company’s EM reflects conflicts of agency between managers with privileged information and ex-ternal investors.
2.2 Earnings Management and Debt Security
Issues
Debt security holders tend to concentrate on a company’s ability to generate future cash flow to gua-rantee the payment of debt interest and principal. The quality of accounting information affects debt holders’ future cash flow estimates. Bharath, Sunder, and Sun-der (2008) found that companies with compromised accounting quality face significantly higher yield diffe-rentials for new debt security issues. Prevost, Rao, and Skousen (2008) reported that abnormal accruals have
negative impacts on the prices of all debt securities. These results suggest that creditors demand a higher rate from companies that manage earnings via accruals.
Nardi and Nakao (2009) studied the relationship be-tween earnings management and the cost of debt for publicly-traded Brazilian companies. The assumptions made based on the existing literature are that, seeking better contractual conditions, such as the cost of debt, current or past cost motivates a company to manage current earnings to obtain better future or current cost conditions. Thus, companies would intentionally aim to manage their earnings, motivated by the cost of debt. The results indicated that there is a positive relationship and the greater EM is, the higher the cost of debt.
Nardi and Nakao (2009) indicate that contractu-al motivations and the need to acquire favorable (for example, low cost) loan conditions are motivations for companies to manage their earnings. In this sense, de-benture issuing companies exhibit incentives to mana-ge their accounting results. Thus, the first hypothesis aimed to test whether companies that issue debentures exhibit a higher level of EM in relation to those that do not.
H1: Debenture issuing companies exhibit a greater le-vel of positive earnings management compared to non--issuing ones.
The first hypothesis is important because it shows whether there is a difference in behavior in relation to the level of EM between debenture issuing companies and non-issuing ones. This hypothesis aimed to verify whether the sample of debenture issuing companies is different to the sample of non-issuing ones.
Given that debenture issuing companies could have incentives to increase their level of earnings manage-ment in the issuing period, hypothesis 2 aimed to verify which stage this increase would occur in. With this in mind, the following hypothesis was formulated:
H2: Debenture issuing companies exhibit a greater le-vel of positive earnings management at the time prece-ding the issue, compared with non-issuing ones.
Considering that debenture issuing companies may exhibit a greater level of EM in one of the issue phases, hypothesis 3 aimed to identify which company charac-teristic variables (size, sales growth, ROA, leverage) could explain this greater level of EM. Hochberg (2012) argues that financial variables can exhibit a positive re-lationship with the level of company EM. Thus, this hy-pothesis aimed to test what the company financial cha-racteristics are that could explain a greater level of EM in the debenture pre-issue period. With this in mind, hypothesis 3 was formulated as shown below:
H3: Debenture issuing companies exhibit different fi-nancial and operational characteristics at the time
ding the issue, compared to non-issuing ones.
According to Ge and Kim (2014), manipulated inco-me should not be used as a reliable inco-measure of company performance for debt security holders, with the aim of evaluating the future performance of a company. In this sense, EM distorts the quality of income and increases information asymmetry with regards to company per-formance between managers and debt security holders. Evidence proves that the effect of earnings mana-gement in the debt securities market is important for various reasons. First, EM appears to be a common practice. Graham, Harvey, and Rajgopal (2005) suggest that 80% of participants in the study, executives of US companies, opted to implement real economic actions that could have negative consequences in the long run, instead of making accounting adjustments to achieve income targets in the short run.
Second, EM can hide non-managed company ear-nings, in which it can be harmful for company pro-fitability and competitive advantages in the long run (Cohen & Zarowin, 2010; Zang, 2012). Therefore, EM
increases information asymmetry between managers and debt security holders in relation to the current non-managed period for a company, and can therefore affect debt security holder estimates as a result of ma-nagers boosting company income.
This informational risk has a potential effect on the price of securities. This aspect is supported in the stu-dy by Liu, Ning, and Davidson III (2010), which found evidence that earnings management increased before companies offered debt securities to the market. The results indicated that, as shareholders, security holders cannot see through inflated income when pricing a new debt.
Finally, debenture holders have set contractu-al claims, such as periodic interest payments. They tend to concentrate on future cash flows to guarantee company’s ability to pay debt interest and principal. This occurs because EM can have direct negative con-sequences on the future level of net cash flows (Graham et al., 2005; Kim & Sohn, 2013), and debenture holders are prone to being concerned about knowing about real earnings management activities.
3 STUDY METHOD AND PROCEDURES
The methodology developed for this paper is carried out by means of panel data regressions, making it possi-ble to study the question from a time series perspective. Therefore, as well as investigating whether companies manage their accounting results, we also analyze at what time around issuing debt securities this practice is most intense.
3.1 Population and Sample
The database used in this paper is taken from the National Debentures System (Sistema Nacional de De-bêntures - SND), accessible via the website linked to the Brazilian Association of Financial and Capital Market Entities (Associação Brasileira das Entidades do Mer-cado Financeiro e de Capitais - ANBIMA). The SND has records since 1981, with daily updates. This study is based on the period from January 2010 to January 2014. The company financial data is taken from the Economá-tica® tool and quarterly company financial statements, available on the website of the Securities & Exchange Commission (Comissão de Valores Mobiliários - CVM) for the BM&FBOVESPA.
Taking into consideration that the empirical tests should be carried out on the variations in earnings management of debenture issuing companies, to begin with, listed companies that were privately held at the time of issuing debentures were excluded. Next, issues carried out by financial institutions, such as leasing
companies, were removed from the sample. This exclu-sion is considered as standard in the literature due to the fact that this segment has particular risks and acti-vities. Finally, companies whose balance sheets were not available in the specific quarter were excluded. In the end, the sample was composed of 180 companies, with 121 non-issuing companies and 59 debentures issuing companies. Considering the total of 302 companies lis-ted on the BM&FBOVESPA in 2014, the sample in the study represents 60% of the companies.
3.2 Earnings Management Measures
money is paid to suppliers in advance.
To estimate current discretionary accruals, two eco-nometric models were used in this study: the Modified Jones Model (Dechow et al., 1995 with adjustments su-ggested by Kothari et al., 2005) and the Modified Jones Model with ROA (Dechow et al., 1995 with adjustments suggested by Kothari et al., 2005).
Dechow et al. (1995) created the Modified Jones mo-del in an attempt to reduce increases in receivables from variations in sales, since they assume that there is the possibility of manipulating sales made on credit. Thus,
the model excludes growth of receivables, identifying them as manipulation in the period.
The difference between the Modified Jones and the Modified Jones with ROA models is that the second one uses a new control for estimating non-discretionary ac-cruals. As well as considering the net revenue and re-ceivables variables, the model considers the return on assets (ROA) variable in the estimation of non-discre-tionary accruals.
In the Modified Jones Model, current accruals are given by:
1
2
3
In which:
Current_Accrualsi,t: (CAi,t - CAi,t-1) - (CLi,t - CLi,t-1); CAi,t is the current assets of company i in quarter t; CLi,tis the current liabilities of company i in quarter t; Ri,t are the receivables of company i in quarter t; NRi,t are the net revenues of company i in quarter t; TAi,t are the total assets of company i in quarter t.
To estimate the current non-discretionary accruals for company i in quarter t, the regressions for the sam-ple considered in the study were determined. Based on the estimated non-discretionary accruals, it was possible to calculate the discretionary accruals. Using the Modiied Jones Model, the current discretionary accruals (EM) are calculated by:
In which:
Discretionary_Accrualsi,t represent the EM for com-pany i in quarter t, which is calculated as the difference between the CAi,t variables (current accruals weighted by total assets in t-1 and non-discretionary accruals [resul-ting from the estimation of betas in the model (1)]).
According to Guay, Kothari, and Watts (1996), the
simple regression of return on discretionary accruals su-ggests that the Modified Jones model produces consis-tent discretionary accruals both with the improvement of performance as well as with opportunistic income smoothing.
In the Modified Jones Model with ROA, current ac-cruals are specified by:
In which:
ROAi,tis the return on assets of company i in quarter t.
3.3 Econometric Specification
To test hypothesis H1, panel regressions were used,
of one (1) when the observation is from a company that issued debentures at moment t. To confirm H1, the co-efficient of this variable should be positive and
statisti-cally significant. The econometric model also includes different control variables that can influence the incen-tives for earnings management.
4
5
EMi,t = β0 + β1Debenturei + β2Auditori + β3Sizei,t + β4Growthi,t +β5Leveragei,t + β6ROAi,t +β7Governancei +
γ'quartert + δ'industryj + εi,t
EMi,t = β0 + β1Pre-Issue2i,t + β2Pre-Issue1i,t + β3Issuei,t
+β4Post-Issuei,t +β5Auditori + β6Sizei,t +β7Growthi,t +β8Leveragei,t + β9ROAi,t +β10Governancei +
γ'quartert + δ'industryj + εi,t In which:
Debenturei: is the dummy variable that takes the value of one (1) if company i issued debentures, and zero (0) if not;
Auditori: is the dummy variable that takes the value of 1 if company i had its inancial statements audited by one of the market leaders (big four), and 0 if not;
Sizei,t: is the natural logarithm of total assets of company i in quarter t (in millions of reais);
Growthi: is the variation in net revenue from operations of company i between quarters t – 1 and t, divided by net revenue from operations in quarter t – 1;
Leveragei,t: leverage of company i in quarter t, calculated as one minus the ratio between net equity and total assets;
ROAi,t: return on assets of company i between quarters t – 1 and t, calculated as the ratio between net income and total assets;
Corporate Governancei: dummy variable that takes the value of 1 if company i is listed on Level 2 or New Market of the BM&FBOVESPA, and 0 if not;
γ'quartert: is the vector of parameters that controls by quarters;
δ'industryj: is the vector of parameters that controls by sectors (Economática).
The Auditori variable has the effect of external mo-nitor, working as a certification agent, which can res-train companies’ EM. For Morsfield and Tan (2006), the external auditor’s reputation could be damaged if they are not able to identify accounting distortions. Because of this, the expected result for the Auditori variable is negative.
The Sizei,t variable can have a positive or negative effect on EM. For Hochberg (2012), the financial sta-tements of larger companies are more complex, a factor that could facilitate earnings management. However, these companies are also subject to being monitored by
market analysts, which could reduce opportunities for EM.
The result expected for the Growthi variable is posi-tive. For Hochberg (2012), companies with higher gro-wth rates are more prone to presenting higher levels of discretionary accruals, since they present a higher mar-gin for EM.
Similar to the Sizei,t variable, there is no clear expec-tation for the Leveragei,t variable. However, for Mors-field and Tan (2006), more leveraged companies have incentives to positively manipulate earnings, with the intention of avoiding violating debt contract clauses; nevertheless, these companies also face greater moni-toring from debt holders. Moreover, Schipper (1989) and Iudícibus and Lopes (2004) provided evidence that companies with high levels of leverage also exhibited higher levels of EM.
The ROAi,t variable aims to control potential bias be-tween EM and company performance. For Dechow et al. (1995), the earnings management tests can be badly specified if discretionary accruals are correlated with company performance.
The result expected for the Corporate Governancei variable is negative. For Bowen, Rajgopal and Venkata-chalam (2008), a low level of Corporate Governance can benefit earnings management, since there can be infor-mation asymmetry between shareholders and company managers.
To test hypothesis H2, which takes possible differen-ces in the level of EM over time into consideration, the same basic specification of Model 4 was used, with the addition of dummy variables indicative of all the phases of issuing debentures. To confirm H2 the coefficient of one of the phase dummy variables should be positive and statistically significant. The model also includes di-fferent control variables that can influence the incenti-ves for earnings management:
In which:
Pre-Issue2i,t: is the dummy variable that takes the va-lue of one (1) for company i two quarters before the de-benture issue, and zero (0) if this is not the case;
Issuei,t: is the dummy variable that takes the value of 1 for company i in the debenture issuing quarter, and 0 if this is not the case;
Post-Issuei,t: is the dummy variable that takes the
va-lue of 1 for company i one quarter after the debenture issue, and 0 if this is not the case.
In Model 5, the dummy variable Post-Issuei,t is the omitted variable, with the intention of avoiding perfect collinearity. Therefore, the coefficients in Pre-Issue2i,t, Pre-Issue1i,t and Issuei,t should be interpreted as diffe-rences in relation to the Post-Issuei,tvariable. To confirm hypothesis H2, the sign associated with these dummies should be positive and statistically significant.
To test hypothesis H3, which takes possible
diffe-rences in company financial performance during the debenture issuing phases into consideration, as well as the level of EM over time, the same specification as Mo-del 5 was used, with the addition of dummy variables indicative of all the phases of debenture issues, as well as the interactive terms of these variables with the com-pany financial variables. The variables used were “audi-tor”, “size”, “growth”, “leverage”, “ROA”, and “corporate governance”. The interactive terms in this specification showed whether there was a relationship between com-pany financial characteristics and the level of EM in the pre-issue period.
To confirm H3, the coefficients of the interaction term variables should be statistically significant. Simi-larly, this model was estimated in the following way:
6
EMi,t = β0 + β1Pre-Issue2i,t + β2Pre-Issue1i,t + β3Issuei,t
+β4Post-Issuei,t +β5Auditori + β6Sizei,t +β7Growthi,t+β8Leveragei,t + β9ROAi,t +β10Governancei + β'kx'i,t +
γ'quartert + δ'industryj + εi,t
In which:
β'kx'i,tis a vector of parameters estimated based on the interactions of the debenture issuing phase dummies with the company inancial variables.
In Model 6, again the dummy variable Post-Issuei,t
is the omitted variable with the intention of avoiding perfect collinearity. To conirm hypothesis H3, the co-eicients associated with the issuing phase interaction dummies with the company inancial variables should be statistically signiicant.
4 RESULTS
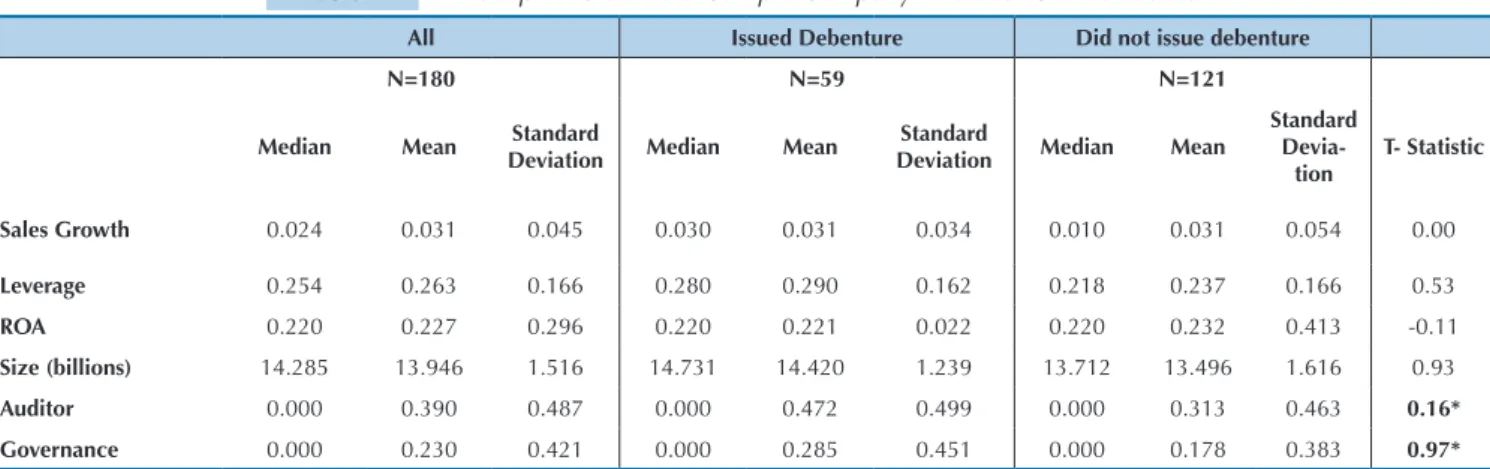
Table 1 presents the descriptive statistics for the varia-bles that characterize the heterogeneity of the companies. Initially, it is observed that, for these variables, the sam-ples of debenture issuing and non-issuing companies are similar. For example, the average size of the issuing panies is 14.7 million (logarithm of total assets of com-pany i in period t); the average size for the non-issuing companies is 13.7 million. For the issuing company sam-ples, the average for the ROA variable was 22.1%, whi-le the average for the non-issuing company sampwhi-le was 23.2%. hese diferences were not statistically signiicant.
Additionally, it is possible to observe a similar pattern for other variables, such as sales growth and leverage.
he only aspects in which the two samples are sig-niicantly diferent are: (i) quality of auditor: 47.2% of issuing companies contracted one of the market lea-ders (big four), against 31.2% of the non-issuing com-panies; and (ii) level of corporate governance: 28.5% of the issuing companies are listed on the Level II and New Market of corporate governance, against 17.8% of non--issuing companies. hese diferences are statistically sig-niicant to 10%.
Table 1 Descriptive Statistic of Sample Company Financial Characteristics
All Issued Debenture Did not issue debenture
N=180 N=59 N=121
Median Mean Standard
Deviation Median Mean
Standard
Deviation Median Mean
Standard
Devia-tion
T- Statistic
Sales Growth 0.024 0.031 0.045 0.030 0.031 0.034 0.010 0.031 0.054 0.00
Leverage 0.254 0.263 0.166 0.280 0.290 0.162 0.218 0.237 0.166 0.53
ROA 0.220 0.227 0.296 0.220 0.221 0.022 0.220 0.232 0.413 -0.11
Size (billions) 14.285 13.946 1.516 14.731 14.420 1.239 13.712 13.496 1.616 0.93
Auditor 0.000 0.390 0.487 0.000 0.472 0.499 0.000 0.313 0.463 0.16*
Governance 0.000 0.230 0.421 0.000 0.285 0.451 0.000 0.178 0.383 0.97*
Note. The “company size” variable is in million reais and refers to the date of data collection, carried out in Nov. 2014; all the data is in 2014 money; the “size” variable is the natural logarithm of Total Assets; the T statistic tests the differences of means between the companies that issued debentures and those that did not.
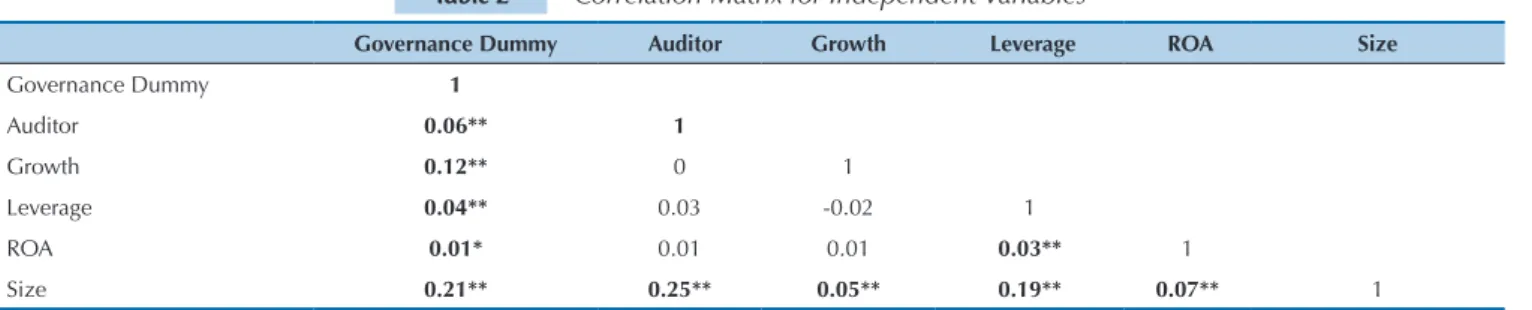
Table 2 presents the correlation between the exoge-nous variables. In general, the correlations are low, al-though some are statistically signiicant to a degree of 1%. As expected, companies listed on Level II and New Market are positively associated with auditors with good reputations (big four) and tend to be larger companies.
his indicates that companies that decide on these levels of governance opt to contract bigger independent au-ditors. he “leverage” and “size” variables are positively correlated, indicating that larger companies exhibit gher leverage ratios. Finally, larger companies show hi-gher sales growth rates.
Table 2 Correlation Matrix for Independent Variables
Table 3 Earnings Management in Debenture Issues
Governance Dummy Auditor Growth Leverage ROA Size
Governance Dummy 1
Auditor 0.06** 1
Growth 0.12** 0 1
Leverage 0.04** 0.03 -0.02 1
ROA 0.01* 0.01 0.01 0.03** 1
Size 0.21** 0.25** 0.05** 0.19** 0.07** 1
Panel A: All the Phases Together
Model Sample Companies Mean Standard Deviation
Modiied
Jones
All the Companies 180 3.80% 3.01%
Issuing 59 3.80% 3.00%
Non-Issuing 121 3.70% 3.02%
Difference 0.10%*
Modiied Jones
with ROA
All the Companies 180 4.08% 3.28%
Issuing 59 4.21% 3.31%
Non-Issuing 121 3.96% 3.25%
Difference 0.25%*
Note. *, ** and *** denote significance to degrees of 10%, 5% and 1% (for two-tailed tests), respectively. Source: Developed by the authors.
Note. Descriptive statistics for the level of earnings management in debenture issues: the sample consists of 180 companies per quarter, with 59 issuing debentures on the BM&FBOVESPA from Jan. 2010 to Jan. 2014; the two measurements of earnings management are based on the Modified Jones and Modified Jones with ROA models; earnings management is in percentage of total assets; the differences highlighted in bold indicate that the t test for the difference of means is statistically significant to a degree of 10% or less.
*, ** and *** denote significance to degrees of 10%, 5% and 1% (for two-tailed tests), respectively. Source: Developed by the authors.
Table 3 presents descriptive statistics for the level of earnings management, for debenture issuing and non--issuing companies. he results are presented for the two proxies for earnings management, the Modiied Jones and the Modiied Jones with ROA models. Initially, what stan-ds out is that the averages and standard deviations exhi-bit little variation for each of the models. Observing the sample as a whole, the average level of EM, measured by current discretionary accruals as a percentage of total as-sets in the quarter preceding the issue, varies from 3.80%
to 4.08%, depending on the model used. When the sam-ple is divided into issuing and non-issuing companies, the following diference stands out: earnings management in issuing companies varies from 3.80% to 4.21%, while in non-issuing companies it varies from 3.7% to 3.96%. his diference is statistically signiicant to a degree of 10% (in-dependently of the proxy used for earnings management). his result is consistent with hypothesis H1, that is, de-benture issuing companies tend to exhibit greater levels of earnings management.
Table 4 presents the level of management, considering the issuing phases. It is observed that, on average, ear-nings management is positive and higher in the deben-ture pre-issue period, that is, it is greater in the quarter preceding the issue. The phase that considers two quar-ters that precede the issue does not exhibit statistically different levels of management in relation to non-issuing companies. Thus, the results found indicate that EM is greater in the quarter preceding the issue, the accounting statements for which are generally published during the
following quarter, in which the debenture purchase oc-curs. Thus, these companies aim to show better results in order to influence investors at the time of purchasing debentures. It is important to highlight that the level of management is much lower in the issuing quarter. This indicates that reversion occurs quickly, given that the level of management increases in the pre-issuing phase and falls considerably in the issuing phase.
issuing companies, varying from 1.01% to 1.07% more in relation to non-issuing companies. The difference in
means for the two groups during the pre-issuing phase is statistically significant to a degree of 1%.
Table 4 Earnings Management in Issuing Phases
Table 5 Earnings Management and Debenture Issuing Regressions
Model Pre-Issue_2 Pre-Issue_1 Issue
N Mean Difference Mean Difference Mean
Modiied
Jones 59 3.67% 1.01%*** 4.68% -0.47%** 4.21%
Modiied Jones
with ROA 58 4.02% 1.07%*** 5.09% -0.99%*** 4.10%
Modiied Jones Modiied Jones with ROA
Least Squares Method
(1)
Random Effects
(2)
Fixed Effects
(3)
Least Squares Method
(4)
Random Effects
(5)
Fixed Effects
(6)
Issuing dummy 0.000 0.000 0.002 0.002
(0.25) (0.05) (1.32) (1.38)
Governance dummy 0.001 0.001 0.002 0.002
(1.20) (0.64) (1.65) (1.49)
Auditor 0.000 -0.000 0.001 0.001
(0.39) (-0.14) (0.55) (0.55)
Growth 0.020** 0.018* 0.018* 0.026** 0.025** 0.027**
(1.98) (1.83) (1.82) (2.44) (2.40) (2.59)
Leverage 0.007** 0.008*** 0.012*** 0.005 0.005 0.007
(2.31) (2.78) (3.11) (1.35) (1.48) (1.58)
ROA 0.007*** 0.007*** 0.008*** 0.008*** 0.008*** 0.007***
(9.09) (9.96) (10.01) (12.92) (17.40) (24.77)
Size -0.001*** -0.001** -0.002 -0.001 -0.001 -0.002*
(-2.65) (-2.30) (-1.41) (-0.98) (-0.95) (-1.76)
Quarterly dummies Yes Yes Yes Yes Yes Yes
Cluster per Companies Yes Yes Yes Yes Yes Yes
Observations 4.491 4.491 4.491 4.132 4.132 4.132
R-squared 0.0191 . 0.00540 0.0164 . 0.00378
Note. Descriptive statistics for the level of earnings management in debenture issues, considering the issuing phases; the sample consists of 180 companies per quarter, with 59 issuing debentures on the BM&FBOVESPA, from Jan. 2010 to Jan. 2014; the two measurements of earnings management are based on the Modified Jones and the Modified Jones with ROA models; earnings management is in percentage of total assets; the differences highlighted in bold indicate that the t test for the difference in means is statistically significant to a degree of 10% or less.
*, ** and *** denote significance to degrees of 10%, 5% and 1% (for two-tailed tests), respectively. Source: Developed by the authors.
Note. Panel regression analysis of level of earnings management in debenture issues; the dependent variable is the level of earnings management for company i in quarter t
as a percentage of total assets; it was calculated using two different models (Modified Jones and Modified Jones with ROA); the sample consists of 4,491 observations for 180 companies per quarter, with 59 issuing debentures on the BM&FBOVESPA from Jan 2010 to Jan 2014; the t (or z) statistics that are robust in heteroskedasticity via the White (1980) correction method are presented in brackets; moreover, all the regressions were estimated with standard deviation with cluster per company.
*, ** and *** denote significance to degrees of 10%, 5% and 1% (for two-tailed tests), respectively. Source: Developed by the authors.
Table 5 presents the estimates for the model that in-cludes the dummy variable, which identiies the compa-nies that issued debentures. As expected, the sign of the dummy variable is not statistically signiicant for any mo-del. his result highlights that there is no statistically sig-niicant diference, in terms of EM, between the sample of debenture issuing companies and non-issuing ones. Al-though this result may conlict with the univariate analy-sis presented in Table 3, the diference is that the results presented in Table 5 show the diference in terms of EM, considering a set of control variables, which represent the sample company characteristics, such as: sales growth, size, ROA, leverage, auditor dummies and corporate
go-vernance. As the signs of these variables exhibit statistical signiicance, this indicates that the level of EM is related to these characteristics.
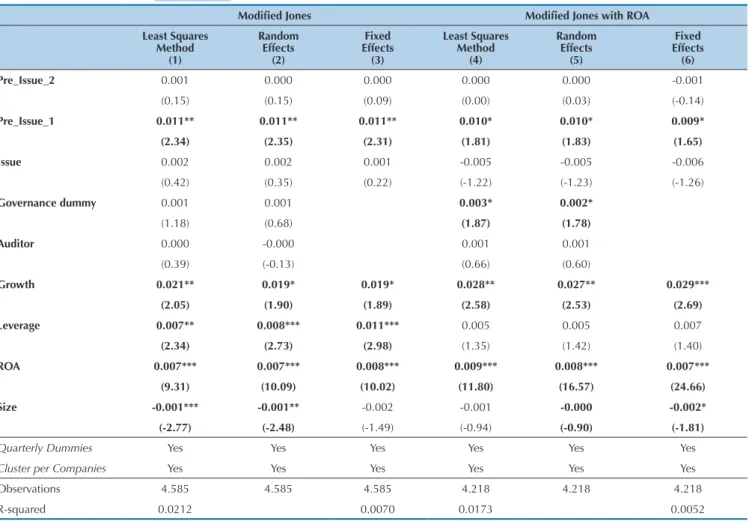
Table 6 presents the estimates for the model, which includes the debenture issuing phases as explanatory variables to capture in which phase earnings manage-ment is greater for issuing companies, in relation to non-issuing ones. The dummy variable for the post--issue phase is omitted. The dynamic captured in Table 6 is similar to that reported in the univariate analysis (Table 4). The coefficients of the Pre_Issue_2i,t, and Issuei,t, dummy variables are not statistically signifi-cant, except the Pre_Issue_1i,t, variable, which is sta-tistically significant to degrees of 5% and 10% in all the models (Modified Jones and Modified Jones with ROA) and in all the specifications (Fixed and Random Effects Panel and Pooled OLS). The level of earnings management in the quarter preceding the issue, con-trolled by the company financial and economic
cha-racteristics, is positive and greater in relation to the non-issuing companies.
It stands out that this result is robust with regards to the insertion of different controls, earnings manage-ment measures, and statistical methods. The leverage (in line with An et al., 2013), sales growth (as observed by Dechow, Hutton, Kim, & Sloan, 2012), and ROA (as observed by Silva, Weffort, Flores, & Silva, 2014; Mc-Nichols, 2000; and Kothari et al., 2005) variables exhi-bit, statistically, a significant and positive effect on the level of earnings management.
The “size” variable was the only one which, being statistically significant, exhibited a negative effect. Fi-nally, the F test, for joint significance of all the expla-natory variables for the fixed effect model is statisti-cally significant to a degree of 1%.
Table 6 Earnings Management and Debenture Issuing Regressions
Modiied Jones Modiied Jones with ROA
Least Squares Method
(1)
Random Effects
(2)
Fixed Effects
(3)
Least Squares Method
(4)
Random Effects
(5)
Fixed Effects
(6)
Pre_Issue_2 0.001 0.000 0.000 0.000 0.000 -0.001
(0.15) (0.15) (0.09) (0.00) (0.03) (-0.14)
Pre_Issue_1 0.011** 0.011** 0.011** 0.010* 0.010* 0.009*
(2.34) (2.35) (2.31) (1.81) (1.83) (1.65)
Issue 0.002 0.002 0.001 -0.005 -0.005 -0.006
(0.42) (0.35) (0.22) (-1.22) (-1.23) (-1.26)
Governance dummy 0.001 0.001 0.003* 0.002*
(1.18) (0.68) (1.87) (1.78)
Auditor 0.000 -0.000 0.001 0.001
(0.39) (-0.13) (0.66) (0.60)
Growth 0.021** 0.019* 0.019* 0.028** 0.027** 0.029***
(2.05) (1.90) (1.89) (2.58) (2.53) (2.69)
Leverage 0.007** 0.008*** 0.011*** 0.005 0.005 0.007
(2.34) (2.73) (2.98) (1.35) (1.42) (1.40)
ROA 0.007*** 0.007*** 0.008*** 0.009*** 0.008*** 0.007***
(9.31) (10.09) (10.02) (11.80) (16.57) (24.66)
Size -0.001*** -0.001** -0.002 -0.001 -0.000 -0.002*
(-2.77) (-2.48) (-1.49) (-0.94) (-0.90) (-1.81)
Quarterly Dummies Yes Yes Yes Yes Yes Yes
Cluster per Companies Yes Yes Yes Yes Yes Yes
Observations 4.585 4.585 4.585 4.218 4.218 4.218
R-squared 0.0212 0.0070 0.0173 0.0052
Note. Panel regression analysis of level of earnings management in debenture issues; the dependent variable is the level of earnings management for company i in quarter t
as a percentage of total assets; it was calculated using two different models (Modified Jones and Modified Jones with ROA); the sample consists of 4,491 observations for 180 companies per quarter, with 59 issuing debentures on the BM&FBOVESPA from Jan 2010 to Jan 2014; the t (or z) statistics that are robust in heteroskedasticity via the White (1980) correction method are presented in brackets; moreover, all the regressions were estimated with standard deviation with cluster per company.
*, ** and *** denote significance to degrees of 10%, 5% and 1% (for two-tailed tests), respectively. Source: Developed by the authors.
Table 7 presents the results obtained in Table 6, howe-ver considering the interactions of the phase dummy va-riables with each one of the company inancial vava-riables. With these interactions, it is possible to analyze which company characteristics better explain the level of mana-gement in the debenture pre-issue phase. As can be obser-ved, the most important variable that explains the level of
management vary positively between 2.66% and 3.92%. Hochberg (2012) supports the results, in which
compa-nies with higher sales growth may be more prone to exhi-biting a higher level of discretionary accruals.
Table 7 Earnings Management Regressions Considering Interactions with Issuing Phases
Modiied Jones Modiied Jones with ROA
Least Squares Method
(1)
Random Effects
(2)
Fixed Effects (3)
Least Squares Method
(4)
Random Effects
(5)
Fixed Effects
(6)
Pre_Issue_2 -0.003 -0.003 -0.003 -0.004 -0.003 -0.004
(-0.67) (-0.59) (-0.60) (-0.78) (-0.68) (-0.71)
Issue 0.003 0.002 0.002 -0.003 -0.003 -0.004
(0.47) (0.37) (0.27) (-0.43) (-0.45) (-0.57)
Pre Issue 1 Auditor 0.000 0.001 0.001 0.004 0.004 0.004
(0.00) (0.12) (0.09) (0.37) (0.38) (0.36)
Pre Issue 1 Governance -0.004 -0.007 -0.008 -0.015 -0.020* -0.023*
(-0.39) (-0.70) (-0.81) (-1.34) (-1.71) (-1.95)
Pre Issue 1 Growth 0.289* 0.274* 0.266* 0.392** 0.374* 0.378*
(1.83) (1.72) (1.66) (2.00) (1.86) (1.85)
Pre Issue 1 Leverage -0.011 -0.010 -0.008 -0.057* -0.057* -0.049
(-0.36) (-0.35) (-0.28) (-1.90) (-1.90) (-1.60)
Pre Issue 1 ROA 0.018 -0.063 -0.114 0.014 -0.104 -0.155
(0.05) (-0.17) (-0.32) (0.03) (-0.26) (-0.38)
Pre Issue 1 Size 0.000 -0.001 -0.002 0.001 -0.000 -0.001
(0.04) (-0.15) (-0.29) (0.17) (-0.07) (-0.21)
Quarterly Dummies Yes Yes Yes Yes Yes Yes
Cluster per Companies Yes Yes Yes Yes Yes Yes
Observations 2.517 2.517 2.517 2.294 2.294 2.294
R-squared 0.0244 0.0023 0.0280 0.0045
Note. Panel regression analysis of level of earnings management in debenture issues, considering the interactions of company characteristic variables with the Pre Issue 1 variable, which corresponds to the quarter that precedes the debenture issue; the dependent variable is the level of earnings management for company i in quarter t as a percentage of total assets; it was calculated using two different models (Modified Jones and Modified Jones with ROA); the sample consists of 4,491 observations for 180 companies per quarter, with 59 issuing debentures on the BM&FBOVESPA from Jan. 2010 to Jan. 2014; the t (or z) statistics that are robust in heteroskedasticity via the White (1980) correction method are presented in brackets.
*, ** and *** denote significance to degrees of 10%, 5% and 1% (for two-tailed tests), respectively. Source: Developed by the authors.
Finally, for robustness efects, the Propensity Score Matching (PSM) method was used to minimize the se-lection problems that could cause bias in the results in the samples of this study. his methodology aims to take control groups and give comparable treatments. For this, it seeks to homogenize the spread of diferent variables between groups.
he Matching was estimated considering similar companies in terms of size, leverage, and proitability. he idea of choosing these variables is that it is expected that companies of similar size, degrees of leverage, and proitability also exhibit similar levels of EM. hus, it is
possible to control observable characteristics that could cause bias in the results already found. Hence, the dife-rence would be the issuing of debentures. Table 8 pre-sents the earnings management analysis considering this method. As can be observed, the level of management is positive and statistically signiicant to a degree of 10%. he debenture issuing companies exhibit a positive level of EM, which varies between 0.9% and 1% in the pha-se that precedes the issue. Both in the pre-issue phrapha-ses, considering two quarters, and in the issue phase, there are no statistically signiicant diferences in terms of ear-nings management.
Table 8 Earnings Management considering Propensity Score Matching
Pre_Issue_2 Pre_Issue_1 Issue Pre_Issue_2 Pre_Issue_1 Issue
-0.001 0.009 0.004 -0.000 0.010 0.000
(0.23) (1.74)* (0.83) (0.08) (1.74)* (0.06)
N 5.179 5.179 5.179 4.778 4.778 4.778
Note. For each one of the issues a matching was carried out with one company from the same sector with similar profitability, leverage, and sales growth, however which had not issued debentures; the dependent variable is the level of earnings management for company i in quarter t as a percentage of total assets; it was calculated using two different models (Modified Jones and Modified Jones with ROA); the sample consists of 4,491 observations for 180 companies per quarter, with 59 issuing debentures on the BM&FBOVESPA from Jan. 2010 to Jan. 2014; the t (or z) statistics that are robust in heteroskedasticity via the White (1980) correction method are presented in brackets. *, ** and *** denote significance to degrees of 10%, 5% and 1% (for two-tailed tests), respectively.
5 FINAL REMARKS
In light of the assumptions and suppositions of the literature on earnings management, and its motivations and consequences, the aim of this study was to evaluate EM practices in debt security issuing periods, identifying in which debenture issuing period these interventions are carried out, in order to positively inluence investors. his inluence may result in investors not being able to make the best possible decisions based on the inancial results presented by these companies. hus, investors may be induced into buying debt securities of companies that do not have good inancial conditions, possibly ge-nerating negative results in the future.
he study used current discretionary accruals as a proxy for earnings management, derived from the Mo-diied Jones and MoMo-diied Jones with ROA models (De-chow et al., 1995 with adjustments suggested by Kothari et al., 2005). Moreover, other control variables were spe-ciied.
With regards to the results, it was found that, as well as the debt pre-issue phase 1, leverage, sales growth, and ROA were variables that exhibited a positive and statis-tically signiicant efect on the level of earnings manage-ment. he only variable that exhibited a negative, statis-tically signiicant efect, was the “size” variable.
he sign of the debenture issuing dummy variable, tested in the irst hypothesis, does not exhibit statistical signiicance for any model. his result reinforces, as ex-pected, there being no statistically signiicant diference, in terms of EM, between the sample of issuing compa-nies and non-issuing compacompa-nies.
In relation to the results regarding the study’s second hypothesis, which aimed to analyze the EM dynamic at the time of issuing debentures, these allowed for non rejection of this hypothesis. he results showed that the quarter that exhibited the greatest level of management was that preceding the issue.
Ater examining the period in which there is the gre-atest level of earnings management, hypothesis 3 was in-vestigated – which variable, interacting with the dummy regarding the quarter preceding the issue, would stand out. Both in the Modiied Jones and in the Modiied
Jo-nes with ROA model, the Sales Growth interaction varia-ble is statistically signiicant to degrees of 5% and 10%. hus, the most important variable that explained the le-vel of management in the period was sales growth. his result can partly be explained by the fact that companies that exhibit higher sales growth rates also have higher margins for managing their earnings. his result leads to the conirmation of hypothesis 3, which states that there is a relationship between the level of EM and company inancial characteristics.
herefore, it became clear that debenture issuing companies managed their earnings in the quarter pre-ceding the issue. hus, the results found show that these companies tend to exhibit greater levels of earnings ma-nagement in the phase in which investors are attracted to purchasing debentures. hese companies aim to present better results in order to inluence investors at the time of purchase. he companies that exhibit a greater level of earnings management in the phase in which investors opt to acquire debentures are those that exhibit a higher level of sales growth. his occurs due to the higher mar-gin that these companies have in manamar-ging their inan-cial results.
As a result of this practice, investors may be induced into buying debt securities of companies that have poor inancial results, which due to the practicing of EM, end up being inlated. In the short run, the holders of the-se the-securities may be disadvantaged for not being able to better evaluate the results presented in the period of ac-quiring these debentures. In the long run, these compa-nies will need to reverse the inlated results in the deben-ture sale period. his reversion can generate even greater losses for investors who want to trade their debentures on the secondary market. herefore, it is up to regulatory bodies to propose monitoring measures that minimize the information asymmetry there is between investors and issuing companies at the time of issuing debentures.
Correspondence Address:
Bianca Piloto Sincerre
Pontifícia Universidade Católica de São Paulo, Departamento de Pós-Graduação em Administração Rua Ministro Godoy, 969, 4º andar, sala 4E-04 – CEP: 05015-901
Perdizes – São Paulo – SP Email: [email protected]
References
An, Z., Li, D., & Yu, J. (2013). Earnings management, capital structure and the role of institutional environments. Financial Research Network Research Paper. Retrieved from SSRN: http://ssrn.com/ abstract=2207804 ou http://dx.doi.org/10.2139/ssrn.2207804 . Associação Brasileira das Entidades dos Mercados Financeiros e de
Capitais (2014). Consolidated data. Retrieved on November 8th 2014, from http://www.debentures.com.br/dadosconsolidados/ comparativovaloresmobiliarios.asp.
Bharath, S. T., Sunder, J., & Sunder, S. V. (2008). Accounting quality and debt contracting. he Accounting Review, 83(1), 1–28.
Bowen, R., Rajgopal, S., & Venkatachalam, M. (2008). Accounting discretion, corporate governance and irm performance. Contemporary Accounting Research, 25(2), 351-405.
Burgstahler, D., & Dichev, I. (1997). Earnings management to avoid earnings decreases and losses. Journal of Accounting and Economics, 24(1), 99-126.
Coelho, A. C. D., & Lopes, A. B. (2007). Avaliação da prática de gerenciamento de resultados na apuração de lucro por companhias abertas brasileiras conforme seu grau de alavancagem inanceira. Revista de Administração Contemporânea, 11(2), 121-144. Cohen, D. A., & Zarowin, P. (2010). Accrual-based and real earnings
management activities around seasoned equity oferings. Journal of Accounting and Economics, 50(1), 2–19.
Cupertino, C. M. (2013). Gerenciamento de resultados por decisões operacionais no mercado brasileiro de capitais. Doctoral thesis, Programa de Pós-Graduação em Administração da Universidade Federal de Santa Catarina, Florianópolis, SC, Brasil.
Dechow, P. M., Hutton, A. P., Kim, J. H., & Sloan, R. G. (2012). Detecting earnings management: A new approach. Journal of Accounting Research, 50(2), 275-334.
Dechow, P. M., Sloan, R. G., & Sweeney, A. P. (1995). Detecting earnings management. Accounting Review, 70(2), 193-225.
Easley, H., & O’Hara, M. (2004). Information and the cost of capital. he Journal of Finance, 59(4), 1553-1583.
Ge, W. (2009). Essays on real earnings management. Doctoral Dissertation - Desautels Faculty of Management, McGill University, Montreal, Canada.
Ge, W., & Kim, J. B. (2014). Real earnings management and the cost of new corporate bonds. Journal of Business Research, 67(4), 641-647. Gioielli, S. P. O., Carvalho, A. G., & Sampaio, J. O. (2013). Capital de risco
e gerenciamento de resultados em IPOs. Brazilian Business Review, 10(4), 32-68.
Graham, J. R., Harvey, C. R., & Rajgopal, S. (2005). he economic implications of corporate inancial reporting. Journal of Accounting and Economics, 40(1), 3–73.
Guay, W. R., Kothari, S. P., & Watts, R. L. (1996). A market-based evaluation of discretionary accruals model. Journal of Accounting Research, 34, 83-105.
Healy, P. M. (1985). he efect of bonus schemes of accounting decisions. Journal of Accounting and Economics, 7(1), 85-107.
Healy, P. M., & Wahlen, J. M. (1999). A review of the earnings
management literature and its implications for standard setting. Accounting Horizons, 13(4), 365-383.
Hochberg, Y. V. (2012). Venture Capital and Corporate Governance in the Newly Public Firm. Review of Finance, 16(2), 429-480.
Iudicibus, S., & Lopes, A. B. (2004). Teoria Avançada da Contabilidade. São Paulo: Atlas.
Jones, J. J. (1991). Earnings management during import relief investigations. Journal of Accounting Research, 29(2), 193-228. Kim, J. B., & Sohn, B. C. (2013). Real earnings management and cost of
capital. Journal of Accounting and Public Policy, 32(6), 518-543. Kothari, S. P., Leone, A. J., & Wasley, C. E. (2005). Performance matched
discretionary accrual measures. Journal of Accounting and Economics, 39(1), 163-197.
Liu, Y., Ning, Y., & Davidson III, W. N. (2010). Earnings Management Surrounding New Debt Issues. he Financial Review, 45, 659-681. Martinez, A. L. (2001). Gerenciamento dos resultados contábeis: estudo empírico das companhias abertas brasileiras. Tese de doutorado, Faculdade de Economia, Administração e Contabilidade, Universidade de São Paulo, São Paulo, SP, Brasil.
Martinez, A. L., & Faria, M. P. (2007). Emissão de debêntures e earnings management no Brasil. Revista de Informação Contábil, 2(1), 57-71. McNichols, M. (2000). Research design issues in earnings management
studies. Journal of Accounting and Public Policy, 19(4), 313-345. Morsield, S. G., & Tan, C. E. L. (2006). Do venture capitalists inluence
the decision to manage earnings in initial public oferings? Accounting Review, 81(5), 1119-1150.
Nardi, P. C. C., & Nakao, S. H. (2009). Gerenciamento de resultados e a relação com o custo da dívida das empresas brasileiras abertas. Revista Contabilidade & Finanças, 20(50), 77-100.
Prevost, A. K., Rao, R. P., & Skousen, C. J. (2008). Earnings Management and the Cost of Debt. Available at SSRN: http://ssrn.com/
abstract=1083808 ou http://dx.doi.org/10.2139/ssrn.1083808. Rangan, S. (1998). Earnings management and the performance of
seasoned equity oferings. Journal of Financial Economics, 50(1), 101-122.
Schipper, K. (1989). Commentary on earnings management. Accounting Horizons, 3(4), 91-102.
Scott, W. R. (2011). Financial Accounting heory (6th ed.). Upper Saddle River, N.J.: Prentice Hall.
Silva, A. F., Wefort, E. F. J., Flores, E. S., & Silva, G. P. (2014). Earnings management and economic crises in the Brazilian capital market. Revista de Administração de Empresas, 54(3), 268-283.
Teoh, S. H., Welch, I., & Wong, T. J. (1998). Earnings management and the long-run market performance of initial public oferings. he Journal of Finance, 53(6), 1935-1974.
White, H. (1980). A heteroskedasticity-consistent covariance matrix estimator and a direct test for heteroskedasticity. Econometrica, 48(4), 817-838.