Hedge Accounting in the Brazilian Stock Market: Effects on the
Quality of Accounting Information, Disclosure, and Information
Asymmetry*
Silas Adolfo Potin
Universidade Federal do Espírito Santo, Centro de Ciências Jurídicas e Econômicas, Departamento de Ciências Contábeis, Vitória, ES, Brazil
Patrícia Maria Bortolon
Universidade Federal do Espírito Santo, Centro de Ciências Jurídicas e Econômicas, Departamento de Ciências Contábeis, Vitória, ES, Brazil
Alfredo Sarlo Neto
Universidade Federal do Espírito Santo, Centro de Ciências Jurídicas e Econômicas, Departamento de Ciências Contábeis, Vitória, ES, Brazil
Received on 08.24.2015 – Desk acceptance on 09.11.2015 – 2nd version approved on 03.01.2016.
ABSTRACT
This paper investigates, in the Brazilian stock market, the effect of hedge accounting on the quality of financial information, on the disclosure of derivative financial instruments, and on the information asymmetry. To measure the quality of accounting information, relevance metrics of accounting information and book earnings informativeness were used. For executing this research, a general sam-ple was obtained through Brazilian companies, non-financial, listed on the Brazilian Securities, Commodities, and Futures Exchange (BM&FBOVESPA), comprising the 150 companies with highest market value on 01/01/2014. Through the general sample, samples were compiled for applying the econometric models of value relevance, informativeness, disclosure, and information asymmetry. The sam-ple for relevance had 758 companies-years observations within the period from 2008 to 2013; the samsam-ple for informativeness had 701 companies-years observations with the period from 2008 to 2013; the sample for disclosure had 100 companies-years observations, within the period from 2011 to 2012; the sample for information asymmetry had 100 companies-years observations, also related to the period from 2011 to 2012. In addition to the econometric models, the propensity score matching method was applied to the analyses of the hedge accounting effect on disclosure and information asymmetry. The evidence found for the influence of hedge accounting indicates a rela-tion: (i) positive and significant concerning accounting information relevance and disclosure of derivatives; (ii) negative and significant for book earnings informativeness. Regarding information asymmetry, although the coefficients showed up as expected, they were not statistically significant.
Keywords:hedge accounting, relevance, informativeness, disclosure, information asymmetry.
1 INTRODUCTION
ined as the association between share price and accoun-ting information disclosed, as measured by the slope coeicient that relates earnings and stock price return (Francis, Olsson, & Schipper, 2006).
In Brazil, recent cases showing potential outcomes of adopting HA arouse the market’s attention to this type of mechanism. In the second 2013 quarterly re-port, PETROBRAS announced the adoption of HA for its exports. Adherence to this methodology allowed the withdrawal of R$ 7.98 billion in inancial losses from the outcome, reversing a loss of R$ 1.3 billion and registe-ring a R$ 6.2 billion proit (Viri, 2013).
hus, we notice that the HA has an outstanding re-levance both for the market and the academy. Consi-dering this, in order to increase understanding on the usefulness of accounting information for the Brazilian market, this study aims to investigate the efect of hedge accounting in the quality of inancial information dis-closed by non-inancial companies listed on the Brazi-lian Securities, Commodities, and Futures Exchange (BM&FBOVESPA) and check its inluence on the dis-closure level and information asymmetry.
Since in the current literature there is no consensus metrics for measuring the quality of accounting infor-mation, many researchers made use of models that cap-ture various accounting properties, such as: relevance, outcomes management, conservatism, earnings infor-mativeness, and timing (Wang, 2006; Lopes, 2009; Al-meida, 2010). In this research, the quality of accounting information will be measured by the accounting infor-mation relevance and book earnings informativeness.
hus, to achieve the research goal, hypotheses were developed having the reviewed theory as a basis, which relate aspects of accounting information and HA, name-ly:
H1 – HA has a positive inluence on the accounting information relevance;
H2 – HA has a positive inluence on book earnings informativeness;
H3 – HA is positively related to a higher level of dis-closure of derivative inancial instruments;
H4 – HA is negatively related to information asym-metry.
his article seeks to contribute to the existing litera-ture by increasing knowledge on the application of HA by Brazilian companies traded on the BM&FBOVESPA, a theme which remains largely unexplored by the studies carried out in Brazil. In this way, the work conducted herein shows evidence that contribute to grasp the in-luence of HA on the quality of accounting information, disclosure of derivatives, and information asymmetry in the Brazilian market.
In Brazil, according to the movement to harmonize with the international accounting standards, the Brazi-lian Accounting Pronouncements Committee (CPC) is-sued, in the end of 2008, the CPC 14, subsequently repla-ced by the CPCs 38, 39, and 40, which deal with inancial instruments. In addition to regulate accounting for such instruments, making them balance sheet items, the ac-counting standards mentioned above establish condi-tions so that corporacondi-tions can qualify for hedge accoun-ting (HA). However, these standards are not mandatory and provide entities with the possibility of adopting this methodology.
For qualifying to HA, a company should formally de-signate the relationship between the hedged object and the hedging instrument, as well as complying with many other criteria set by the standard. However, when a com-pany hires a hedge derivative and it does not designate the HA, the outcome of variation in the fair value of this derivative directly impacts the company’s outcome in the period. he volatility derived from variation in the fair value of derivatives may incur in an excessive volati-lity with regard to the accounting outcome, which could not adequately relect the underlying economic funda-mentals and, as a consequence, distort managers’ deci-sion (Plantin, Sapra, & Shin, 2008; Chen, Tan, & Wang, 2013).
he incentive for companies to take HA consists in the possibility to compare the outcome of the hedging instrument to the result of the hedged object, by res-pecting the principle of competence (Pirchegger, 2006). hus, HA was created to be a beneit to businesses, by avoiding increased volatility of earnings associated with fair value accounting (Hughen, 2010).
According to the theoretical model developed by DeMarzo and Duie (1995) and supported by empirical evidence provided by Dadalt, Gay and Nam (2002), hed-ging activities and, as a consequence, HA contribute to reduce information asymmetry and agency costs. hus, companies that use hedge tend to decrease agency costs, allowing the market to assign prices closer to values inherent to its stocks, reducing the mispricing of shares and increasing both the predictability of cash lows and earnings, as well as analysts’ accuracy (Lin, Pantzalis, & Park, 2010; Panaretou, Shackleton, & Taylor, 2013).
de-2.1 Derivative Financial Instruments and Hedge
Accounting
According to Amaral (2003), derivatives are inancial instruments derived from other assets or contracts negotia-ted between the parties and traded on a secondary market, and the most common types are forward contracts, futures contracts, purchase (call) and sale (put) options, and swap contracts. he author also points out that these instruments allow the transfer of risks, market or credit risk, between those who seek protection (hedgers) and speculators.
According to the CPC 38 (2009), derivatives are inan-cial instruments or other contracts that take three charac-teristics, namely: (i) value changes due to certain variables (interest rate, exchange rate, prices, commodities, among others); (ii) there is no need for an initial net investment or an investment lower than that required for other types of contract; and (iii) it is settled at a future date.
Darós and Borba (2005) highlight that the derivative inancial instruments have become a signiicant strategic component of corporate risk management. Given the risks arising from price luctuations, interest rates, exchange rate variations, or also other variations that afect the value of assets or future cash low, companies use derivatives as a protection means (hedge) in relation to these risks (Lopes, Galdi, & Lima, 2009).
In the literature, the use of derivatives and corporate hedging activities has been investigated from various pers-pectives. Many of these studies are based on the relaxation of the proposition I by Modigliani and Miller (1958) and seek to correlate the hedging activities to the irm value. Accor-ding to the paradigm by Modigliani and Miller (1958), con-sidering a perfect, frictionless, market, corporate hedging activities might be irrelevant, since the shareholders would reduce risks by diversifying their portfolios.
However, Stulz (1984) highlights that, in a more realis-tic scenario, with the presence of market frictions, although external shareholders can diversify their portfolios, mana-gers cannot do the same. hus, the author points out that the company hedging activity is a consequence of risk aversion on the part of managers.
From the perspective of internal users of accounting in-formation, in an empirical study, Chen et al. (2013) provide evidence that, despite substantial economic beneits, many managers eschew hedging certain risks due to concerns about the accounting impact of fair value. According to the authors, this efect is magniied when the volatility of the hedged object price is higher, when the hedging activity mi-ght be paradoxically justiied.
HA, whose adoption is allowed to companies by the ac-counting standards, aims to apply the competence basis to the gain and loss of variations at fair value of hedging ins-truments and the hedged object, so that these variations are simultaneously recognized in the iscal year outcome (Pir-chegger, 2006). hus, this methodology aims to relect the economic substance of the transaction, in order to solve the
issue of comparing the existing results concerning the use of derivatives (Lopes et al., 2009).
In Brazil, in a recent paper, Silva (2014) investigated the relation between the adoption of HA and the cost of equity in Brazilian listed companies, in addition to admi-nistration incentives to adopt HA. he indings of this au-thor indicate: (i) strong evidence that the adoption of HA resulted in decreased volatility of accounting outcomes; (ii) strong negative association between the cost of equity and inancial instruments designated for HA; and (iii) positive probability ratio of adopting HA with funding abroad, re-turn on assets, revenue in foreign currency, company size, investments abroad, indebtedness level, and with companies issuing American depositary receipts (ADRs) or a inancial institution.
2.2 Quality of Accounting Information
In the end of the 1960s, the seminal papers by Ball and Brown (1968) and Beaver (1968) mark the beginning of a new perspective and a new ield of study in accounting re-search, known as information approach. According to Lopes (2002, p. 20), “the information approach thinks of accoun-ting in its role as provider of information for economic agents.” hus, a number of accounting studies were conduc-ted by using capital market responses to reporconduc-ted earnings to infer the quality of accounting information (Dechow, Ge, & Schrand, 2010). hese studies are structured according to the positive theory of accounting approach, where statistical models seek to measure, through the information approach, the association between accounting and market variables (Watts & Zimmerman, 1986).
Almeida (2010) highlights that many users of accoun-ting information have diferent speciic demands. However, meeting every demand might entail a high cost for prepa-ring and disclosing such information. hus, the agencies responsible for issuing pronouncements – such as the CPC – recommend that the accounting information produced and disseminated meet the largest number of general users possible.
As already mentioned, in the current literature there is no consensus metrics for measuring the quality of accounting information. hus, many researchers resorted to models that capture various accounting properties, such as: relevance, results management, conservatism, earnings informative-ness, and timing (Wang, 2006; Lopes, 2009; Almeida, 2010). In this study, the quality of accounting information will be analyzed from the perspective of accounting information relevance and earnings informativeness.
2.2.1 Accounting information relevance.
the predictability of future cash lows (Lopes & Martins, 2012). By using market reaction to measure the inluence of accounting statements to aid its users to predict companies’ future cash lows, accounting information relevance is close-ly related to the concept of quality of earnings (Scott, 2011). Since accounting information relevance consists in the predictability of future outcomes (Lopes & Martins, 2012), Panaretou et al. (2013) show the accounting information relevance present in HA. Measuring the error dispersion of analysts’ forecasts for companies’ earnings, the authors ar-gue that HA inluences the predictability of companies’ ou-tcomes, making them more predictable in companies that adopted HA. Also according to the authors, information coming from HA provide market analysts with greater accu-racy in their analysis and forecasts.
2.2.2 Book earnings informativeness.
In an eicient market scenario, share prices vary in rela-tion to the expectarela-tions of generating cash low and future earnings (Francis et al., 2006). hus, considering an eicient market, stock returns should vary with the same intensity and direction than book earnings (Beaver, Clarke, & Wright, 1979).
Although the impact of disclosing book earnings on the book share prices has been identiied by several studies, their results did not show a perfect correlation, i.e. though varying in the same direction, share prices and proits do not vary on the same scale (Sarlo Neto, Galdi, & Dalmácio, 2009). Several studies have analyzed various variables that inluence this relation; among them, we may mention Free-man (1987), Collins and Kothari (1989), Dhaliwal, Lee and Fargher (1991), and Vafeas (2000), which showed the rela-tion between earnings and irm size, growth opportunity,
leverage, and the structure of the board of directors.
he hedge information content is addressed by DeMarzo and Duie (1995), who highlight that adopting hedge poli-cies increases earnings informativeness and this happens to be used by shareholders as a way to measure management ability, as well as the quality of investment concerning cove-rage of risks.
2.3 Information Asymmetry and Hedge
Accounting
he Agency heory, according to Jensen and Meckling (1976), predicts that managers do not always act towards the best interest of shareholders. In markets having a con-centrated ownership structure, the most prominent agency conlict takes place in the relation between controlling sha-reholders and non-controlling shasha-reholders (La Porta, Lo-pez-de-Silanes, Shleifer, & Vishny, 2000).
Accounting is a mechanism that allows assessing mana-gement performance and capacity, contributing to reduce information asymmetry (Bushman & Smith, 2001; Healy & Palepu, 2001).
Considering the information asymmetry between sha-reholders and managers, above all concerning the origin and magnitude of risks that companies face, DeMarzo and Du-ie (1995) highlight that companDu-ies practice hedging based on private information that cannot be provided to sharehol-ders free of any aggregate cost. he authors also stress that, when a hedging activity takes place and hedge positions are disclosed, risks that may interfere with company’s earnings become better known, above all regarding company’s expo-sure, decreasing information asymmetry about company’s outcomes.
3 METHODOLOGY
3.1 Samples
he population consists in the companies traded on the BM&FBOVESPA. To constitute the sample, the po-pulation was arranged in descending size order, on the base date December 30, 2013. hereater, the
identiica-tion process of adopting or not HA began; it was found that, ater the 150th company, the incidence of adopting
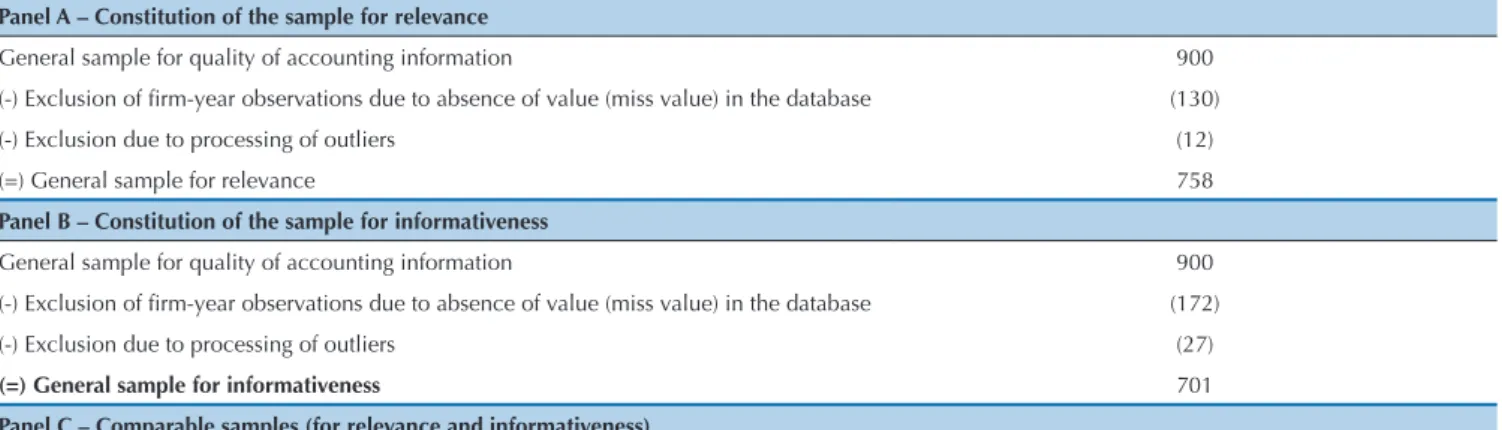
HA decreased considerably, a factor that determined the selection threshold. Table 1 illustrates the selection proce-dures of each sample.
Table 1 Constitution of the final samples for quality of accounting information
Panel A – Constitution of the sample for relevance
General sample for quality of accounting information 900
(-) Exclusion of irm-year observations due to absence of value (miss value) in the database (130) (-) Exclusion due to processing of outliers (12) (=) General sample for relevance 758
Panel B – Constitution of the sample for informativeness
General sample for quality of accounting information 900
(-) Exclusion of irm-year observations due to absence of value (miss value) in the database (172) (-) Exclusion due to processing of outliers (27)
(=) General sample for informativeness 701
Panel C – Comparable samples (for relevance and informativeness)
Considering the indings by Silva (2014), which in-dicate that the probability of adopting HA is positively associated with obtaining resources abroad, revenues in foreign currency, company size, among others, the sam-ples highlighted in Panels A and B of Table 1 may fail to provide an analysis of the efects of HA on the quality of accounting information, but they provide information on the accounting complexity inherent to large companies. hus, samples of comparable companies were created, searching, for each irm-year observation of a company that adopted HA, its counterfactual, i.e. a irm-year ob-servation of a company that did not adopt HA and had a similar size measured by total assets. hus, the compara-ble sample for relevance had 350 irm-year observations, 175 with HA and 175 without HA; the comparable sam-ple for informativeness had 326 irm-year observations, 163 with HA and 163 without HA.
he sample for analyzing the efect of HA on the dis-closure level of derivatives consisted of the 50 largest companies that operated with derivative inancial
instru-ments in the iscal years 2011 and 2012, totaling 100 ir-ms-years. Limiting to the top 50 is justiied by the exten-sive manual collection and the need that they operated with derivatives in the two years observed. he sample resorted to 48 irm-year observations regarding the use of HA and 62 irm-year observations without HA.
he sample used to investigate the efects of HA on information asymmetry was based on the same 50 com-panies analyzed in the sample for disclosure. hus, the companies not followed up by market analysts were ex-cluded, or those accompanied by only one analyst. hus, the sample consisted in 66 observations of 33 companies.
3.2 Relevance Model Description
he value relevance model aims to analyze change in the expectation of economic agents, regarding future outcomes, through the information content of reported book igures (Barth et al., 2001; Lopes & Martins, 2012).
he model for relevance used in this research consists in adapting the model proposed by Ohlson (1995): Source: Prepared by the author.
Sample of comparable observations – Informativeness 326
Panel D – Constitution of the sample for disclosure and information asymmetry
Sample for disclosure 100
Sample for information asymmetry 66
Tabela 1 Cont.
AMV M1
i,t = β0 + β1AEQi,t + β2ANEi,t + εi,t
Where:
AMVi,t is the market value of company i in year t, adjus-ted to market value in t-1;
AEQi,t is the equity of company i in year t, adjusted to market value in t-1;
ANEi,t is the net earnings of company i in year t, adjusted to market value in t-1.
hus, we added the variable that relects the use of HA, the variables of interaction and the variables of control, as represented by the equation:
M2
AMVi,t = β0 + β1AEQi,t + β2ANEi,t + β3DHAi,t + β4AEQi,t * DHAi,t + β5ANEi,t * DHAi,t + γ
∑
nControli,t + εi,tn
Where:
AMVi,tis the market value of company i in year t, ad-justed to market value in t-1;
AEQi,t is the equity of company i in year t, adjusted to market value in t-1;
ANEi,t is the net earnings of company i in year t, adjus-ted to market value in t-1;
DHAi,t is the dummy variable that takes value 1 when company i used HA in year t, otherwise, it takes value 0;
Controli,t are the control variables of company i in year
t, and this model controls size, growth opportunity, and leverage.
For the model for relevance, it is expected that the co-eicients of interest, β3, β4, and β5, are positive and signi-icant.
3.3 Informativeness Model Description
he informativeness model is usually speciied in an equation where return on share is taken as dependent va-riable and net income as an explanatory vava-riable (Easton & Harris, 1991). his model seeks to measure market re-action in face of book earnings disclosure.
Where:
Ri,t is the return on share of company i in period t; NEi,t is the net earnings of company i in period t. In accordance with the procedures performed by Sarlo Neto, Lopes and Dalmácio (2010), Sarlo Neto, Bassi and Almeida (2011), Brugni, Sarlo Neto,
Bastia-nello and Paris (2012), Yokoyama, Baioco, Rodrigues Sobrinho and Sarlo Neto (2015), the original model by Easton and Harris (1991) added the variable that reflects the use of HA, the variable of interaction and the variables of control, as represented by the equa-tion:
Where:
RSi,tis the excessive return on share of company i in year t in relation to the IBOVESPA;
ANEi,t is the net earnings of company i in year t, adjusted to market value in t-1;
DHAi,t is the dummy variable that takes value 1 when com-pany i used HA in year t, otherwise, it takes value 0.
Controli,t are the control variables of company i in year t, and this model controls size, growth opportunity, and leverage.
It is expected that β3 is positive and signiicant, something which shows that HA has a positive inluence on book earnin-gs informativeness.
3.4 Disclosure Model Description
Considering the use of derivatives and HA, scholars em-pirically investigated whether HA reduces information asym-metry. he disclosure level of derivatives was evaluated by the DDI (described in item 3.6), which is taken as the dependent variable. he control variables were added with size, leverage, stock market liquidity, corporate governance, and ADR, based on variables that the literature identiies as critical to the dis-closure level (Lanzana, 2004; Alencar, 2005; Murcia & Santos, 2009).
Determinants of the disclosure level were evaluated, accor-ding to the following model:
Ri,t = β0 + β1.NEi,t + εi,t M3
M4
RSi,t = β0 + β1ANEi,t + β2DHAi,t + β3ANEi,t * DHAi,t + γ
∑
nControli,t + εi,tn
DAFAi,t = β0 + β1DDIi,t + γ
∑
nControli,t + εi,t M6n
M5
DDIi,t = β0 + β1SIZEi,t + β2LEVi,t + β3LIQi,t + β4DGOVi,t + β5DADRi,t + β6DHAi,t + εi,t
Where:
DDIi,t is the derivatives disclosure indicator of com-pany i in year t;
SIZEi,t is the proxy for company size i in year t; LEVi,t is the leverage of company i in year t;
LIQi,t is the stock market liquidity of company i in year t;
DGOVi,t is the dummy variable that takes value 1 for companies adhering to one of the different listing seg-ments of the BM&FBOVESPA, i.e. segseg-ments Level 1, Le-vel 2, or New Market;
DADRi,t is the dummy variable that takes value 1 if company i traded ADRs year t, otherwise, it takes value 0;
DHAi,t is the dummy variable that takes value 1 when
company i used HA in year t, otherwise, it takes value 0. It is expected that β6 is positive and significant. If this comes true, it will evidence that HA has a positive in-fluence on the disclosure level of derivatives.
3.5 Information Asymmetry Model Description
If the expected β6 coefficient for the disclosure mo-del (M5) is confirmed, the equation M6 will be used to test whether HA reduces information asymmetry con-cerning the use of derivatives. In this model, the dis-persion variable of analysts’ forecasts (DAFAi,t) is taken as a proxy for information asymmetry, in a procedure similar to that in Dadalt et al. (2002). Thus, DAFAi,t is regressed against DDIi,t and the other control variables, according to the equation:
Where:
DAFAi,t is the dispersion of the average forecast of analysts following company i in year t;
DDIi,t is the derivatives disclosure indicator of company i
in year t;
3.6 Construction of the Derivatives Disclosure
Indicator
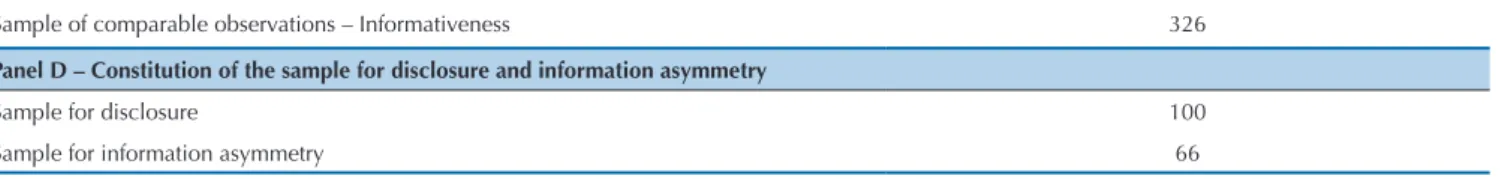
To measure the disclosure level of derivative inancial ins-truments, the “Derivatives Disclosure Indicator” (DDI) was
constructed, consisting of issues prepared by having the CPC 40(R1) as a basis, assigning 1 for compliance with the stan-dard and 0 for non-compliance with it. he list of issues in the DDI is provided in Table 2.
Table 2 Metrics for a derivatives disclosure index
Table 3 Results of regressions in the relevance model
Indicator Name Regulation CPC 40(R1)
1 Book value of each category. Item 8, paragraphs “a” to “f.”
2 Value of variation at fair value. Items 9 and 10. 3 Exposure to risk. Item 33, paragraph “a.”
4 Objectives, policies, and processes. Item 33, paragraph “b.”
5 Risk measurement method. Item 33, paragraph “b.”
6 Summary of quantitative data about exposure to each risk. Item 34. 7 The company should disclose the analysis of sensitivity to risks. Items 40 and 41.
8 Unfolding of outcomes and equity in the possible scenarios of changes in relevant risks.
Items 40 and 41.
9 Methods and assumptions of the analysis. Items 40 and 41.
10 Net outcome from operations with derivatives. Item 20.
11 Maturity schedule. Item 39.
12 Counterpart. Item 34, paragraph “c” and B8.
General sample for relevance
General sample for relevance
Sample with comparable elements for relevance
Variables
M1 – Original model M2 – Adapted model M2 – Adapted model
Coefficient (Robust standard error)
Coefficient (Robust standard error)
Coefficient (Robust standard error)
AEQi,t 1.486*** 1.626*** 1.316***
(0.144) (0.169) (0.188)
Source: Prepared by the author.
3.7 Propensity Score Matching
In addition to the study to investigate the inluence of HA on disclosure and information asymmetry, through regressions, as highlighted in sections 3.4 and 3.5, this research will also resort to the propensity score matching technique, known as PSM, in order to investigate the cau-sal efect of HA on disclosure and information asymme-try.
Propensity score is the conditional probability of ex-posure to some treatment, given a vector of observed covariables (Rosenbaum & Rubin, 1983). To identify the causal efect, however, a problem may be caused. he outcome variable to analyze the causal efect – for this research we have DDI and DAFA – it is observed, in a year i, by one or another case where the company has or does not have HA, but it is never seen in both cases for the same company in a given year i. It is understood that, according to the counterfactual theory of causation, the
ideal might be to analyze the same company in similar contexts, but difering only in the treatment circumstan-ce, in this case having HA or not.
Considering the impossibility of this format, the cau-sal efect is estimated by the average treatment efect when comparing a set of observations with statistically identical observable features, distinguished by treatment, wherein a series comprises the treatment group and the other does not, in a sample where companies are ran-domly assigned to treatment.
A solution to the problem described above is using the Propensity Score heorem, proposed by Rosenbaum and Rubin (1983). hrough this theorem, the correspondence between companies is obtained by means of a propen-sity score, derived from a function of all the observable features that could potentially afect the adoption of HA by a company; the propensity score may be obtained by ainity models (logit or probit).
4 DATA ANALYSIS AND RESEARCH RESULTS
4.1 Analysis of Relevance and Informativeness
To estimate the efects of HA on the relevance of in-formation, we used the multiple regression technique with panel data and ixed efects approach, following the
Table 3 Cont.
ANEi,t
1.091** 1.061* -0.0729
(0.460) (0.603) (0.686)
DHAi,t
0.210* -0.227
(0.115) (0.140)
AEQi,t*DHAi,t
-0.336** -0.0162
(0.148) (0.138)
ANEi,t*DHAi,t
0.0743 1.364**
(0.549) (0.663)
Constant 0.142* 1.331 3.621**
(0.0830) (1.181) (1.663)
SIZEi,t
-0.114 -0.250**
(0.0829) (0.105)
MTBi,t
0.00412 0.220***
(0.00620) (0.0661)
LEVi,t
0.880** 0.336
(0.412) (0.396)
N Obs. 758 758 350
R² 0.515 0.534 0.685
Adjusted R² 0.513 0.529 0.678
Stat. F 97.87 49.67 57.88
Prov > F 0.000 0.000 0.000
Note.AMVi,t – market value of company i in year t, adjusted to market value in t-1; AEQi,t – equity of company i in year t, adjusted to market value in t-1; ANEi,t – net
earnings of company i in year t, adjusted to market value in t-1; DHAi,t – dummy variable that takes value 1 when company i used HA in year t, otherwise, it takes
value 0; AEQi,t * DHAi,t – interaction between the dummy of HA and AEQ; ANEi,t * DHAi,t – interaction between the dummy of HA and ANE; SIZEi,t– proxy for size of
company i in year t; MTBi,t – proxy for growth opportunity of company i in year t; LEVi,t – proxy for leverage of company i in year t; ***,**,*, significant at 1%, 5%, and
10%, respectively.
Source: Prepared by the author.
According to Table 3, when analyzing the sample for relevance, it is observed that the slope coefficient of interaction between ANE and DHA is positive, but not significant. In turn, the interaction between AEQ and DHA is significant at 5% and it has a negative slope. This denotes that HA has a negative effect on the relevance of equity. This result is contrary to what is expected and highlighted by the theoretical framework. This eviden-ce also refers to the issue that the results for this sam-ple may be picking up several other factors, such as the complexity of accounting inherent to large companies.
In this occasion, there was an analysis of a sample with comparable observations, looking for each firm--year observation of a company that adopted HA its counterfactual, i.e. a firm-year observation of a com-pany that did not adopt HA and had a similar size mea-sured by total assets. For the aforementioned results, it is observed that the slope coefficient of the interaction
between AEQ and DHA is negative, but not significant. In turn, the interaction between ANE and DHA is sig-nificant at 5% and it has a positive slope. Corroborating the reviewed theory, this evidence converges to the un-derstanding that HA has a positive effect on the relevan-ce of net earnings. Thus, HA, by enable the comparison by competence of the hedging instrument to the hed-ged object in the company outcome, allows the market to recognize information in the disclosed outcomes of companies.
Based on the results obtained from the relevance model, for the comparable sample for relevance, aligned to the expected results, H1 is not rejected.
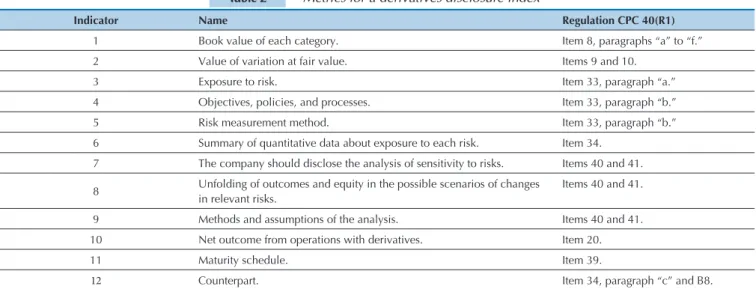
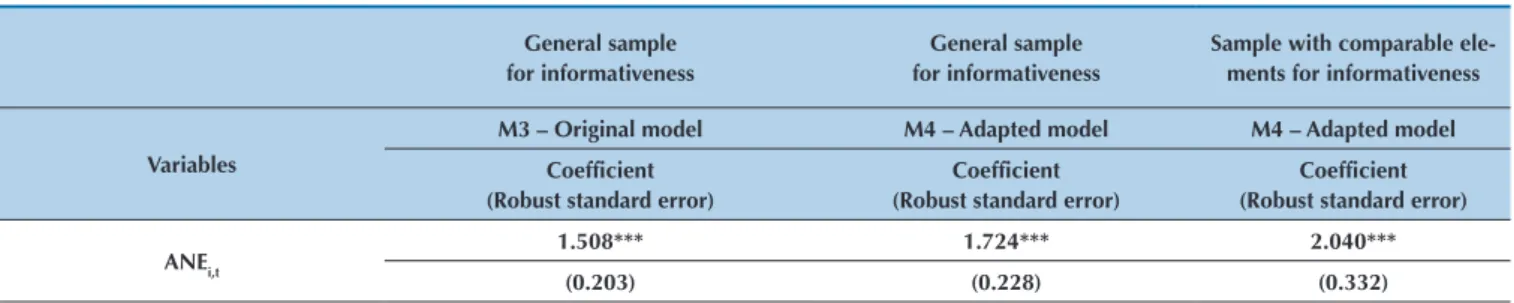
Table 4 displays the results of regressions of the ori-ginal model (M3) and the informativeness model used in this research (M4) for the sample for informativeness, and regression of the model M4 for the sample with comparable elements for informativeness.
Table 4 Results of regressions of the informativeness model
General sample for informativeness
General sample for informativeness
Sample with comparable ele-ments for informativeness
Variables
M3 – Original model M4 – Adapted model M4 – Adapted model
Coefficient (Robust standard error)
Coefficient (Robust standard error)
Coefficient (Robust standard error)
ANEi,t
1.508*** 1.724*** 2.040***
Note.RSi,t – excessive return of company i in year t in relation to the IBOVESPA; ANEi,t– net earnings of company i in year t, adjusted to market value in t-1; DHAi,t
– dummy variable that takes value 1 when company i used HA in year t, otherwise, it takes value 0; ANEi,t * DHAi,t– interaction between the dummy of HA and ANP;
SIZEi,t – proxy for the size of company i in year t; MTBi,t – proxy for the growth opportunity of company i in year t; LEVi,t – proxy for the leverage of company i in year t;
***,**,*, significant at 1%, 5%, and 10%, respectively. Source: Prepared by the author.
Tabela 4 Resultados das regressões do modelo de informatividade
DHAi,t
0.0898** 0.0874*
(0.0421) (0.0462)
ANEi,t*DHAi,t
-0.866** -1.148**
(0.417) (0.482)
Constant 0.00605 0.252 0.424**
(0.0207) (0.161) (0.203)
SIZEi,t -0.0138 -0.0259**
(0.0106) (0.0120)
MTBi,t 0.0167*** 0.0169***
(0.00474) (0.00521)
LEVi,t -0.197*** -0.149
(0.0750) (0.101)
N Obs. 701 701 326
R² 0.102 0.169 0.202
Adjusted R² 0.101 0.162 0.187
Stat. F 55.14 14.65 10.51
Prob > F 0.000 0.000 0.000
The model results, displayed in Table 4, show that both for the sample for informativeness and for the sam-ple with comparable elements, the estimated coefficient of the interactive variable between adjusted net earnings and the dummy for HA (ANEi,t* DHAi,t) was negative and significant at 5%. These results show that HA has a negative influence on book earnings informativeness.
According to the H2 test, we see that the results found are opposite to expectations and contrary to the theory referred to by DeMarzo and Duffie (1995). Thus, both the general sample and the sample of comparable ele-ments reject the hypothesis H2.
The results obtained for the study samples concer-ning informativeness show that, in the Brazilian stock
market, HA reduces disclosed book earnings informati-veness. Thus, we may assume that the market is antici-pating information on the book outcomes of companies that have HA. Considering the increased production of private information (predisclosure) for companies that adopt HA, which tend to be followed up by analysts on a closer basis (Panaretou et al., 2013), the market might be more likely to react with less surprise to accounting disclosure by these companies.
4.2 Disclosure Analysis of Derivatives and
Hedge Accounting
Descriptive statistics of quantitative variables in the disclosure model is provided in Table 5.
Table 5 Descriptive statistics for the disclosure model
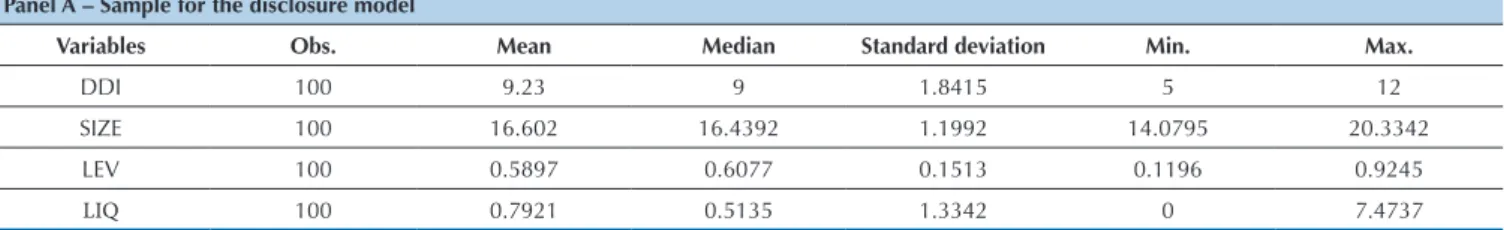
Panel A – Sample for the disclosure model
Variables Obs. Mean Median Standard deviation Min. Max.
DDI 100 9.23 9 1.8415 5 12
SIZE 100 16.602 16.4392 1.1992 14.0795 20.3342 LEV 100 0.5897 0.6077 0.1513 0.1196 0.9245
LIQ 100 0.7921 0.5135 1.3342 0 7.4737
Note.DDIi,t – disclosure indicator of derivatives of company i in year t; SIZEi,t – proxy for size of company i in year t; LEVi,t – proxy for leverage of company i in year t;
LIQi,t – stock market liquidity of company i in year t.
Source: Prepared by the author.
Descriptive analyses for the variable DDI show that companies had a mean score of 9.23, out of a maximum sco-re of 12. his piece of data shows that some companies asco-re
Table 6 Results of regression for the disclosure model
Table 7 Results of the DHA logistic regression – PSM disclosure Variables
M5 – Disclosure model
Coefficient (Robust standard error)
SIZE 0.629***
(0.176)
LEV 0.961
(0.940)
LIQ -0.279**
(0.109)
DGOV 0.0379
(0.362)
DADR 0.222
(0.403)
DHA 0.777**
(0.341)
Constant -2.042
(2.883)
Model Statistics
N Obs. 100
R² 0.235
Adjusted R² 0.186
Stat. F 6.502
Prob > F 0.0000
Variables
Dependent variable = DHA
Coefficient (Standard error)
SIZE 0.4564
(0.3210)
LEV 1.2351
(1.6788)
Note.DDIi,t – derivatives disclosure indicator of company i in year t; SIZE,t – proxy for size of company i in year t; LEVi,t – leverage of company i in year t; LIQi,t – stock
market liquidity of company i in year t; DGOVi,t – dummy variable that takes value 1 for companies adhering to one of the different listing segments Level 1, Level 2,
or New Market in the BM&FBOVESPA; DADRi,t – dummy variable for 1 if company i traded ADRs in year t, otherwise, it takes value 0; DHAi,t – dummy variable for 1
when company i used HA in year t, otherwise, it takes value 0; ***,**,*, significant at 1%, 5%, and 10%, respectively. Source: Prepared by the author.
We observe that, according to the variable SIZE, the estimated value of its coeicient was positive and signi-icant at 1%, indicating that the larger a company size, the higher the score obtained in DDI, resulting in grea-ter adherence to compliance with the CPC 40(R1) and, as a consequence, exerting a positive inluence on reduced information asymmetry, regarding the use of derivati-ves. his evidence is in line with the indings by Lanzana (2004) and Murcia and Santos (2009).
However, by analyzing the variable LIQ, we notice that the estimated value of its coeicient had a negative and signiicant sign at 5%, indicating an inverse relation. hus, it is understood that the higher stock market liquidity of a company, the lower the score assigned to the variable DDI, negatively impacting on compliance with the CPC 40(R1) and, by implication, having a negative impact on redu-cing information asymmetry as for the use of derivatives. his outcome is contrary to the expected by the
disclosu-re theory and the indings by Lanzana (2004). Assessing the relation between disclosure and governance, Lanzana (2004) showed that companies whose shares have higher liquidity tend to have a higher disclosure level. hus, it is possible to conjecture that the results found by Lanzana (2004) may not converge to the disclosure theory related to HA and compliance with the CPC 40(R1).
Nevertheless, it is seen, in Table 6, that the estimated value for the coeicient of the variable of interest in the model (DHA) to test H3 was positive and signiicant at 5%. his result is consistent with the theory, indicating that HA has a positive inluence on the disclosure level of derivatives, pointed out by the DDI. So, non-rejection of the hypothesis H3 becomes clear.
Note.DDIi,t – derivatives disclosure indicator of company i in year t; SIZEi,t – proxy for size of company i in year t;LEVi,t – leverage of company i in year t; LIQi,t – stock
market liquidity of company i in year t; DGOVi,t – dummy variable for 1 for companies adhering to one of the different listing segments Level 1, Level 2, or New Market
in the BM&FBOVESPA; DADRi,t – dummy variable that takes value 1 if company i traded ADRs in year t, otherwise, it takes value 0; DHAi,t – dummy variable for 1
when company i used HA in year t, otherwise, it takes value 0; ATT – average treatment effect on the treated; ***,**,*, significant at 1%, 5%, and 10%, respectively. Source: Prepared by the author.
Note.DAFAi,t – dispersion of analysts’ average forecasts of company i in year t; DDIi,t – derivatives disclosure indicator of company i in year t; SIZEi,t – proxy for size of
company i in year t;LEVi,t – proxy for leverage of company i in year t;LIQi,t – stock market liquidity of company i in year t.
Source: Prepared by the author.
According to Table 7, we notice a positive mean di-fference and statistically significant at 1.2404 in DDI when analyzing companies that adopted and did not adopt HA. However, when providing PSM, we still find a positive difference (0.9167), but not significant, con-sidering statistics t (1.57).
In this occasion, the results demonstrate that HA has a positive impact on adherence to compliance with the CPC 40(R1). One possible explanation for this may be the enforcement generated by meeting the criteria for formal designation in the hedge relation to qualify HA. So, H3 is not rejected.
4.3 Analysis of Information Asymmetry and
Hedge Accounting
As highlighted in the previous section, the enforcement generated by meeting the criteria for designation of HA may be impacting the evidence found. So, the next analy-sis seeks to portray whether higher disclosure – related to companies that operated with HA – resulted in lower in-formation asymmetry. To do this, the dispersion variable of analysts’ average forecasts (DAFA) will be taken as a proxy for information asymmetry.
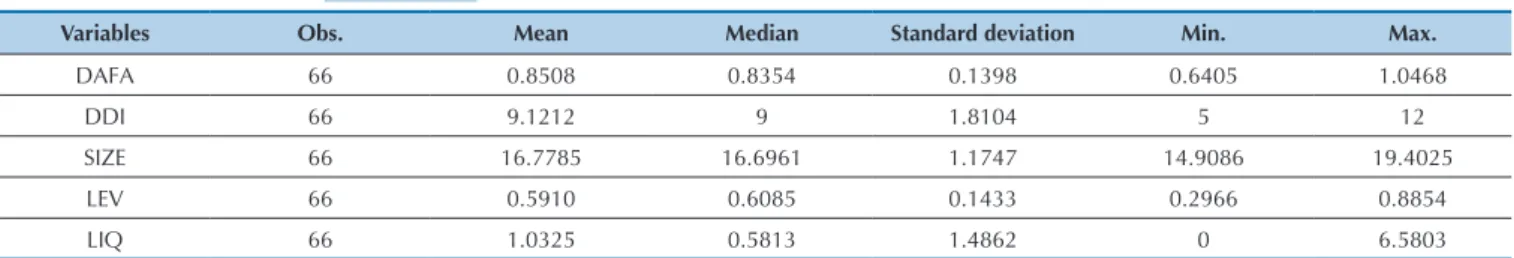
he descriptive statistics of quantitative variables in the model for information asymmetry is provided in Table 8.
Tabela 7 Cont.
Table 8 Descriptive statistics for the information asymmetry model
LIQ 0.4038
(0.4196)
DGOV -0.0959
(0.5630)
DADR 0.8111
(0.5925)
Constant -8.8692*
(5.1173)
Model Statistics
N Obs. 100
Pseudo R² 0.148
LR chi2 20.48
Prob > chi2 0.001
Variable Sample Processed Control Difference Standard error Statistics t
DDI Unmatched 9.8750 8.6346 1.2404 0.3486 3.56
ATT 9.8750 8.9583 0.9167 0.5822 1.57
Variables Obs. Mean Median Standard deviation Min. Max.
DAFA 66 0.8508 0.8354 0.1398 0.6405 1.0468
DDI 66 9.1212 9 1.8104 5 12
SIZE 66 16.7785 16.6961 1.1747 14.9086 19.4025 LEV 66 0.5910 0.6085 0.1433 0.2966 0.8854
LIQ 66 1.0325 0.5813 1.4862 0 6.5803
Based on Table 9, we notice a statistically signiicant relation of the variable leverage (LEV), demonstrating that this is positively associated with the dispersion of analysts’ forecasts. Regarding the variable of interest (DDI), although it has shown the expected sign, indi-cating that the disclosure level reduces the dispersion of analysts’ average forecasts and, by analogy, information
asymmetry, the variable was not statistically signiicant. he dummy variables of governance (DGOV) and ADRs (DADR) were omitted from the model due to collinearity issues with the other variables.
We also sought to investigate the causal efect of HA on information asymmetry. To do this, the PSM method was used. he results are displayed in Table 10.
Variables
M6 – Information Asymmetry Model
Coefficient (Robust standard error)
DDI -0.00836
(0.0199)
SIZE -0.275
(0.197)
LEV 2.331***
(0.725)
LIQ 0.0827
(0.145)
Constant 4.078
(3.024)
Model Statistics
N Obs. 66
R² 0.301
Adjusted R² -0.566
Stat. F 3.125
Prob > F 0.0297
Variables
Dependent variable = DHA Coefficient (Standard error)
SIZE 0.2553
(0.4455)
LEV -1.9360
(2.2027)
LIQ 1.6022**
(0.7879)
DGOV -0.2892
(0.8856)
DADR 1.3632
(0.8546)
Constant -5.0881
(7.2061)
Model Statistics
N Obs. 100
Pseudo R² 0.148
LR chi2 20.48
Prob > chi2 0.001
Table 9 Results of regression for the information asymmetry model
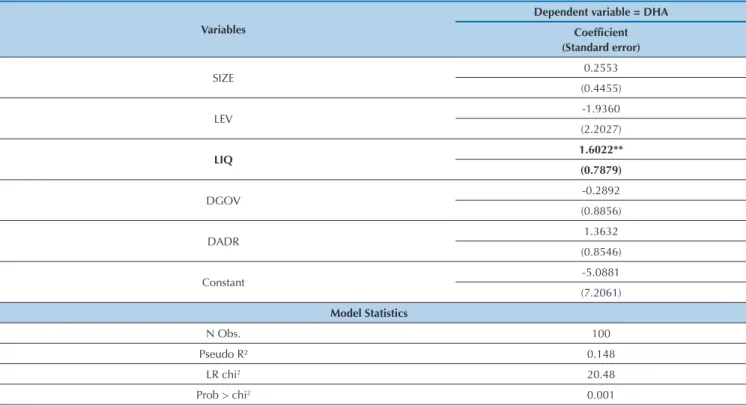
Table 10 Results of the DHA regression logistics – PSM information asymmetry
Note.DDIi,t – derivatives disclosure indicator of company i in year t; SIZEi,t – proxy for size of company i in year t;LEVi,t – leverage of company i in year t; LIQi,t – stock
he results displayed in Table 10 show a negative ave-rage diference, indicating that companies adopting HA had lower average dispersion than those that did not adopt it. However, for both samples, the result was not statistically signiicant.
Regarding the expected results for the model for in-formation asymmetry, it is observed that β1 showed the expected sign (Table 9), but it was not statistically sig-niicant, as well as ATT in PSM (Table 10). hus, for a hypothesis test, there was a rejection to H4.
Note.DDIi,t – derivatives disclosure indicator of company i in year t; SIZEi,t – proxy for size of company i in year t;LEVi,t – leverage of company i in year t; LIQi,t – stock
market liquidity of company i in year t; ATT – average treatment effect on the treated. ***,**,*, significant at 1%, 5%, and 10%, respectively.
Source: Prepared by the author.
Variable Sample Processed Control Difference Standard error Statistics t
DAFA Unmatched 0.8283 0.8663 -0.0381 0.0349 -1.09
ATT 0.8283 0.9218 -0.0935 0.0608 -1.54
Table 10 Cont.
5 FINAL REMARKS
his research aimed to investigate the efect of infor-mational content of HA on quality of accounting informa-tion disclosed by non-inancial companies listed on the BM&FBOVESPA, as well as verify the inluence of HA on the disclosure level of derivative inancial instruments of non-inancial companies listed on the BM&FBOVESPA and, due to that, on information asymmetry.
Empirical evidence was obtained by means of the multivariate technique of multiple regression on panel data, based on: the sample data from 150 non-inancial companies listed on the BM&FBOVESPA, ranked by ma-rket value on December 30, 2013, from 2008 to 2013, for analyzing the quality of accounting information; the sam-ple with data from 50 non-inancial companies listed on the BM&FBOVESPA, ranked by market value on Decem-ber 30, 2013, for the years 2011 and 2012, for analyzing
the disclosure level; and the sample with data from 33 non-inancial companies listed on the BM&FBOVESPA, taken from the sample for disclosure, for the years 2011 and 2012, for analyzing information asymmetry.
In order to achieve the proposed objective, we used econometric models of: information relevance, adapted from the model by Ohlson (1995); book earnings infor-mativeness, adapted from the model by Easton and Harris (1991); disclosure, according to Lanzana (2004), Alencar (2005), and Murcia and Santos (2009) for determining the variables of the model concerned; information asymme-try, according to Dadalt et al. (2002). he PSM method was also used to investigate the impact of HA, in the cau-sal relation, on disclosure and information asymmetry.
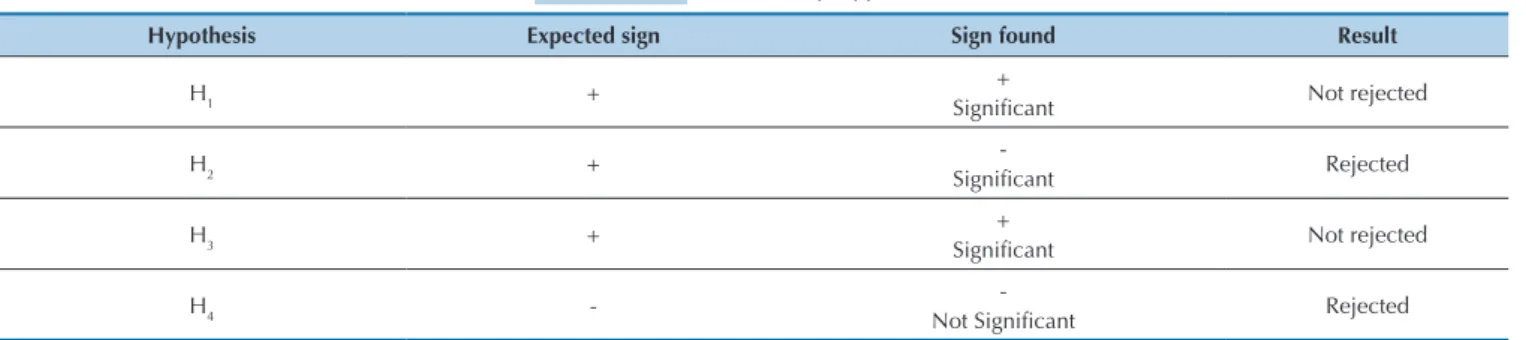
Table 11 presents a summary of the results, according to the research hypotheses.
Source: Prepared by the author.
Table 11 Results by hypotheses
Hypothesis Expected sign Sign found Result
H1 + Signiicant+ Not rejected
H2 +
-
Signiicant Rejected
H3 +
+
Signiicant Not rejected
H4
--
Not Signiicant Rejected
Evidence found – for the influence of HA on quality of accounting information – allows conjecturing that the Brazilian market may be anticipating information on earnings reported by companies or also seeing HA as a earnings management mechanism, rather than risk management. This assumption may be corroborated by the recent cases of large companies that adopted this modality and its consequent results, something which
put the theme HA in vogue in the national scene and led it to be recurrently addressed by specialized media.
volume of information may justify and explain the evi-dence found.
Concerning the evidence found for information asymmetry, the relatively small number of companies analyzed may represent a limitation of this research, given that the resulting low variability may reflect on not significant model coefficients.
The conclusions pointed out in this study are subject to the companies analyzed, in their respective research samples. Thus, extrapolation of the results may lead to uncertain and even untruthful conclusions, something which allows us to suggest further studies with more
explanation on the subject, above all concerning the reassessment of the Brazilian market sensitivity as for the adoption of HA.
Having in mind that the theme HA is still a vast field for studies in the Brazilian literature, we suggest as a future research subject the informational content of hedge from the perspective of other metrics for the quality of accounting information, such as timing, conservatism, and earnings management, or even an expanded study addressing the influence of HA on dis-closure, given the incipience of studies addressing the theme.
References
Alencar, R. C. (2005). Custo do capital próprio e nível de disclosure nas empresas brasileiras. Brazilian Business Review, 2(1), 1-12. Almeida, J. E. F. (2010). Qualidade da informação contábil em ambientes
competitivos (Doctoral hesis). Universidade de São Paulo, São Paulo.
Amaral, C. A. L. V. (2003). Derivativos: o que são e a evolução quanto ao aspecto contábil. Revista Contabilidade & Finanças, 14(32), 71-80. Ball, R., & Brown, P. (1968). An empirical evaluation of accounting
income numbers. Journal of Accounting Research, 6(2), 159-178. Barth, M. E., Beaver, W. H., & Landsman, W. R. (2001). he relevance
of the value relevance literature for inancial accounting standard setting: another view. Journal of Accounting and Economics, 31(1), 77-104.
Beaver, W. H. (1968). he information content of annual earnings announcements. Journal of Accounting Research, 67-92.
Beaver, W. H., Clarke, R., & Wright, W. F. (1979). he association between unsystematic security returns and the magnitude of earnings forecast errors. Journal of accounting research, 316-340.
Brugni, T. V., Sarlo Neto, A., Bastianello, R. F., & Paris, P. K. S. (2012). Inluência de dividendos sobre a informatividade dos lucros: evidências empíricas na BM&FBOVESPA. Revista Universo Contábil, 8(3), 82-99.
Bushman, R. M., & Smith, A. J. (2001). Financial accounting information and corporate governance. Journal of Accounting and Economics, 32(1-3), 237-333. Retrieved from http://doi.org/10.1016/S0165-4101(01)00027-1
Chen, W., Tan, H. T., & Wang, E. Y. (2013). Fair value accounting and managers’ hedging decisions. Journal of Accounting Research, 51(1), 67-103. Retrieved from http://doi.org/10.1111/j.1475-679X.2012.00468.x
Collins, D. W., & Kothari, S. P. (1989). An analysis of intertemporal and cross-sectional determinants of earnings response coeicients.
Journal of Accounting and Economics, 11(2-3), 143-181. Retrieved
from http://doi.org/10.1016/0165-4101(89)90004-9 CPC 38 (2009). Pronunciamento Técnico. CPC 38 – Instrumentos
Financeiros: Reconhecimento e Mensuração.
Dadalt, P., Gay, G. D., & Nam, J. (2002). Asymmetric information and corporate derivatives use. Journal of Futures Markets, 22(3), 241-267. Darós, L. L., & Borba, J. A. (2005). Evidenciação de instrumentos
inanceiros derivativos nas demonstrações contábeis: uma análise das empresas brasileiras. Revista Contabilidade & Finanças, 16(39), 68-80. Dechow, P., Ge, W., & Schrand, C. (2010). Understanding earnings quality:
A review of the proxies, their determinants and their consequences.
Journal of Accounting and Economics, 50(2-3), 344-401. Retrieved
from http://doi.org/10.1016/j.jacceco.2010.09.001
DeMarzo, P. M., & Duie, D. (1995). Corporate incentives for hedging and hedge accounting. Review of Financial Studies, 8(3), 743-771. Retrieved from http://doi.org/10.1093/rfs/8.3.743
Dhaliwal, D. S., Lee, K. J., & Fargher, N. L. (1991). he association between unexpected earnings and abnormal security returns in the presence of inancial leverage. Contemporary Accounting Research, 8(1), 20-41. Retrieved from http://doi.org/10.1111/j.1911-3846.1991. tb00832.x
Easton, P. D., & Harris, T. S. (1991). Earnings as an explanatory variable for returns. Journal of Accounting Research, 19-36.
Francis, J., Olsson, P., & Schipper, K. (2006). Earnings Quality.
Foundations and Trends in Accounting 1(4), 259-340. Retrieved from
http://dx.doi.org/10.1561/1400000004
Freeman, R. N. (1987). he association between accounting earnings and security returns for large and small irms. Journal of Accounting
and Economics, 9(2), 195-228. Retrieved from http://doi.
org/10.1016/0165-4101(87)90005-X
Healy, P. M., & Palepu, K. G. (2001). Information asymmetry, corporate disclosure, and the capital markets: a review of the empirical disclosure literature. Journal of Accounting and Economics, 31(1), 405-440.
Hughen, L. (2010). When do accounting earnings matter more than economic earnings? Evidence from hedge accounting restatements.
Journal of Business Finance & Accounting, 37(9-10), 1027-1056. Retrieved from http://doi.org/10.1111/j.1468-5957.2010.02216.x Jensen, M. C., & Meckling, W. H. (1976). heory of the irm: Managerial
behavior, agency costs and ownership structure. Journal of
Financial Economics, 3(4), 305-360. Retrieved from http://doi.
org/10.1016/0304-405X(76)90026-X
La Porta, R., Lopez-de-Silanes, F., Shleifer, A., & Vishny, R. (2000). Investor protection and corporate governance. Journal of inancial economics, 58(1), 3-27.
Lanzana, A. P. (2004). Relação entre disclosure e governança corporativa
das empresas brasileiras (Master's Degree). Universidade de São
Paulo, São Paulo. Retrieved from http://www.teses.usp.br/teses/ disponiveis/12/12139/tde-11022005-094807/pt-br.php
Lin, J. B., Pantzalis, C., & Park, J. C. (2010). Corporate hedging policy and equity mispricing. Financial Review, 45(3), 803-824. Retrieved from http://doi.org/10.1111/j.1540-6288.2010.00272.x
Lopes, A. B. (2002). Informação contábil e o mercado de capitais. São Paulo, SP: homson.
Lopes, A. B. (2009). he relation between irm-speciic corporate governance, cross-listing and the informativeness of accounting
numbers in Brazil (Doctoral hesis). he University of Manchester,
Manchester.
Lopes, A. B., Galdi, F. C., & Lima, I. S. (2009). Manual de contabilidade e tributação de instrumentos inanceiros e derivativos (IAS 39, IAS 32, IFRS 7, CPC 14, minutas do CPC 38, 39 e 40, normas da CVM, do Bacen e da Receita Federal do Brasil). São Paulo, SP: Atlas. Lopes, A. B., & Martins, E. (2012). Teoria da contabilidade: uma nova
abordagem (3. reimpr.). São Paulo, SP: Atlas.
Modigliani, F., & Miller, M. H. (1958). he cost of capital, corporation inance and the theory of investment. he American Economic Review, 48(3), 261-297.
Murcia, F. D. R., & Santos, A. (2009). Fatores determinantes do nível de disclosure voluntário das companhias abertas no Brasil. Revista de
Educação e Pesquisa em Contabilidade, 3(2), 72-95.
Ohlson, J. A. (1995). Earnings, book values, and dividends in equity valuation. Contemporary Accounting Research, 11(2), 661-687. Retrieved from http://doi.org/10.1111/j.1911-3846.1995.tb00461.x Panaretou, A., Shackleton, M. B., & Taylor, P. A. (2013). Corporate risk
management and hedge accounting. Contemporary Accounting
Research, 30(1), 116-139. Retrieved from http://doi.org/10.1111/
Correspondence Address:
Silas Adolfo Potin
Universidade Federal do Espírito Santo, Centro de Ciências Jurídicas e Econômicas Av. Fernando Ferrari, 514 – CEP: 29075-910
Goiabeiras – Vitória – ES Email: [email protected]
Pirchegger, B. (2006). Hedge accounting incentives for cash low hedges of forecasted transactions. European Accounting Review, 15(1), 115-135. Retrieved from http://doi.org/10.1080/09638180500510509 Plantin, G., Sapra, H., & Shin, H. S. (2008). Marking-to-market: Panacea
or Pandora’s box? Journal of Accounting Research, 46(2), 435-460. Retrieved from http://doi.org/10.1111/j.1475-679X.2008.00281.x Rosenbaum, P. R., & Rubin, D. B. (1983). he central role of the propensity
score in observational studies for causal efects. Biometrika, 70(1), 41-55. Retrieved from http://doi.org/10.1093/biomet/70.1.41
Sarlo Neto, A., Bassi, B. R., & Almeida, A. A. (2011). Um estudo sobre a informatividade dos lucros contábeis na América Latina. Revista de
Contabilidade e Organizações, 5(12), 4-25.
Sarlo Neto, A., Galdi, F. C., & Dalmácio, F. Z. (2009). Uma pesquisa sobre o peril das ações brasileiras que reagem à publicação dos resultados contábeis. Revista de Contabilidade e Organizações, 3(6), 22-40. Sarlo Neto, A., Lopes, A. B., & Dalmácio, F. Z. (2010). A inluência
da estrutura de propriedade sobre a informatividade dos lucros contábeis divulgados pelas empresas negociadas na Bovespa. Revista
Base (Administração E Contabilidade) Da UNISINOS, 7(4), 301-314.
Scott, W. R. (2011). Financial accounting theory. Toronto, Canada: Pearson Canada.
Silva, F. C. (2014). Hedge accounting no Brasil (Doctoral hesis).
Universidade de São Paulo, São Paulo.
Stulz, R. M. (1984). Optimal hedging policies. Journal of Financial and
Quantitative Analysis, 19(02), 127-140. Retrieved from http://doi.
org/10.2307/2330894
Vafeas, N. (2000). Board structure and the informativeness of earnings.
Journal of Accounting and Public Policy, 19(2), 139-160. Retrieved
from http://doi.org/10.1016/S0278-4254(00)00006-5
Viri, N. (2013, 09 de agosto). Petrobras sai de prejuízo para lucro de R$ 6,2 bilhões no 2o trimestre. Valor Econômico. Retrieved from http:// www.valor.com.br/empresas/3228478/petrobras-sai-de-prejuizo-para-lucro-de-r-62-bilhoes-no-2
Wang, D. (2006). Founding family ownership and earnings quality. Journal of Accounting Research, 44(3), 619-656.
Watts, R. L., & Zimmerman, J. L. (1986). Positive accounting theory.
Retrieved from http://papers.ssrn.com/sol3/papers.cfm?abstract_ id=928677
Yokoyama, K. Y., Baioco, V. G., Rodrigues Sobrinho, W. B., & Neto, A. S. (2015). A inluência do tamanho da empresa na informação contábil: evidências em empresas large caps e small caps listadas na BM&FBovespa. Revista de Educação e Pesquisa em Contabilidade
(REPeC), 9(3). Retrieved from http://doi.org/10.17524/repec.