www.atmos-meas-tech.net/6/1647/2013/ doi:10.5194/amt-6-1647-2013
© Author(s) 2013. CC Attribution 3.0 License.
Atmospheric
Measurement
Techniques
Geoscientiic
Geoscientiic
Geoscientiic
Geoscientiic
Development and testing of an online method to measure ambient
fine particulate reactive oxygen species (ROS) based on the
2
′
,7
′
-dichlorofluorescin (DCFH) assay
L. E. King and R. J. Weber
School of Earth and Atmospheric Sciences, Georgia Institute of Technology, Atlanta, GA, USA Correspondence to:R. J. Weber ([email protected])
Received: 17 February 2013 – Published in Atmos. Meas. Tech. Discuss.: 4 April 2013 Revised: 7 June 2013 – Accepted: 11 June 2013 – Published: 11 July 2013
Abstract. An online, semi-continuous instrument to mea-sure fine particle (PM2.5) reactive oxygen species (ROS)
was developed based on the fluorescent probe 2′7′ -dichlorofluorescin (DCFH). Parameters that influence probe response were first characterized to develop an optimal method for use in a field instrument. The online method used a mist chamber scrubber to collect total (gas plus par-ticle) ROS components (ROSt)alternating with gas phase
ROS (ROSg) by means of an inline filter. Particle phase
ROS (ROSp) was determined by the difference between
ROStand ROSg. The instrument was deployed in urban
At-lanta, Georgia, USA, and at a rural site during various sea-sons. Concentrations from the online instrument generally agreed well with those from an intensive filter measurement of ROSp. Concentrations of the ROSp measurements made
with this instrument were lower than reported in other stud-ies, often below the instrument’s average limit of detection (0.15 nmol H2O2 equivalents m−3). Mean ROSp
concentra-tions were 0.26 nmol H2O2 equivalents m−3 at the Atlanta
urban sites compared to 0.14 nmol H2O2equivalents m−3at
the rural site.
1 Introduction
Reactive oxygen species (ROS) when introduced into a bi-ological system have a strong tendency to disrupt the elec-trochemical balance. The amount of disruption depends on factors such as the amount of ROS introduced or produced within the system, the location of the introduction or pro-duction of the reactive species, the duration of the insult and
a host of other factors, many of which have yet to be as-certained in nature as well as in scope (Barrett et al., 1999; Morgan et al., 2001; Oberd¨orster, 2004; Rothe and Valet, 1990; Squadrito et al., 2001; Sugamura and Keaney, 2011; Xia et al., 2006). Human exposure to ROS can occur by a number of known routes. ROS associated with gaseous or particulate pollutants generated in the atmosphere may be transported into the respiratory system. Their deposition generates adverse effects within cells of that location. Com-pounds associated with aerosol particles may also be de-posited and result in either a direct or indirect generation of ROS intracellularly, in which the oxidative stress may not be limited to the immediate area of deposition.
Reactive and oxidizing species have been shown to be detrimental to biological systems in a wide variety of ways, including disrupting protein pathways, increasing the break-down of key cellular structures and leading to the eventual death of individual cells, prior to which large amounts of cellular stress translate into wider systemic stress in organ-isms (Antonini et al., 1998; Barrett et al., 1999; Squadrito et al., 2001; Sugamura and Keaney, 2011). Atmospheric ex-posure to ROS can occur either in the gas or particle phase. Gas phase ROS (ROSg)is most likely to be removed in the
upper mucus membranes (Kao and Wang, 2002), whereas other studies (Pope et al., 1995) have demonstrated the abil-ity of fine particles, which would include particle phase ROS (ROSp), to penetrate further into the lungs and deposit in the
alveoli.
fluorescent probes. ROSp measurements have primarily
been made using filters for particle collection and analy-sis of extracts using similar probes (Hung and Wang, 2001; Venkatachari et al., 2005, 2007). These fluorescent probes, such as 2′, 7′-dichlorofluorescin (DCFH) (Hung and Wang, 2001), Amplex Red (Votyakova and Reynolds, 2004), p -hydroxyphenylacetic acid (POHPAA) (Lee et al., 1991) and others, have been adapted from their use in intracellular ROS measurements for direct measurements in the atmosphere. Various ROS will oxidize these probes, which then fluoresce at specific wavelengths when excited. Fluorescent probes are most often chosen for their fast response rates, linear re-sponse to varying ROS concentrations and either dedicated response to a particular compound (e.g., Amplex Red) (Zhou et al., 1997) or lack of chemical specificity (e.g., DCFH; LeBel et al., 1992).
The overall findings of measurements of ambient ROS have shown some associations with other atmospheric species. ROSpis positively correlated with both Fe
concen-tration and other transition metals (See et al., 2007), and a positive correlation with organic concentrations (Wang et al., 2010) has been observed. Some correlations between ROS and ozone have been reported, particularly in the early to mid-afternoon (Venkatachari et al., 2005).
A potential drawback to previously reported ROSp
con-centrations is that previous studies may be susceptible to sampling artifacts. Filter-based studies, particularly for reac-tive compounds, are likely limited by long sample collection times that may result in under-prediction of concentrations (Hung and Wang, 2001). Previous ROSp filter studies have
also been challenging due to reported high and variable blank concentrations (Hung and Wang, 2001; Venkatachari et al., 2005, 2007).
Some preliminary results exist for an online method to measure ROSp (Venkatachari and Hopke, 2008; Wang et
al., 2011). This instrument couples the particle-into-liquid sampler (PILS) with a flow system that mixes DCFH and a catalyst, peroxidase from horseradish (HRP) with the PILS sample stream-contained soluble PM2.5 components
(Venkatachari and Hopke, 2008). After utilizing mixing ele-ments to combine and sufficiently react the sample ROS with the fluorescent reagents, the sample is measured using a spec-trometer. Results from a summertime week-long field opera-tion in Rochester, NY (Wang et al., 2011), showed an aver-age of 8.3±2.2 nmol H2O2equivalents m−3. This study also
indicated a diurnal trend in ROSpwith an increase in
day-time concentrations, as well as higher values on weekdays than on weekends. These reported values exceeded ambient values found on filters in previous studies in the USA and Taiwan (Hung and Wang, 2001; Venkatachari et al., 2005, 2007). These results appear to indicate that ROSploss from
ambient filters can be minimized by using a continuous on-line system with virtually no delay between collection and analysis.
2 Materials and methods
2.1 Primary materials
For this study the DCFH probe was chosen to provide a com-prehensive ROS detector. Of the ROS probes commercially available, DCFH has a long and well-documented record of sensitivity in both cellular and atmospheric aerosol applica-tions (Hung and Wang, 2001; Liu et al., 2007; Venkatachari and Hopke, 2008; Venkatachari et al., 2005, 2007; Wang et al., 2011; Black and Brandt, 1974; Cathcart et al., 1983; LeBel et al., 1992). 2′, 7′-dichlorodihydrofluorescin
diac-etate (DCFHDA) was purchased from both Sigma Aldrich (St. Louis, MO, USA) and Calbiochem (EMD Chemicals, Billerica, MA, USA) depending on availability. Horseradish peroxidase (HRP) (Type II) was purchased exclusively from Sigma Aldrich. Hydrogen peroxide (30 %, w/w) was pur-chased from J.T. Baker through VWR (Atlanta, GA, USA).
Primary analytical equipment included a spectrofluorom-eter (Maya2000Pro, Ocean Optics, Dunedin, FL, USA) with cutoff and long-pass filters for wavelengths greater than 515 nm and a 200 µm slit. The spectrometer was further equipped with a flow-through cell of 450 µL volume with a light path of 10×4 mm (FIA-SMA-FL-ULT). The initial excitation source was a blue (475 nm) LED source man-ufactured by Mikropack (Ocean Optics, LS-475), replaced with a Jasco-manufactured 470 nm wavelength LED with ad-justable voltage (LLS-470, Ocean Optics) to accommodate LED intensity loss with bulb age. Fiberoptic cables (SMA-905, Ocean Optics) completed the primary analytical appa-ratus.
Solutions were pumped through the flow-through cell using an 8-channel peristaltic pump (Ismatec, Opfikon, Switzerland). Any tubing, glassware or other vessels for working solution storage or transport were shielded in alu-minum foil to prevent photooxidation.
2.2 Reagent preparation
(DCFH+HRP) was then stored in an amber vessel or foil-wrapped flask in the laboratory refrigerator at 2◦C and
dis-carded after a period of 2 days. The original standard work-ing solution was 5 µM DCFH with 0.5 units HRP mL−1 so-lution.
3 Offline system for calibration and sensitivity analysis of DCFH
3.1 Initial method and analysis
Initial evaluation of DCFH was conducted following the method described by Hung and Wang (2001) in which the probe was used to quantify the ROS concentrations from ambient particle filter extracts. A total of 3 mL of DCFH-HRP solution were pipetted in the darkroom into 15 mL am-ber centrifuge vials, which were then covered with predrilled caps (1/16′′diameter) and sealed with paper laboratory tape. These preloaded vials were stored in the refrigerator until use.
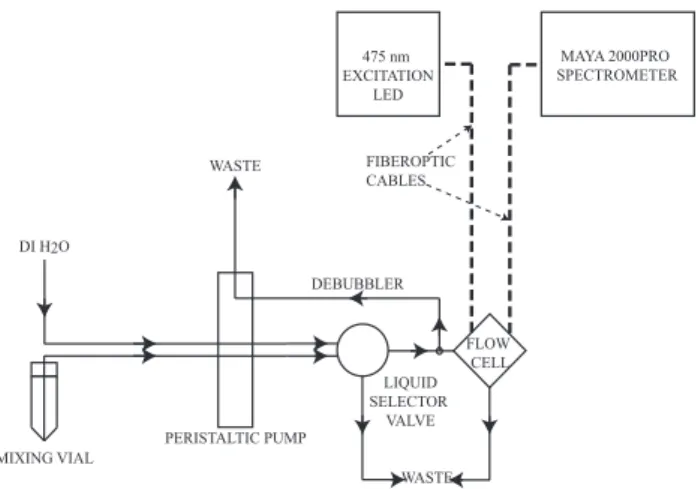
For analysis, the tape was briefly removed from the vials, and 0.1 mL of either deionized water (dI) or a hydrogen peroxide standard was pipetted through the cap hole. The tape was replaced and the vial briefly inverted to ensure that no peroxide remained uncombined with the DCFH so-lution. The vials were incubated in a 37◦C water bath for 15 min. The solution was then briefly agitated by hand and placed in line with the analytical system, shown in Fig. 1. A peristaltic pump moved the DCFH-HRP-H2O2solution at
0.4 mL min−1 through the flow-through cell, while a
selec-tor valve directed dI through the cell when not measuring DCFH intensity. A small glass debubbler was also employed to reduce the signal interference by small air bubbles that may be introduced into the system, also run from the peri-staltic pump. Volume loss from the discarded flow was ap-proximately 10 % of the overall sample flow. Sufficient dI was allowed to move through the system to return the fluores-cent signal to a baseline value before analyzing the next sam-ple. The entire system was plumbed with green PEEK tubing (1/16′′outer diameter, 0.030′′inner diameter, Upchurch Sci-entific, Oak Harbor, WA, USA).
As the solution moved through the flow cell, it was excited by the 475 nm light source, causing the DCF∗product to flu-oresce at 530 nm. This light intensity is transmitted via the fiber optic cable to the spectrophotometer. Fluorescent inten-sity at 530 nm was measured using SpectraSuite from Ocean Optics and recorded with an integration time of 500 ms and average of 10 scans. Prior to any analysis a dark spectrum signal was measured while blocking all light to the spectrom-eter and subtracted automatically from the light spectrum. Intensity values reported are average intensities of measure-ments made once the fluorescent signal was stabilized, af-ter a minimum of 10 min from powering on the excitation source. Deionized water also provided a measurable signal
475 nm EXCITATION
LED
MAYA 2000PRO SPECTROMETER
FLOW CELL LIQUID SELECTOR
VALVE PERISTALTIC PUMP
DI H2O
MIXING VIAL
WASTE
WASTE DEBUBBLER
FIBEROPTIC CABLES
Fig. 1.Schematic for offline ROS analysis of standards and reagents combined in a mixing vial. DCFH + ROS (H2O2for calibrations) is
pumped via the peristaltic pump through the flow cell, in which the concentration of DCF is measured at 530 nm by the spectrometer. A selector valve switches between sample and deionized water to provide a baseline and to clear out the flow cell between samples.
at 530 nm, which was used as a surrogate for light source intensity and system flow stability over time.
An example of an initial calibration made with H2O2
so-lution concentrations of 100–400 nM is shown in Fig. 2. This sample range was chosen as a representative span for the con-centrations reported in ROSpanalysis for typical filter
mea-surement setups (Hung and Wang, 2001; Venkatachari et al., 2005, 2007).
3.2 Offline sensitivity analysis
14000
12000
10000
8000
6000
4000
2000
0
Blank Corrected Intensity, counts
400 300
200 100
0
Concentration, H2O2, nM Slope = 34.4 ± 1.7
R2 = 0.993
Fig. 2.Calibration of offline ROS assay using DCFH with known concentrations of H2O2. Error bars represent the standard deviation
of multiple measurements (n=5).
a different setup in order to measure reaction progress. In those tests, 0.1 mL of a hydrogen peroxide standard or dI was pipetted into the mixing vials as described previously with 3 mL of DCFH solution, briefly inverted to ensure that all liquids were combined and immediately placed in line with the detector. The sample line from vial to detector was short-ened as much as possible to reduce delay time from which DCFH and peroxide were combined to initial detection of fluorescence, using the same 0.030′′ ID PEEK tubing as in
the standard flow analysis setup from Fig. 1. The residence time in line prior to detection was 30 s. The findings from these offline assessments are summarized in Table 1 and used in the application of the online instrument.
4 Online instrument development
4.1 Mist chamber
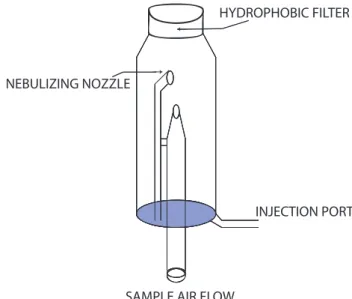
Originally known as the Cofer scrubber, mist chambers were developed to collect water soluble gases and particles for online analysis (Cofer III et al., 1985, 1986; Anderson et al., 2008; Spaulding et al., 2002). Mist chambers are gen-erally a cylindrical glass structure with an air sample inlet at the bottom, a port on the side for introduction and removal of scrubbing liquids, and a nebulizing nozzle, as shown in Fig. 3. Sample air enters the chamber through the bottom nozzle. Inside the chamber, a capillary runs from just above the base and alongside the air nozzle for some vertical dis-tance. Some minimum volume of liquid, usually water, is placed inside the mist chamber via the injection port. Ven-turi forces created by the airflow accelerate through the noz-zle, draw liquid from the reservoir into the airstream and cre-ate a fine mist. Affixed to the top of the mist chamber is a
HYDROPHOBIC FILTER
INJECTION PORT
SAMPLE AIR FLOW NEBULIZING NOZZLE
Fig. 3. Schematic of a mist chamber. Liquid is injected and ex-tracted via the port at the bottom of the chamber. Sample air is drawn through the opening in the base of the chamber, nebuliz-ing the liquid inside and creatnebuliz-ing a mist of droplets. Liquids are retained by means of a hydrophobic filter attached to the top of the mist chamber, which also refluxes liquid back down the sides of the glass.
Table 1.Optimal parameters for use in online instrumentation.
Parameter Value
Maximum viable DCFH useful age 2 days Reaction temperature ambient DCFH concentration 10 µM
Volumetric ratio Arbitrary (9 : 1–30 : 1) Minimum reaction time 3 min
filter pack (University Research Glassware (URG), Carrboro, NC, USA) equipped with a 1.0 µm pore size hydrophobic fil-ter (TefSep, Pall Corporation). This filfil-ter prevents the liq-uid from exiting the chamber, which refluxes down from the top of the mist chamber back to the reservoir. This liquid scrubs the soluble gases and particles from the airstream as it is continually recycled through the chamber. Some liquid is inevitably lost as water vapor in the exhaust flow. When sam-ple airflow is halted, the liquid and its components in solution are withdrawn from the chamber for analysis. Analysis of the sample can occur while the next mist chamber sampling cy-cle starts.
Benefits of the mist chamber include operation without heating the sample and the ability to vary integration time in order to concentrate samples. The mist chamber has been shown to effectively collect compounds with a Henry’s law constant, KH, of over 103M atm−1 (Spaulding et al.,
SYRINGE PUMP 8 PORT VALVE
MIST CHAMBER
AIR SELECTOR VALVE PM2.5
CYCLONE
TEFLON FILTER
MASS FLOW CONTROLLER WATER TRAP
VACUUM PUMP
475 nm EXCITATION
LED
MAYA 2000PRO SPECTROMETER
FLOW CELL LIQUID SELECTOR
VALVE PERISTALTIC PUMP
DI H2O
MIXING VIAL
WASTE
WASTE DEBUBBLER
FIBEROPTIC CABLES
Fig. 4.Schematic of online PM2.5ROS measurement approach using a mist chamber particle collection system and fluorometric probe.
more water as opposed to a continuous monitoring system. Mist chambers are also effective scrubbers of gases, unlike condensation-based systems, indicating the need for an ef-fective gas phase control to efef-fectively measure solely parti-cle concentrations. A mist chamber was chosen as the par-ticle collection for the online ROSp instrument in part due
to control of sample integration times to overcome analytical detection limits.
4.2 Online method setup
The overall setup of the mist chamber-based ROS instrument is shown in Fig. 4. Ambient air is drawn through a cyclone (PM2.5, 16.7 L min−1, URG) and a copper inlet line. The
air-flow enters an automated valve that either directs it through a 47 mm filter pack (URG) containing a 2.0 µm Teflon fil-ter (Zefluor, Pall Corporation) for measurements of ROSg,
or bypasses the filter for a measurement of ROSg+ ROSp,
or total ROS (ROSt). The sample air then enters the mist
chamber, after which the scrubbed airstream exits through the hydrophobic filter. The airflow finally passes through a water trap followed by a mass flow controller (GFC-47, Aal-borg), set nominally at 20 L min−1, and then to a vacuum pump (carbon vane, Gast 1/4 hp). These sampling system components were specifically chosen to maximize retention of PM2.5and thus ROSp.
A syringe pump equipped with an 8-port valve (V6 pump with 48 K resolution, Norgren Kloehn, Las Vegas, NV, USA) and a continuously operating peristaltic pump (4-channel, Is-matec) control the liquid portion of the instrument. One port of the syringe pump is connected to the mist chamber liq-uid inlet; the other ports led to a reservoir of the DCFH-HRP working solution, dI, waste, and a 15 mL amber centrifuge tube (mixing vial) as described in the offline analysis method.
The remaining three ports can be used for up to two hydro-gen peroxide standards for automatic calibrations, and for an open port for introduction of air, as required. The V6 pump also electronically controls the power to the vacuum pump through a solid-state relay as well as the position of the sam-ple air selector valve and a two-position liquid selector valve to change the source of the liquid flow into the flow cell.
The peristaltic pump continuously moves liquid from ei-ther the mixing vial or the dI reservoir through the flow cell. This amber mixing vial contains two PEEK tubing lines in-serted through the hole in the cap. The line from the peri-staltic pump extended to the vial bottom while the line from the syringe pump valve extended only a short distance past the cap. This setup allows for all liquid to be withdrawn com-pletely via the longest line from the mixing vial, while the shorter line does not reach the liquid level within the vial at any time. A third channel on the peristaltic pump also con-trols flow from a glass debubbler in line just prior to the flow-through cell. The fourth channel drains liquid from the water trap to protect the mass flow controller. The syringe and all other clear portions of this system are shielded from light with aluminum foil to inhibit photooxidation of the DCFH.
4.3 Sampling automation and analysis
syringe is immediately discarded to remove any air from the liquid system. A total of 9 mL of working solution are then added to the syringe. The combined total 10 mL of sample liquid and working solution is forced into the mixing vial via the higher level tube. This process mixes the sample of dis-solved ROS components and working solution. During this time, the peristaltic pump is running continually, pumping dI through the flow cell and the mixed sample-reagent solu-tion from the vial is sent to waste, until after 1 min, at which point the vial liquid has reached the selector valve, which then is actuated to direct vial liquid to the flow cell (dI now to waste). The reacted sample solution moves through the flow cell for 2.5 min, at the end of which the fluorescent sig-nal is recorded. This results in a fluorescent sigsig-nal quantified after 4.5 min of reaction time. Deionized water in between samples provides a baseline as previously discussed.
During the analysis of the ambient sample by the spec-trometer, the syringe pump cleans the mist chamber prior to reloading it for another sample by draining and discarding the remaining sample liquid. Water used for sample collec-tion is added to the mist chamber. The air selector valve is adjusted to filter ambient air and the vacuum pump runs for 30 s, rinsing the mist chamber with particle-free air and water (but does contain ambient ROSg). The vacuum pump is shut
off, and this water withdrawn and discarded.
After the final measurements of the fluorescent signal, the liquid selector valve returns to its prior state, pumping any remaining sample from the mixing vial to waste and rinsing the flow cell with dI. The syringe pump then also withdraws and discards remaining sample solution to completely empty the vial and flushes the vial once with dI.
Since part of the analysis time includes preparing the mist chamber for the next measurement, there is a delay of 5.5 min between sampling cycles. For example, one complete cy-cle of the general ROS sampling and analysis cycy-cle takes 10.5 min when collecting sample in the mist chamber for 5 min. Longer duty cycles were employed when the mist chamber sample collection time was increased to produce more concentrated samples.
4.4 Mist chamber particle collection efficiency and liquid loss
The mist chamber was constructed by the department glass blower, so variation between different chambers is possible. This variation and the subsequent potential operational col-lection efficiency differences must be evaluated. Colcol-lection efficiencies were determined by comparing the collection of sulfate with a simultaneous operation of the PILS-IC sys-tem (Orsini et al., 2003). The ROS instrument was operated entirely in ROSt mode and fitted with a gas denuder
up-stream. The collected liquid was drawn from the mist cham-ber into a vial, which was then analyzed manually by the same IC measuring the sample collected by the PILS. Multi-ple measurements of ambient PM2.5 sulfate concentrations
1.0
0.8
0.6
0.4
0.2
0.0
Collection Efficiency
25 20
15 10
5
Sample Air Flow, L/min
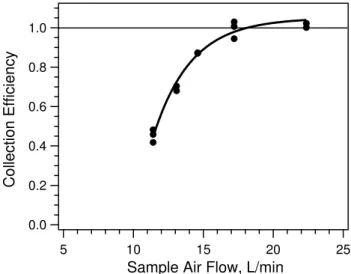
Fig. 5. Mist chamber collection efficiency. Collection efficiency determined by ratio of ambient sulfate measured with the mist chamber-IC to that from a PILS-IC system.
were conducted at different mist chamber sample airflow rates. The resulting collection efficiency (mist chamber sul-fate to PILS sulsul-fate) shown in Fig. 5 shows that this spe-cific mist chamber should be operated at a minimum flow rate of 15 L min−1. Maximum flow rates for this particular setup were limited to approximately 25 L min−1due to pres-sure drop across various elements of the system, mainly from the wetted hydrophobic refluxing filter.
While the refluxing hydrophobic filter that retains liquid in the mist chamber is effective, inevitably some liquid loss oc-curs. The final volume of liquid retained by the mist chamber is measured periodically to account for this loss to account and to determine the ambient concentration. This potential loss was also a motivating factor in the short sampling pe-riods employed during the majority of the instrument’s field deployment.
4.5 Online calibration and dynamic liquid blanks
The ROS instrument is calibrated with the mist chamber of-fline in an automated process using the analytical system just described. Instead of liquid from the mist chamber be-ing combined with the DCFH workbe-ing solution in the mixbe-ing vial, the same volume of a standard is used. This allows the verification of known concentrations as part of routine opera-tion. “Blank”, or auto-oxidation, measurements to adjust for working solution age and subsequent increase in baseline flu-orescent intensity were also made using dI. Figure 6 shows a typical plot from such a calibration, using standard concen-trations in the range anticipated for ambient sampling with the online instrument.
10000
9000
8000
7000
6000
5000
4000
3000
2000
1000
Blank Corrected Intensity, counts
200 180 160 140 120 100 80 60 40 20 0
H2O2 Concentration, nM slope = 47.8 ± 1.67
R2 = 0.992
Fig. 6.Calibration of online ROS assay using DCFH with known concentrations of H2O2. Error bars represent the standard deviation
of multiple measurements (n=5).
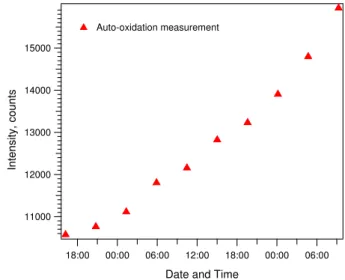
operation to allow for dynamic correction of the sample flu-orescent signal over time. The blank signal is measured af-ter every 6 ambient measurements, or approximately every hour. Figure 7 shows a sample of the drift over roughly a 48 h sample period of the blank signal during field-testing of the instrument.
4.6 Calculation of ambient ROS concentration
The ROS concentration in the ambient air in H2O2
equiva-lents is calculated by
Ca= I−b
a
Vs
1000Qat
1000 L m−3, (1)
whereI is the intensity of the fluorescent signal (counts), b the intercept from calibration linear fit,a the slope from calibration linear fit,Vs final solution volume (mL) in mist
chamber, andQathe average airflow through the mist
cham-ber (L min−1, ambientT andp) for a sampling period oft (min). MultiplyingCaby 1000 L m−3results in an ambient
ROS concentration in nmol H2O2equivalents m−3.
4.7 Evaluation of gas phase removal and ROSp
calculation by difference
Several compounds were assessed as dry scrubbers or as an-nular denuder coatings for use in ROSgremoval to improve
determination of ROSp. A glass annular denuder (URG)
coated with a slurry of MnO2and a diffusion dryer filled with
Carulite (a dry MnO2compound) (Carus Corporation, Peru,
IL, USA) were evaluated for their ability to remove ROSg.
MnO2was of primary interest since this has been an ROS
re-moval compound used in previous studies (Hwang and Das-gupta, 1986; Stobbe et al., 1999). Ti(IV) oxalate was also used in an annular denuder coating, given its use in scrubbing
15000
14000
13000
12000
11000
Intensity, counts
18:00 00:00 06:00 12:00 18:00 00:00 06:00
Date and Time
Auto-oxidation measurement
Fig. 7.Auto-oxidation (pure water blank) measurements of DCFH over time, demonstrating the drift of the DCFH working solution during regular operation of the online instrument.
hydrogen peroxide (Possanzini et al., 1988; Possanzini and Di Palo, 1995).
Denuder efficiency tests were done by consecutive denuder-on versus denuder-bypass ROS measurements with the automated mist chamber system by placing the Teflon filter upstream of the complete system, and the denuder in the position formerly occupied by the filter controlled by the air selection valve. The annular denuder coated with a MnO2 slurry removed an average of 9 % of the ambient
ROSg, with a maximum removal efficiency of 57 % (standard
deviation of removal efficiency was 21 % (n=111)). Dry MnO2packed into the diffusion dryer removed an average of
18 %, with a maximum of 39 % and a standard deviation of 11 % (n=113). Ti(IV) oxalate denuders were evaluated for a briefer period of time, with an average removal efficiency of 12 % and a standard deviation of 33 % (n=24).
Tests were also performed to determine if there were ROSg interferences from ozone. Measurements from
sam-pling laboratory-generated ozone at concentrations between 60 and 180 ppb showed little response, as expected given its low solubility (KHof 0.011 M atm−1) (Kosak-Channing and
Helz, 1983).
The low removal efficiency and high variability suggested that these denuders would not be effective in removing ROSg
consistently enough to include in a system that depended on reliable gas removal for artifact-free measurements. This conclusion led to the regular use of the difference method for determining ROSpfrom ROStand ROSg, measured in an
al-ternating fashion. ROSpin nmol H2O2equivalents m−3was
determined by ROSp,i=
[ROSt,i−ROSg,i−1] + [ROSg,i−ROSg,i+1]
2 , (2)
4.8 Precision and limits of detection
Precision was determined by the standard deviation of a repeated standard in a calibration setting and the periodic measurement of standards during routine field operation of the instrument. The analytical precision based on re-peated calibration standards was 6.2 %,n=30 (1.26 nM liq-uid concentration, or under normal operating parameters, 0.025 nmol H2O2 equivalents m−3). Precision of the
field-deployed instrument, based on periodic measurements of standards during routine operation, was 7.1 % (n=10).
The limit of detection for measuring ROS considering just the analytical portion of the method was determined by three times the standard deviation of the blank measurements made in succession (DCFH working solution and dI). The result-ing liquid concentration limit of detection was 0.28 nM H2O2
equivalents, or 0.029 nmol H2O2equivalents m−3for the
nor-mal operational values of the mist chamber, in which the fi-nal liquid volume is 9.7 mL, airflow rate 20 L min−1and the sample collection time 5 min. For the field-deployed instru-ment, ROS measurement limit of detection (LOD) was simi-lar for consecutive blanks.
The method LOD for determining ROSp is substantially
higher, however, since it involves a difference between two large values of relatively close magnitude. During the field measurements described below, frequent negative ROSp
val-ues resulted from the difference calculation. An alternate and conservative LOD was use based on the variability in the neg-ative ROSpvalues. For example, once ROSpwas determined
for a specific study period (e.g., a specific site) and after basic quality control removed erroneous measurements of erratic highs or lows, the LOD for the particle measurements was estimated from one standard deviation of all negative values calculated from the difference method. The calculated LOD by this method varied between 0.07 and 0.19 nmol H2O2
equivalents m−3, with an average value of 0.15 nmol H2O2
equivalents m−3. The high LOD associated with this differ-ence method emphasizes the importance of reducing or elim-inating the gas signal from the particle measurement. Future progress is needed in this area to improve the ROSpmethod
used in this work.
5 Results and discussion
5.1 Field deployment
The ROS mist chamber was evaluated for ambient sam-pling by deployment at a number of sites during vari-ous seasons. Sites included the Southeastern Aerosol Re-search and Characterization (SEARCH) network Jefferson Street site (JST) from 7 February to 2 March 2012, and 8 May to 31 May 2012. Located in central urban Atlanta, GA, the site is considered representative of urban Atlanta (Hansen et al., 2006). Measurements were made at Yorkville
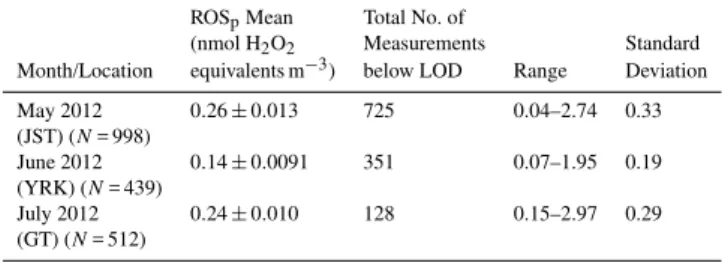
Table 2.Comparison of average and span of online ROSp
measure-ments during summer study period.
ROSpMean Total No. of
(nmol H2O2 Measurements Standard
Month/Location equivalents m−3) below LOD Range Deviation
May 2012 0.26±0.013 725 0.04–2.74 0.33
(JST) (N= 998)
June 2012 0.14±0.0091 351 0.07–1.95 0.19
(YRK) (N= 439)
July 2012 0.24±0.010 128 0.15–2.97 0.29
(GT) (N= 512)
(YRK), the SEARCH rural pair to JST located approximately 80 km northwest of Atlanta, 8 June to 29 June 2012. Fi-nally, measurements were made from the rooftop monitor-ing site at Georgia Tech (GT) (midtown Atlanta), 3 July to 31 July 2012, a site more impacted by highway traffic emis-sions than the JST site.
An example of the type of raw data produced by the instru-ment is shown in Fig. 8. The time series of the fluorescent intensity at 530 nm shows a series of peaks starting from a baseline of roughly 6000 counts. Adjustments were made on a weekly basis to maintain the baseline intensity at this level as a surrogate for controlling LED output intensity and to cre-ate consistent excitation in the samples. Peak heights are the response to measurements when the DCFH working solution is mixed with either a dI “blank”, a standard, or a mist cham-ber sample of ROSt or ROSg. ROS measurements and
cal-ibration standards are corrected by subtracting an estimated “blank” determined from a linear interpolation between suc-cessive auto-oxidation measurements. In this example, a set of 8 ROS measurements were made by alternating between ROSt and ROSgbetween blanks or standards. Standards are
less frequently analyzed than blanks.
During May (JST) and June (YRK), the ROS instrument was operated using a 5 min sampling period, but increased to 30 min for later portions of the GT July study. Figure 9 shows the time series of ROSpmeasured at the Georgia Tech
site. Table 2 provides a statistical summary of ROSp
con-centrations from each site. The ambient results are discussed following a comparison between the online system and filter measurements.
5.2 Comparison with filter concentrations
A short ROSp-filter study was conducted in order to compare
online ROSp concentrations to the more traditional
16000
14000 12000
10000 8000
6000
12:00 5/9/2012
13:00 14:00 15:00 16:00
Date and Time
16600
16400
16200
16000
15800
15600
15400
Pure water signal
std
blk blk
blk
Raw Intensity, counts
Alternating ROSt, ROGg
Fig. 8.Time series of raw spectrometer data for ambient ROS measurements showing responses for pure water, deionized water + DCFH/HRP (blk), online measurements of total and gas ROS, and H2O2standards (std).
1.4
1.2
1.0
0.8
0.6
0.4
0.2
0.0
ROS
p
,
nmol H
2
O2
equivalents
/ m
3
7/5/2012 7/9/2012 7/13/2012 7/17/2012 7/21/2012 7/25/2012 7/29/2012
Date/Time
Fig. 9.Time series plot of ROSpat the Georgia Tech sites. ROSpbelow estimated limit of detection is plotted as 0.5·(LOD).
3 h. Following sampling, filters were immediately extracted into 30 mL of the same batch of DCFH working solution be-ing used in the co-located online instrument, mechanically shaken using a wrist-action shaker (mechanical wrist action shaker, Model 70, Burrell Scientific, Pittsburgh, PA, USA) for 15 min and analyzed using an identical setup to the on-line system. This procedure deviated from other studies’ fil-ter measurements (Hung and Wang, 2001) in two ways: one, the same volume of DCFH was used for each filter, and, two, filters were shaken rather than sonicated to extract the parti-cles into solution. Filter blanks and water blanks were also measured and standards were checked routinely.
Since the majority of the online measurements were com-prised of values at or below the LOD, only average compar-isons are made between the filter and online ROSp. No filter
measurement was below the filter LOD (0.016 nmol H2O2
equivalents m−3). In cases where measurements were be-low the LOD, 1/2 LOD was used in the statistical cal-culations. Results from the filter comparison are detailed in Table 3. The filter measurements tend to agree with the online results, despite the fact the filters were TSP and the online method sampled PM2.5. The average filter
Table 3.Comparison of online and offline ROSp measurements,
12–27 July 2012.
ROSpMean
(nmol H2O2 Standard
Method equivalents m−3) Range Deviation
Online (mist chamber) 0.16±0.010 0.01–0.70 0.17 Offline (filters) (N= 19) 0.15±0.019 0.05–0.34 0.079
ROSp was 0.15 nmol H2O2 equivalents m−3 compared to
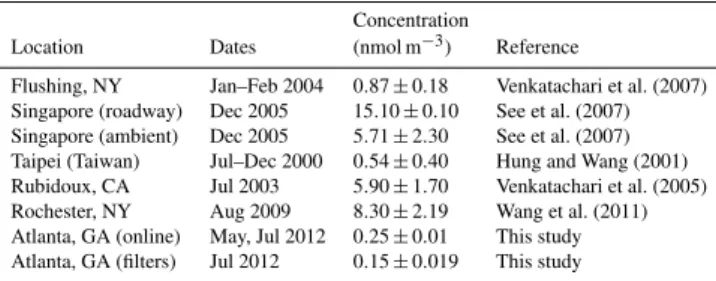
Table 4.Summary of ROSpstudies.
Concentration
Location Dates (nmol m−3) Reference
Flushing, NY Jan–Feb 2004 0.87±0.18 Venkatachari et al. (2007) Singapore (roadway) Dec 2005 15.10±0.10 See et al. (2007) Singapore (ambient) Dec 2005 5.71±2.30 See et al. (2007) Taipei (Taiwan) Jul–Dec 2000 0.54±0.40 Hung and Wang (2001) Rubidoux, CA Jul 2003 5.90±1.70 Venkatachari et al. (2005)
Rochester, NY Aug 2009 8.30±2.19 Wang et al. (2011)
Atlanta, GA (online) May, Jul 2012 0.25±0.01 This study Atlanta, GA (filters) Jul 2012 0.15±0.019 This study
6 Discussion of online field results
Both urban sites (JST and GT) showed significantly higher ROSp concentrations when compared with the
ru-ral site (YRK) (p <0.001 andp <0.05 respectively). The JST and GT mean ROSp concentrations were also
dif-ferent (p <0.001) at 0.26 and 0.24 nmol H2O2
equiva-lents m−3, respectively, whereas YRK was roughly half that at 0.14 nmol H2O2equivalents m−3. These numbers are
un-certain since much of the data were below the LOD of 0.15 nmol m−3, but the urban sites had fewer values below
LOD, consistent with generally higher ROSpvalues.
The GT location is much closer to a congested 16-lane highway that runs through the middle of the city. Online measurements of elemental carbon (EC), a tracer for primary aerosol, show a greater influence of roadway emissions at GT. For example, GT / JST EC ratio was 1.36 for July 2012. This comparison, though, is somewhat ambiguous since the ROSpmeasurements made at the two sites were at different
times (JST in May 2012, GT in July 2012), but still no large difference is observed for a site expected to be more impacted by highway emissions. The lower concentrations at the rural site suggest urban emission may be related to ROSp.
These offline and online measurements of ROSpare
gen-erally lower than what has been reported by other investi-gators, as summarized previously (Wang et al., 2011) and shown in Table 4. Filter-based studies have reported ROSp
concentrations in the range of 0.54 to 15.1 nmol H2O2
equiv-alents m−3, about an order of magnitude above levels mea-sured in this study. The few online studies conducted over much shorter time periods (1 week) report a mean ROSp
con-centration of 8.30±2.19 nmol m−3(Wang et al., 2011). The highest concentrations are found in studies conducted next to roadways, possibly suggesting that extremely fresh emis-sions from these locations can lead to higher measured con-centrations. It is not clear why the concentrations in Atlanta and vicinity are significantly lower. This could be due to dif-ferent emission characteristics, linked to difdif-ferent measure-ment methods, or due to some of the substantial challenges associated with using this chemical probe.
7 Conclusions
An automated flow system and online instrument was devel-oped for analysis of ROS using a mist chamber collection system coupled to an analytical system employing DCFH as a fluorescent probe. The system was operated using a set of operational parameters optimized based on extensive labora-tory experiments. The analytical system LOD was 0.28 nM. This detector was coupled to a mist chamber for collecting and concentrating ROS components in water. PM2.5 ROS
(ROSp)was determined by the difference between total gas
plus particle (ROSt) and filtered air (i.e., gas-phase ROS,
ROSg). This method was chosen since experiments with
var-ious denuders showed low and variable effectiveness for re-moving ROSg. Higher LODs are associated with this method
versus potential direct online methods due to high ROSg
levels relative to ROSp. For the three months of
measure-ments reported in this study, the percentage of ROSgto total
ROSg/ROSt was 96±124 % (one standard deviation).
On-line measurements were above the detection limit of nominal 0.15 nmol H2O2equivalents m−3approximately 25 % of the
time. ROSgartifacts can be reasonably expected to dominate
other liquid-based systems. During the field deployment of the instrument, concentrations of ROSp were higher in
ur-ban areas relative to a rural site, averaging 0.25 nmol H2O2
equivalents m−3 for urban Atlanta in May and July, versus 0.14 nmol H2O2 equivalents m−3 at the rural Yorkville site
during June. These online results were consistent with a se-ries of filter samples using the same ROS analytical system designed for the online method. The ROSpreported in this
study is significantly below what has been reported by other investigators, with ranges between 0.54 and 15.1 nmol H2O2
equivalents m−3. Application of the DCFH probe to
mea-surement of ambient particle ROS is challenging due to a number of factors, including auto-oxidation of the working solution over a short period of time as well as photosensitiv-ity and potential for large interferences from ROSg.
Acknowledgements. This research was made possible through USEPA grant R834799. The contents of this paper are solely the responsibility of the grantee and do not necessarily represent the official views of the USEPA. Further, USEPA does not endorse the purchase of any commercial products or services mentioned in the publication. This research was also made possible in part by collocating field deployments with sites operated by Atmospheric Research and Analysis (ARA) as part of the Southeastern Aerosol Research and Characterization (SEARCH) network of monitoring stations, which are funded in part by the Electric Power Research Institute (EPRI) and the Southern Company. This work does not necessarily represent the views of any of the above parties, nor do they endorse any of the commercial products mentioned within this text.
References
Anderson, C. H., Dibb, J. E., Griffin, R. J., Hagler, G. S. W., and Bergin, M. H.: Atmospheric water-soluble organic carbon mea-surements at Summit, Greenland, Atmos. Environ., 42, 5612– 5621, doi:10.1016/j.atmosenv.2008.03.006, 2008.
Antonini, J. M., Clarke, R. W., Murthy, G. G. K., Sreekanthan, P., Jenkins, N., Eagar, T. W., and Brain, J. D.: Freshly generated stainless steel welding fume induces greater lung inflammation in rats as compared to aged fume, Toxicol. Lett., 98, 77–86, 1998. Barrett, W. C., DeGnore, J. P., Keng, Y.-F., Zhang, Z.-Y., Yim, M. B., and Chock, P. B.: Roles of Superoxide Radical Anion in Sig-nal Transduction Mediated by Reversible Regulation of Protein-tyrosine Phosphatase 1B, J. Biol. Chem., 274, 34543–34546, 1999.
Black, M. J. and Brandt, R. B.: Spectrofluorometric Analysis of Hy-drogen Peroxide, Anal. Biochem., 58, 246–254, 1974.
Cathcart, R., Schwiers, E., and Ames, B. N.: Detection of Picolmole Levels of Hydroperoxides Using a Fluorescent Dichlorofluores-cein Assay, Anal. Biochem., 134, 111–116, 1983.
Cofer III, W. R., Collins, V. G., and Talbot, R. W.: Improved Aqueous Scrubber for Collection of Soluble Atmospheric Trace Gases, Environ. Sci. Technol., 19, 557–560, 1985.
Cofer III, W. R., Edahl, J., and Robert A.: A New Technique For Collection, Concentration and Determination of Gaseous Tropo-spheric Formaldehyde, Atmos. Environ., 20, 979–984, 1986. Cohn, C. A., Simon, S. R., and Schoonen, M. A. A.: Comparison of
fluorescence-based techniques for the quantification of particle-induced hydroxyl radicals, Particle and fibre toxicology, 5, 2, doi:10.1186/1743-8977-5-2, 2008.
Hansen, A., Edgerton, E., Hartsell, B., Jansen, J., Burge, H., Koutrakis, P., Rogers, C., Suh, H., Chow, J., Zielinska, B., Mc-Murry, P., Mulholland, J., Russell, A., and Rasmussen, R.: Air Quality Measurements for the Aerosol Research and Inhalation Epidemiology Study, J. Air Waste Manage. As., 56, 1445–1458, 2006.
Hung, H.-F. and Wang, C.-S.: Experimental determination of reac-tive oxygen species in Taipei aerosols, J. Aerosol Sci., 32, 1201– 1211, 2001.
Hwang, H. and Dasgupta, P. K.: Fluorometric flow injec-tion determinainjec-tion of aqueous peroxides at nanomolar level using membrane reactors, Anal. Chem., 58, 1521–1524, doi:10.1021/ac00298a055, 1986.
Kao, M.-C. and Wang, C.-S.: Reactive Oxygen Species in Incense Smoke, Aerosol Air Quality Res., 2, 61–69, 2002.
Klippel, T., Fischer, H., Bozem, H., Lawrence, M. G., Butler, T., J¨ockel, P., Tost, H., Martinez, M., Harder, H., Regelin, E., Sander, R., Schiller, C. L., Stickler, A., and Lelieveld, J.: Distribution of hydrogen peroxide and formaldehyde over Central Europe dur-ing the HOOVER project, Atmos. Chem. Phys., 11, 4391–4410, doi:10.5194/acp-11-4391-2011, 2011.
Kosak-Channing, L. F. and Helz, G. R.: Solubility of Ozone in Aqueous Solutions of 0–0.6 M Ionic Strength at 5–30 C, Envi-ron. Sci. Technol., 17, 145–149, 1983.
LeBel, C. P., Ischiropolous, H., and Bondy, S. C.: Evaluation of the Probe 2′,7′-Dichiorofluorescin as an Indicator of Reactive Oxy-gen Species Formation and Oxidative Stress, Chem. Res. Toxi-col., 5, 227–231, 1992.
Lee, J. H., Chen, Y., and Tang, I. N.: Heterogeneous Loss of Gaseous H2O2 in an Atmospheric Air Sampling System,
Env-iron. Sci. Technol., 25, 339–342, 1991.
Liu, H. H., Wu, Y. C., and Chen, H. L.: Production of ozone and reactive oxygen species after welding, Archives of environmental contamination and toxicology, 53, 513–518, doi:10.1007/s00244-007-0030-1, 2007.
Morgan, T. E., Davis, D. A., Iwata, N., Tanner, J. A., Snyder, D., Ning, Z., Kam, W., Hsu, Y.-T., Winkler, J. W., Chen, J.-C., Peta-sis, N. A., Baudry, M., Sioutas, C., and Finch, C. E.: Glutamater-gic Neurons in Rodent Models Respond to Nanoscale Particu-late Urban Air Pollutants In Vivo and In Vitro, Environ. Health Persp., 119, 1003–1009, 2001.
Oberd¨orster, E.: Manufactured Nanomaterials (Fullerenes, C60) In-duce Oxidative Stress in the Brain of Juvenile Largemouth Bass, Environ. Health Persp., 112, 1058–1062, doi:10.1289/ehp.7021, 2004.
Orsini, D. A., Ma, Y., Sullivan, A., Sierau, B., Baumann, K., and Weber, R. J.: Refinements to the particle-into-liquid sam-pler (PILS) for ground and airborne measurements of water soluble aerosol composition, Atmos. Environ., 37, 1243–1259, doi:10.1016/s1352-2310(02)01015-4, 2003.
Pope, C. A., Thun, M. J., Namboodiri, M. M., Dockery, D. W., Evans, J. S., Speizer, F. E., and Heath, C. W.: Particulate air pol-lution as a predictor of mortality in a prospective study of US adults, Am. J. Resp. Crit. Care, 151, 669–674, 1995.
Possanzini, M. and Di Palo, V.: Improved titanium method for deter-mination of atmospheric H2O2, Anal. Chim. Acta, 315, 225–230, 1995.
Possanzini, M., Di Palo, V., and Liberti, A.: Annular denuder method for determination of H2O2in the ambient atmosphere,
Sci. Total Environ., 77, 203–214, 1988.
Reeves, C. E. and Penkett, S. A.: Measurements of Peroxides and What They Tell Us, Chem. Rev., 103, 5199–5218, 2003. Rothe, G. and Valet, G.: Flow Cytometric Analysis of
Respira-tory Burst Activity in Phagocytes with Hydroethidine and 2′,7′ -Dichlorofluorescin, J. Leukocyte Biol., 47, 440–448, 1990. See, S. W., Wang, Y. H., and Balasubramanian, R.: Contrasting
reactive oxygen species and transition metal concentrations in combustion aerosols, Environ. Res., 103, 317–324, 2007. Spaulding, R. S., Talbot, R. W., and Charles, M. J.: Optimization of
a Mist Chamber (Cofer Scrubber) for Sampling Water-Soluble Organics in Air, Environ. Sci. Technol., 36, 1798–1808, 2002. Squadrito, G. L., Cueto, R., Dellinger, B., and Pryor, W. A.: Quinoid
Redox Cycling as a Mechanism for Sustained Free Radical Gen-eration by Inhaled Airborne Particulate Matter, Free Radical Biol. Med., 31, 1132–1138, 2001.
Stobbe, E. R., de Boer, B. A., and Geus, J. W.: The reduction and ox-idation behaviour of manganese dioxides, Catal. Today, 47, 161– 167, 1999.
Sugamura, K. and Keaney, J., and John F.: Reactive oxygen species in cardivascular disease, Free Radical Biol. Med., 51, 978–992, 2011.
Venkatachari, P. and Hopke, P. K.: Development and Laboratory Testing of an Automated Monitor for the Measurement of Atmo-spheric Particle-Bound Reactive Oxygen Species (ROS), Aerosol Sci. Technol., 42, 629–635, doi:10.1080/02786820802227345, 2008.
Venkatachari, P., Hopke, P. K., Brune, W. H., Ren, X., Lesher, R., Mao, J., and Mitchell, M.: Characterization of Wintertime Reactive Oxygen Species Concentrations in Flushing, New York, Aerosol Sci. Technol., 41, 97–111, doi:10.1080/02786820601116004, 2007.
Votyakova, T. V. and Reynolds, I. J.: Detection of hydrogen per-oxide with Amplex Red: interference by NADH and reduced glutathione auto-oxidation, Arch. Biochem. Biophys., 431, 138– 144, doi:10.1016/j.abb.2004.07.025, 2004.
Wang, Y., Arellanes, C., Curtis, D. B., and Paulson, S. E.: Probing the Source of Hydrogen Peroxide Associated with Coarse Mode Aerosol Particles in Southern California, Environ. Sci. Technol., 44, 4070–4075, 2010.
Wang, Y., Hopke, P. K., Sun, L., Chalupa, D. C., and Utell, M. J.: Laboratory and field testing of an automated atmospheric particle-bound reactive oxygen species sampling-analysis sys-tem, J. Toxicol., 2011, 9 pp., doi:10.1155/2011/419476, 2011.
Xia, T., Kovochich, M., Brant, J., Hotze, M., Sempf, J., Oberley, T., Sioutas, C., Yeh, J. I., Wiesner, M. R., and Nel, A.: Compari-son of the Abilities of Ambient and Manufactured Nanoparticles To Induce Cellular Toxicity According to an Oxidative Stress Paradigm, Nano Letters, 6, 1794–1807, 2006.