ABSTRACT: In this work, the Techno-economic Environmental Risk Analysis framework, a multi-disciplinary optimisation tool developed by Cranield University, is utilised in conjunction with an in-house optimiser to carry out aircraft engine cycle optimisation processes. The central point here is the evaluation of the capabilities of the in-house optimiser for performing this type of optimisation processes. Simplifying hypotheses are thus considered when both deining the aircraft light trajectory and modelling the different engine conigurations analysed. Accordingly, several optimum engine cycles minimising separately three objective functions, (i) speciic fuel consumption in cruise, (ii) fuel burned, and (iii) oxides of nitrogen emitted, are determined. The cycle optimisation processes carried out yield results relecting the general trends expected when optimising according to these objective functions. It follows then that the in-house optimiser is suitable for carrying out gas turbine power plant optimisation processes. It is expected that this optimiser be utilised in future for both optimising the preliminary design of gas turbine engines and determining optimum and “greener” aircraft engine cycles.
KEYWORDS: Engine cycle optimisation, Aircraft emissions, Environmental impact.
On Optimisation of Environmentally Friendly
Aircraft Engine Cycles
Cesar Celis1, Vishal Sethi2, Riti Singh2, Pericles Pilidis2
INTRODUCTION
here is an increasing concern about the current natural resource consumption trends and the impact of human activities on the environment. his is justiied as anthropogenic pollutants have reached very high levels. It is imperative, therefore, that major targeted investments be made into economical and reliable environmental friendly power plant solutions. Currently, there is a large variety of promising power and propulsion concepts that are being proposed to mitigate or eliminate carbon dioxide and other emissions. hese include new aircrat engines featuring conventional and novel cycles, nuclear power plants, carbon capture schemes, renewable energy sources (including onshore and offshore wind and wave energy systems), and many others. he systems envisaged are larger and more complex than those corresponding to the current state of the art. Inevitably, this will result in an increase in the power plant initial cost, a greater diiculty to meet reliability and availability requirements, and more complex operating procedures. Furthermore, the combined objectives of economic and environmental performance make the decision process much more diicult. All these challenges will need to be addressed when evaluating investment performance. In addition, for many of these concepts, there is little or no relevant operating experience. So, the selection of the best candidates to pursue for investment becomes very diicult and uncertain, and the risks are high. he Techno-economic Environmental Risk Analysis (TERA) framework/tool provides an answer to some of these questions. TERA can inform investors, legislators, and other stakeholders of the best investments needed to achieve a cleaner environment, and, hopefully, to accelerate the accrual of beneits from advanced low carbon power and propulsion systems.
1.Pontifícia Universidade Católica do Rio de Janeiro – Departamento de Engenharia Mecânica – Rio de Janeiro/RJ – Brazil 2.Cranield University – School of Engineering – Cranield/Bedfordshire – United Kingdom.
Author for correspondence: Cesar Celis | Departamento de Engenharia Mecânica – Pontifícia Universidade Católica do Rio de Janeiro | Rua Marquês de São Vicente, 225 | CEP: 22.451-900 – Rio de Janeiro/RJ – Brazil | Email: [email protected]
TERA (Ogaji et al., 2007, 2009, 2010; Kyprianidis et al., 2008, 2009; Khan et al., 2009; Celis et al., 2008; Di Lorenzo et al., 2007), an idea conceived and developed by Cranfield University, is essentially a multi-disciplinary optimisation tool for quantifying risks and for comparing and ranking competing power plant schemes on a formal and consistent basis. TERA involves the use of several high fidelity preliminary design modules integrated with commercial/ in-house optimisers. TERA was primarily developed for determining optimum power plants for a given application. Recently, however, TERA has been also utilised for performing efficient aircraft trajectory multi-disciplinary optimisation processes accounting for physical and Air Traffic Control constraints (Celis et al., 2014). TERA has evolved over the years and it is currently utilised mainly as a tool to explore engine design spaces at a quick and efficient way. Nevertheless, the TERA philosophy is applicable to the different fields in which gas turbines are utilised (land, air, and sea). TERA as a tool is constantly updated and adapted with new algorithms and mathematical models which help to increase the level of reliability of the results obtained. The most important part of TERA is a detailed and rigorous thermodynamic representation of power plants, i.e. the engine performance module. Coupled to this module, other modules that model different disciplines, such as aircraft performance, economics, emissions, noise, weight etc., are utilized within the TERA framework. In this particular work, TERA has been utilised in conjunction with an in-house optimiser, i.e. oPtimisatiOn aLgorithms librarY for PHysical complEx MUlti-objective problemS (“Polyphemus”) (Celis et al., 2014), to carry out aircraft engine cycle optimisation processes. Polyphemus utilises genetic algorithms-based optimisation routines which do not use specific knowledge of the optimisation problem domain. This is a key-aspect as it allows that Polyphemus be both model and problem independent, satisfying in this way one of the main requirements of optimisation processes involving multi-model integration.
Shortly, Polyphemus has been implemented by using Java as the main programming language. Its core has been developed following the basic structure of the “SGA Java V1.03” by Hartley (Hartley, 1998), a Java implementation of the “simple GA” by Goldberg (1989). Nevertheless, the original model has been recoded and extensively modiied to both adapt it to engineering design optimisation problems and maximise its performance. he main modiications introduced relate to the
improvement of the optimisation performance, through an adaptation to the application domain (engineering design), and improvements in both the technique (introduction of concepts such as elitism, steady state replacement and itness scaling) and the genetic operators (crossover, mutation and selection) utilised during the optimisation process. Polyphemus uses a unique optimisation method based on Wienke’s idea of target vector optimisation (Wienke et al., 1992). Following this approach, designers can deine, for each parameter, a target to be attained, a range within which this parameter should remain, and the requirement to maximise or minimise the given parameter. he quality of the design is then determined from the achievement of the targets, the possibility of violation of ranges, and the optimisation of the selected parameters. his approach enables designers to have total control over the optimisation process with neither having to know very much about the optimisation algorithms, nor having to devise a itness function (Rogero and Rubini, 2003). Additional details of the Polyphemus optimiser can be found in Celis (2010) and Celis et al. (2009a, 2014).
The aircraft engine cycle optimisation processes carried out in this work focused mainly on the evaluation of the capabilities of Polyphemus for performing this type of optimisation processes. For the determination of optimum engine cycles then, simplifying hypotheses were considered when (i) defining the aircraft flight trajectory, and (ii) modelling the different engine configurations analysed. This afforded greater visibility on the characteristics of the Polyphemus performance when assessing results. This would have been more difficult if all complexities involving this type of optimisation processes had been considered. Accordingly, several optimum engine cycles minimising separately three objective functions, (i) specific fuel consumption (SFC) in cruise, (ii) fuel burned, and (iii) oxides of nitrogen (NOx) emitted, were determined. The main results of these optimisation processes are summarised here.
ENGINE CYCLE OPTIMISATION CASE
STUDIES
the main parameters used as design variables, constraints, and optimisation criteria during the optimisation processes.
OPTIMISATION STRATEGY
Generally, two broad optimisation strategies can be adopted for the optimisation of the preliminary design of aircrat/engine conigurations. Firstly, both the aircrat/engine coniguration and its associated light proile (light trajectory) can be optimised simultaneously (Antoine and Kroo, 2005; Antoine et al., 2004; Diedrich et al., 2006). In this approach, the optimisation of the light proile is usually treated as a sub-optimisation process. Accordingly, for each aircrat/engine coniguration evaluated (potential optimum design), an optimum light proile according to given criteria is determined. Due to the simultaneous optimisation of both aircrat/engine coniguration and light trajectory, this approach generally yields more representative results than the second simpliied one indicated next.
The second optimisation strategy is a simplification of the first one and involves the optimisation of the aircraft/ engine coniguration considering that the aircrat light proile is ixed. he main advantage of this second approach is that the computational time involved in the process is largely reduced. his reduction in computational time is proportional to several aspects including idelity of the computational models, type of optimisation technique, complexity of the trajectory optimisation problem, and light proile discretisation level. In the engine cycle optimisation processes performed in this work, this second optimisation strategy was utilised. he main reason behind this choice is the fact that natural limitations in computational time were present during the development of this work. his was supported by the fact that optimum trajectories (for a fixed aircraft/engine configuration) had already been determined (Celis, 2010). he main parameters characterising the ixed aircrat trajectory utilised in the optimisation processes described in this work are highlighted in Table 1.
In Table 1, h represents light altitude; M, Mach number; EAS, equivalent airspeed; and R, range. he subscripts i and f refer to, respectively, the start and end of the light trajectory segments. his aircrat trajectory corresponds to a three-objective (light time, fuel burned, and NOx emitted) optimised trajectory obtained from multi-objective optimisation processes carried out in a previous work (Celis, 2010). In short, this trajectory can be described as follows — 1st segment: climb at constant EAS (124.5 m/s) from 1,500 t (457 m) up to 10,000 t (3,048 m); 2nd segment: EAS acceleration at 10,000 t (level light) to 134.1 m/s EAS; 3rd segment: climb at constant EAS (134.1 m/s) up to an altitude where (cruise) M is about 0.8, i.e. 10,411 m; 4th and 5th segments: level light cruise at constant M (0.8); 6th segment: descent at constant EAS (134.1 m/s) to 10,000 t (3,048 m); 7th segment: EAS deceleration at 10,000 t (level light) to 128.6 m/s EAS; and inally, 8th segment: descent at constant EAS (128.6 m/s) from 10,000 t (3,048 m) to 1,500 t (457 m). his light trajectory has been considered fixed and has been used as the baseline trajectory for performing the engine cycle optimisation processes described here.
COMPUTATIONAL MODELS
In the optimisation processes, only three TERA computational models, i.e. the aircrat performance simulation model (APM), the engine performance simulation model (TurboMatch), and the emissions prediction model (Hephaestus), have been utilised. Figure 1 illustrates the general arrangement of these models, as well as the diferent parameters exchanged among them. he APM (Long, 2009) is a generic tool able to determine light path performance for a given aircrat design. APM uses steady state performance equations to resolve aerodynamic lit and drag and determines the thrust required for a given kinematic light state. In order to easily identify the behaviour of Polyphemus, airspeed limitations, such as critical M, never-exceed speed, and wave drag at transonic M, have not been implemented in the
Segment (no.) hi [m] hf[m] Mi [--] Mf [--] EASi[m/s] EASf[m/s] R[km]
1 457 3,048 -- -- 124.5 124.5 20 2 3,048 3,606 -- -- 124.5 134.1 10 3 3,606 10,411 -- -- 134.1 134.1 160 4 10,411 10,411 0.8 0.8 -- -- 230 5 10,411 10,411 0.8 0.8 -- -- 230 6 10,411 3,659 -- -- 134.1 134.1 140 7 3,659 3,048 -- -- 134.1 128.6 20 8 3,048 457 -- -- 128.6 128.6 70
model. Since APM uses end-points to compute performance, the user must declare a trajectory segment in terms of ground range and altitude intervals whereby a constant light path angle is then deined. Flight conditions are then assumed to be constant over that segment. he aircrat modelled in this work corresponds to a typical mid-sized, single-aisle, twin turbofan airliner with a maximum take of weight of about 72,000 kg and a seating capacity of about 150 passengers.
The performance of the engines was simulated using TurboMatch (Palmer, 1999), the in-house Cranield University gas turbine performance code that has been reined and developed over a number of decades. TurboMatch performance simulations range from simple steady state (design and of-design point) to complex transient performance computations. Finally, the gaseous emission predictions have been performed using the Cranield University emissions prediction sotware Hephaestus. An integral part of Hephaestus constitutes the emissions prediction model described in Celis et al. (2009b), which follows an approach based on the use of a number of stirred reactors for modelling combustion chambers and estimating the level of pollutants emitted from them. Additional details of these computational models can be found in Celis (2010) and Celis et al. (2009a).
DESIGN VARIABLES
he following cycle parameters have been utilised in this work as main design variables: overall pressure ratio (OPR), bypass ratio (BPR), and turbine entry temperature (TET). hese cycle parameters were chosen because they characterise the design of any turbofan engine — the particular type of engine (cycle) optimised in this work. In the optimisation processes, however, OPR was not directly used as a design variable. Instead, it was represented by the other three parameters that characterise OPR
in two- or three-spool (turbofan) engines: fan pressure ratio (FPR), booster or intermediate pressure compressor pressure ratio (IPCPR), and high pressure compressor pressure ratio (HPCPR). Top of climb (TOC) has been utilised in this work as the design point (DP) condition of the engines. Consequently, due to the aircrat trajectory light phase involving take of (TO) was not included in the analyses carried out, an additional design variable, TET at TO, was utilised in the optimisation processes. his last design variable was included in order to estimate parameters (detailed in the next section) that help to verify whether (or not) a given engine design satisies the engine requirements at TO (of design, OD) conditions. Table 2 summarises then the design variables (and the ranges of permissible values considered) utilised in the diferent case studies analysed in this work.
IMPLICIT CONSTRAINTS
During the optimisation, the following implicit constraints were imposed: thrust ratio (TR), compressor delivery temperature (CDT) at TO (CDTTO), height of blade (HBL) of the high pressure compressor (HPC) last stage at TO (HBLTO), and net thrust (FN) at DP and TO. TR, the ratio of TO thrust to cruise thrust (TOC in this work), is usually a requirement dictated by the airframe on which the engine is installed. Even so, in practice, some adjustments in TO thrust are possible as TO ield length
Models
Engine configuration Component characteristics
Flight conditions (M, h, FPA, R) Aircraft configuration (Initial mass)
Combustor geometry
Engine fuel flow Combustor (air) inlet conditions (W, T, P)
Flight conditions (M, h) Thrust required
Total flight time Total fuel consumed
Aircraft mass NOx mass CO2 mass H2O mass Flight conditions (h)
EINOx, EICO2, EIH2O Time
TURBOMATCH (Engine performance)
APM (Aircraft performance)
HEPHAESTUS (Emissions)
EI: emission index.
Figure 1. Computational model coniguration.
Table 2. Summary of design variables.
*Used for three-spool conigurations only.
Name Unit Lower bound Upper bound
FPR [--] 1.1 1.9 IPCR [--] 2.0 5.0 (15.0*) HPCPR [--] 5.0 (2.0*) 20.0 (15.0*)
varies. TR was used as a constraint in this work in order to guarantee that an optimised engine is able to provide the required TO thrust. hus, a TR lower limit of 4.5 was utilised. his value relects the performance of a typical turbofan, powering a mid-sized, single-aisle, twin turbofan airliner (maximum take of weight ≈ 72,000 kg) and delivering thrust levels of about 25 kN at TOC and 112.5 kN at TO. he CDTTO constraint relects, in turn, the level of technology, in terms of material capability, of the last stages of the HPC. his is one of the main limiters to the level of OPR that can be achieved in conventional turbofan engines. Excessive values of CDTTO would require the use of especial materials for the disc and blades of the HPC rear stages (which could increase the engine weight). In addition, high CDTTO values could also cause cooling problems due to the high temperatures of the cooling lows used for cooling the high pressure turbine (HPT) components. In the optimisation, an upper limit for the CDTTO of 950 K was considered.
Constant overall engine/nacelle dimensions were considered during the optimisation processes because of some limitations in the APM. his was made possible through the use of a ixed overall (engine) inlet mass low rate at DP. hus, high values of OPR and BPR will require eventually small blades at the rear of the HPC, which are known to be characterised by high aerodynamic losses because of the low Reynolds numbers, and the comparatively thick boundary layers on the annulus walls and high tip clearances (Whellens, 2003). In addition, because of their size, small blades may present manufacturing problems. It was necessary thus to constraint the HBLTO values. In this work, this parameter was estimated using the “swallowing function” (Eq. 1) and assuming a low M and a compressor hub/ tip ratio at the HPC delivery section of 0.3 and 0.9, respectively:
processes carried out. When just the irst three constraints indicated in Table 3 are utilised, the fact that the aircrat is able to ly the reference light trajectory, using a given engine design, is the only criterion determining (internally) the validity of the design. Consequently, it is recognised that some variations in FN at DP and/or TO may exist as a result of the optimisation processes. However, considering the main purpose of the optimisation processes performed, this was not seen as a critical issue. It is worth emphasising that these parameters (i.e. FN at DP and/or TO) were not initially constrained mainly because of the gradual approach, in terms of addition of complexities (e.g. number of implicit constraints), followed in this work.
where:
W: mass flow rate; T: temperature; P: pressure; A: low area; M: Mach number; Rg: speciic gas constant; γ: ratio of speciic heats of the gas. In the computations, a lower limit for the HBLTO of 15 mm was utilised.
Table 3 summarises the implicit constraints used in the diferent engine cycle optimisation processes performed, unless otherwise explicitly indicated. In this Table, the FN (at DP and TO) implicit constraints are marked with asterisks in order to highlight that they were used only in some of the optimisation
No. Constraint Limit(s)
1 TR ≥ 4.5 2 CDTTO ≤ 950 K 3 HBLTO ≥ 15 mm 4 FN ± 1% of 25.4 kN* 5 FN TO ± 1% of 121.4 kN**
Table 3. Summary of implicit constraints.
*Used in the computations of ICR engines; **used in the computations carried out in the “Further Results” section only.
PERFORMANCE PARAMETERS
Performance parameters are used for establishing the comparison criterion of several acceptable designs which ultimately allows the determination of the best design among many acceptable ones. his criterion, with respect to which the design is optimised, when expressed as a function of the design variables, is known as the criterion or merit or objective function. In this work, only single-objective engine cycle optimisation processes were carried out. his means that only single-objective functions were utilised. Since they have a direct inluence on the environmental impact of commercial aircrat operations, two of the three objective functions utilised in this work were fuel burned and NOx emissions. he third objective function involved the speciic fuel consumption in cruise (cruise SFC), which was computed averaging the SFC corresponding to segments 4 and 5 considered as cruise in the reference aircrat trajectory utilised (cf. Table 1). Several optimum engine cycles minimising separately these three objective functions, cruise SFC, fuel burned, and NOx emitted, were thus determined and the main results are summarised in this work.
ENGINE CYCLES
In this work, three engine cycles corresponding to three diferent aircrat engines (with separate exhausts), i.e. two-spool (1)
W√T
AP = M γ [1+(γ - 1)M2]
-(γ + 1) 2(γ - 1)
Rg 2
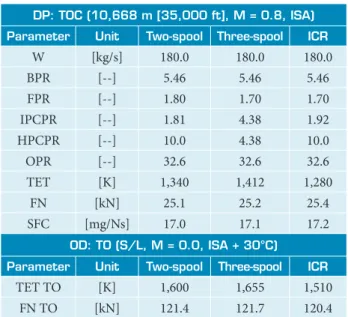
DP: TOC (10,668 m [35,000 ft], M = 0.8, ISA) Parameter Unit Two-spool Three-spool ICR
W [kg/s] 180.0 180.0 180.0 BPR [--] 5.46 5.46 5.46 FPR [--] 1.80 1.70 1.70 IPCPR [--] 1.81 4.38 1.92 HPCPR [--] 10.0 4.38 10.0 OPR [--] 32.6 32.6 32.6 TET [K] 1,340 1,412 1,280
FN [kN] 25.1 25.2 25.4 SFC [mg/Ns] 17.0 17.1 17.2
OD: TO (S/L, M = 0.0, ISA + 30°C) Parameter Unit Two-spool Three-spool ICR
TET TO [K] 1,600 1,655 1,510 FN TO [kN] 121.4 121.7 120.4
Table 4. Baseline engine characteristic parameters.
turbofan engine, three-spool turbofan engine, and (two-spool) Intercooled Recuperated Turbofan (ICR) engine, were studied. hese engines were selected because they represent potential engines that could be eventually utilised in regional aircrat conigurations similar to that analysed in this work. Table 4 details the main parameters characterising the engines used as reference or baseline during the optimisation processes. In this table, W represents the overall (engine) inlet (air) mass low rate. Table 4 shows that the engine condition used as DP condition corresponded to TOC (10,668 m [35,000 t], M = 0.8, International Standard Atmosphere - ISA), implying, in this way, that TO (sea level [S/L], M = 0.0, ISA +30°C) was treated as an OD point engine condition.
For the design of the two-spool baseline engine (Table 4), an iterative process involving engine simulations at DP and OD point conditions was utilised in order to match the performance of the engine model with data obtained from the public domain for an aircrat engine (high BPR, two-spool turbofan engine with separate exhausts) used in similar applications. Similarly, for the design of the three-spool and ICR baseline engines, iterative processes involving engine simulations at DP and OD point conditions were used in order to match the thrust requirements of the engine models with those corresponding to the two-spool baseline engine initially designed. During the design of these baseline engines, when necessary, educated guesses were made for some characteristic parameters (component eiciencies, bleeding lows, pressure losses etc.), which were required for the modelling of the engines. Accordingly, in order to take into account the state of the
art associated with the design of the main components of aircrat engines, namely compressors and turbines, appropriate component polytropic eiciencies which attempt to relect the current level of technology in this ield were assumed. hese eiciencies, which remained constant at DP during the optimisation, were equal to: 0.93 in the particular case of the fan, 0.91 for the intermediate pressure compressor (IPC) and HPC, 0.88 for the HPT, 0.89 for the intermediate pressure turbine (IPT, used only for three-spool conigurations), and 0.90 for the low pressure turbine (LPT).
It is relevant to note that the main purpose of the engine cycle optimisation processes carried out in this work was the evaluation of the capabilities of Polyphemus to perform these types of processes. Simpliications were thus introduced into all optimisation processes when both deining the aircrat light trajectory (e.g. small number of trajectory segments, limited number of light phases, standard atmospheric conditions etc.) and modelling the diferent engine configurations (e.g. constant nacelle/engine dimensions and weight, limited number of map of characteristics for compressors and turbines, simpliied algorithms for pollutant formation etc.). It follows then that, when analysing the results obtained from the optimisation processes, it is considered that general trends are more reliable than absolute values.
In the engine cycle optimisation processes performed, the following four main hypotheses were considered:
• Aircrat light altitudes and speeds are constant. • Aircraft configuration (dimensions, weight etc.) is
ixed. In other words, the aircrat is not resized during the optimisation processes. his hypothesis was used mainly because the APM can handle only ixed aircrat/ engine conigurations.
• Aircrat engine (nacelle + engine) dimensions and weight remain constant regardless of the variations in the engine thermodynamic cycle characteristic parameters. his was hypothesised partially because engine weight models were not used in this work. • Total aircrat weight (aircrat empty weight + engine
weight + fuel on-board) at the beginning of the light profile is constant. It implies that fuel on-board is enough for lying the light proile using any engine design. This hypothesis avoids the use of iterative processes during the optimisation.
• Case 1: two-spool turbofan optimisation. In the irst case study, engine cycle optimisation processes involving a two-spool turbofan engine with separate exhausts were carried out. he parameters used as design variables in this case corresponded to those described in Table 2. As implicit constraints, in turn, only the irst three parameters indicated in Table 3 (TR, CDTTO, and HBLTO) were utilised. • Case 2: three-spool turbofan optimisation. Optimisation
processes involving a three-spool turbofan engine cycle with separate exhausts were performed in this case. he design variables and constraints were the same as in the irst case study. he only diference related to the ranges of permissible values of two of the design variables (IPCPR and HPCPR), which were slightly modiied. his was done in order to relect the fact that these parameters may have a similar order of magnitude. • Case 3: intercooled recuperated turbofan optimisation.
In the third case study, the thermodynamic cycle of an ICR two-spool turbofan engine with separate exhausts was optimised. In addition to the design variables and constraints used in the irst two case studies, and additional implicit constraint, i.e. FN at DP, was imposed in this case (cf. Table 3). It was additionally assumed that: (i) the use of intercooling and recuperation systems does not imply variations in the engine dimensions; (ii) the ICR engine is 50% heavier than a conventional one used for similar purposes; (iii) the heat exchangers produce additional pressure losses of 3% (each one); and (iv) the heat exchangers’ efectiveness is about 90%. hese assumptions attempted to relect a typical scenario where ICR engines might be utilised.
In addition to the optimisation processes performed as part of the case studies mentioned, in order to compare the three engine cycles analysed in these cases, other optimisation processes were also carried out. In these processes, for allowing a fair comparison among the engine cycles, additional implicit constraints were imposed when required. hese constraints related to FN at DP and TO. As indicated in Table 3, the ranges of permissible values in which these two constraints were allowed to vary corresponded to ± 1% of their corresponding nominal values. hese nominal values were taken, in turn, from the respective values of FN at DP and TO (cf. Table 4; DP: 25.1 kN, TO: 121.4 kN) associated with the baseline two-spool engine, which was also considered as baseline engine in this comparison process. he main results obtained from this comparison process are also presented and discussed in this work.
RESULTS AND DISCUSSIONS
he main results of the optimisation processes corresponding to the three case studies indicated in the Engine Cycles section are summarised in this section.
CASE 1: TWO-SPOOL TURBOFAN OPTIMISATION
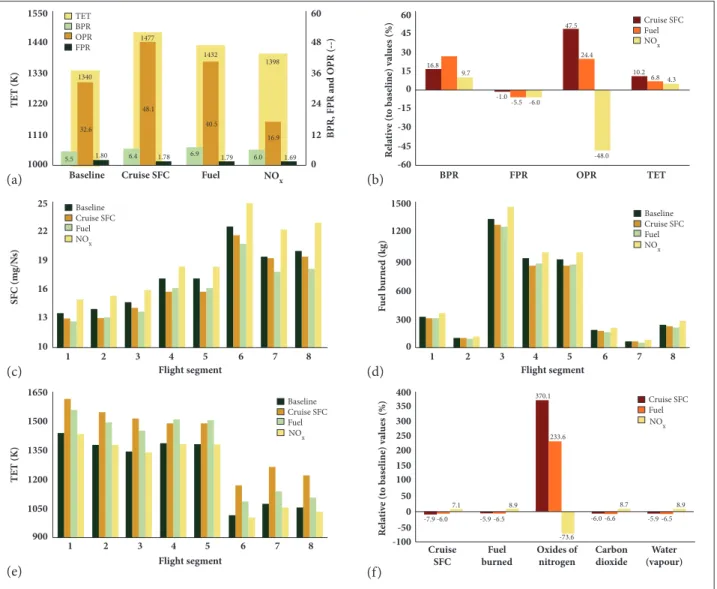
The results obtained from the optimisation processes carried out in this irst case study are summarised in Fig. 2. More specifically, the main parameters characterising the thermodynamic cycle of the baseline engine and the optimum engines computed are shown in Fig. 2a. These same parameters, when expressed in relative terms using the characteristic parameters of the baseline engine, are illustrated in Fig. 2b. In turn, Figs. 2c, 2d and 2e show, respectively, the SFC, fuel burned and TET characterising each segment of the aircraft trajectory flown using the baseline and the three optimum engines determined. Finally, Fig. 2f shows a comparison of the main results associated with the three optimised engines determined in this first case study. As noticed in Fig. 2f, the three optimum engines computed led to (relatively) significant reductions in cruise SFC (~ -8%), fuel burned (~ -7%), and NOx emitted (~ -70%). From this figure, one can see as well that the variations in carbon dioxide and water vapour emissions are directly proportional to the variations in the amount of fuel burned (species in chemical equilibrium). This last situation repeats itself in all of the case studies analysed in this work.
Figure 2. Case 1 — Two-Spool turbofan optimisation results.
optimised in these case studies, however, it is not possible to increase BPR indeinitely because of the constraints imposed when deining the optimisation problem. Since the overall inlet air mass low rate is ixed in this work, increases in BPR imply reductions in engine core mass low rate. his, in turn, translates into higher OPR and/or TET values to cope with the higher work required from the core low to move the larger amount of air that bypasses the core engine. As when OPR and TET are increased for better thermal eiciency, better compressor and turbine materials are required in these situations to cope with the increases in both CDT and TET. In addition, very high values of OPR and BPR will also require eventually small blades at the rear of the HPC.
Accordingly, as illustrated in Fig. 2a, the cruise SFC optimised engine is characterised by relatively high values of TET and OPR,
which improves the engine thermal eiciency, and, consequently, reduces the engine cruise SFC. he results suggest that the BPR has been increased only to an extent in which the reduced core low can cope with the work required by the fan under conditions of maximum OPR, which seems to have been established by restrictions in the maximum value of CDT (at TO) allowed in the process. Engine TET, in turn, seems to be a compromise between increasing its value — in order to augment the engine thermal eiciency and, hence, SFC — and reducing it in order to diminish propulsive eiciency degradations, and, consequently, increases in SFC. As expected, Fig. 2c shows that segments 4 and 5 exhibit the lowest SFC values. his is an obvious result once the cruise SFC optimisation involved the minimisation of a parameter computed averaging the SFC corresponding to these two segments considered as cruise in this work.
Baseline Cruise SFC Fuel Baseline Cruise SFC Fuel TET BPR OPR FPR Baseline Cruise SFC Fuel Cruise SFC Fuel Cruise SFC Fuel NOx
NOx NO
x
NOx NOx
-7.9 -5.9 -6.5
-73.6 8.9 233.6 370.1 -5.9 -6.5 8.9 -6.0 -6.6 8.7 -6.0 7.1 -48.0 -1.0 -5.5 -6.0 9.7 1.69 16.9 1398 6.0 1.79 40.5 1432 6.9 1.78 48.1 1477 6.4 1.80 32.6 1340 5.5 16.8 10.2 6.8 4.3 24.4 47.5 Flight segment 1 900 -100 -50 0 50 100 150 200 250 300 350 400 0 300 600 900 1200 1500 -60 -45 -30 -15 0 0 12 24 36 48 60 15 30 45 60 1050 1200 1350 1500 1650 10 13 16 19 22 25 1000 1110 1220 1330 1440 1550
2 3 4 5 6 7 8
1
Baseline Cruise SFC Fuel NOx BPR FPR OPR TET
2 3 4 5 6 7 8 1 2 3 4 5 6 7 8
he fuel optimised engine results are similar to those ones obtained for the case in which the cruise SFC was minimised. his is expected, of course, once the objective functions are similar as well. he biggest diference between these two functions is that, when optimising for minimum fuel burned, the SFC corresponding to all trajectory segments is minimised and not only the SFC in cruise (as when optimising for minimum cruise SFC). Strictly speaking, minimisation of fuel burned implies minimisation of fuel mass low rate (ixed light proile and aircrat speeds, and hence segment light times). However, due to SFC and fuel mass low rate are directly related, minimisation of fuel burned can be also regarded as minimisation of SFC at all trajectory segments. Therefore, the main parameters driving the cruise SFC optimisation also play an important role when designing a turbofan engine for minimum fuel burned. Consequently, the fuel optimised engine is also characterised by relatively high values of OPR and TET (Fig. 2a). Regarding BPR, the results show that, when optimising for minimum fuel burned, there is a further increase in BPR, which leads to improvements in propulsive eiciency, and, consequently, SFC reductions in almost all segments of the light trajectory. Figure 2d shows that the fuel optimised engine presents the lowest fuel consumption in all trajectory segments (except in cruise segments 4 and 5, where the cruise SFC optimised engine does), which yields, consequently, the lowest overall fuel burned. here are four main parameters that afect NOx emissions which are directly or indirectly related to the engine operating conditions. hese parameters are lame temperature, combustor air inlet temperature, air/fuel ratio and combustor air inlet pressure. Accordingly, a conventional engine optimised for minimum NOx emissions is expected to be characterised by both a relatively low combustor air inlet temperature (i.e. a low CDT and, consequently, a low OPR) and a relatively low combustor air inlet pressure (i.e. a low OPR). At the same time, the NOx optimised engine is expected to be operated using as low TET values as possible. All these aspects are conirmed by the results associated with the engine optimised for minimum NOx emissions. hus, as observed in Fig. 2a, this engine presents the lowest OPR and TET of the three optimum engines computed. In addition, the engine BPR is slightly lower than those ones corresponding to the other two optimised engines. his allowed that the reduced OPR core low provide the work demanded by the engine fan. As expected, the relatively low OPR and TET characterising the NOx optimised engine worsened its SFC. his is relected in the high values of SFC and fuel burned characterising each
aircrat trajectory segment. When compared to the other engines computed, the engine optimised for minimum NOx presents the highest SFC (Fig. 2c) and fuel burned (Fig. 2d) values at each trajectory segment. Even so, the NOx optimised engine TET values at each light segment are the lowest ones (Fig. 2e). his, of course, translated into low NOx emissions at each light segment and, consequently, in the lowest overall NOx emissions characterising this optimised engine. On the contrary, the relatively high OPR and TET values characterising the cruise SFC and fuel optimised engines produce signiicant increases in NOx emissions and reductions in fuel burned (Fig. 2f). Similar analyses to those ones carried out in this irst case study will be performed in the remaining case studies.
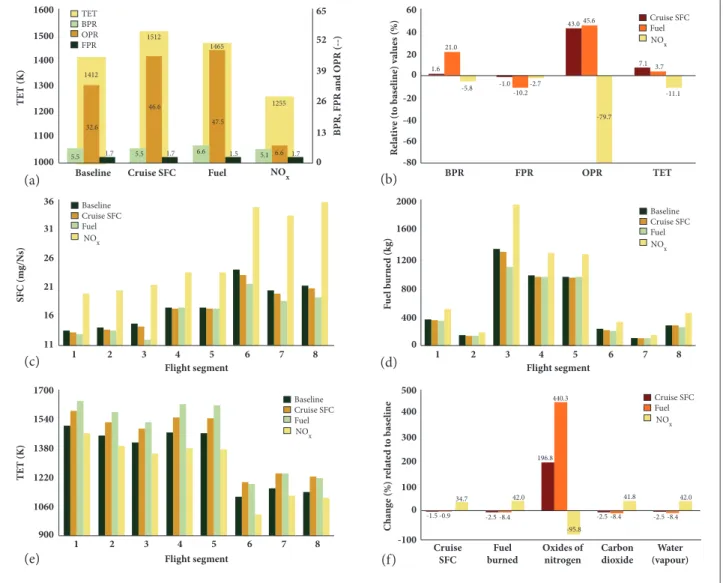
CASE 2: THREE-SPOOL TURBOFAN OPTIMISATION
Figure 3 illustrates the main results obtained when determining the optimum engines computed in this second case study. Since the same type of plots presented in Fig. 2 is included in this igure, a detailed description of Fig. 3 plots is not included in this section. hus, as visualised in Fig. 3f, the cruise SFC optimised engine yielded only an small improvement in cruise SFC (~ -2%), while the other two optimum engines computed, similar to the two-spool case, led to relatively signiicant reductions in fuel burned (~ -8%) and NOx emitted (~ -95%). In general, the three-spool engine optimisation results are similar to the corresponding two-spool ones. Thus, only the main features of the results obtained in this case study will be highlighted. As in the irst case study, the three-spool engine optimised for minimum cruise SFC is characterised by relatively high values of TET and OPR (Fig. 3a). Since BPR increases generally lead to improvements in propulsive eiciency and, consequently, reductions in SFC, the BPR of the cruise SFC optimised engine is slightly higher than the baseline engine BPR.
engine presents the lowest fuel consumption in almost all trajectory segments and thus the lowest overall fuel burned.
All main features characterising two-spool engines optimised for minimum NOx also characterise three-spool ones. Thus, as verified in Fig. 3a, the NOx optimised engine presents the lowest OPR and TET of the three optimum engines computed. In addition, the engine BPR is lower than both the BPR values corresponding to the other two optimised engines and the baseline engine BPR. The considerable reduction in OPR seems to have been compensated by this BPR decrease, which allowed that the reduced OPR core flow be able to generate the work required for driving the engine fan. The significant reductions in OPR and TET observed in the case of the NOx optimised engine produced large increases in the engine SFC at each aircraft trajectory
segment (Fig. 3c) and, consequently, in the corresponding fuel burned (Fig. 3d). The relatively low values of OPR, TET and BPR characterising the engine optimised for minimum NOx are therefore mainly responsible for the low levels of NOx emitted at each flight segment, and, consequently, for the lowest overall NOx emissions that characterise this optimum engine (Fig. 3f ).
CASE 3: INTERCOOLED RECUPERATED TURBOFAN OPTIMISATION
he results associated with the main parameters characterising the baseline and the optimum engines determined in the ICR engine case study are shown in Fig. 4. For details about the particular plots included in this igure, see the description of Fig. 2 plots. In particular, as observed in Fig. 4f, all three optimum engines
Baseline Cruise SFC Fuel Baseline Cruise SFC Fuel TET BPR OPR FPR Baseline Cruise SFC Fuel Cruise SFC Fuel Cruise SFC Fuel NOx NOx NOx NOx NOx
-1.5 -2.5 -8.4
-95.8 42.0 196.8 440.3 -2.5 -8.4 42.0 -2.5 -8.4 41.8 -0.9 34.7 -79.7 -1.0 -10.2 -2.7 -5.8 21.0 1.7 6.6 1255 5.1 1.5 47.5 1465 6.6 1.7 46.6 1512 5.5 1.7 32.6 1412 5.5
1.6 7.1 3.7
-11.1 43.0 45.6 Flight segment 1 900 -100 0 100 200 300 400 500 0 400 800 1200 1600 2000 -80 -60 -40 -20 0 13 26 39 52 65 0 20 40 60 1060 1220 1380 1540 1700 11 16 21 26 31 36 1000 1100 1200 1300 1400 1500 1600
2 3 4 5 6 7 8
1
Baseline Cruise SFC Fuel NOx BPR FPR OPR TET
2 3 4 5 6 7 8 1 2 3 4 5 6 7 8
Flight segment TE T (K) S FC (m g/N s) TE T (K) C ha n
ge (%) r
el at ed t o b as eline F u el b urne d (kg) R el at iv e (t o b as eline) va lu es (%) B P R , FP R a nd O P R (--) Flight segment Cruise SFC Fuel burned Oxides of nitrogen Carbon dioxide Water (vapour)
Figure 3. Case 2 — Three-spool turbofan optimisation results.
(a) (b)
(c) (d)
Figure 4. Case 3 — Intercooled recuperated turbofan optimisation results. Baseline Cruise SFC Fuel Baseline Cruise SFC Fuel TET BPR OPR FPR Baseline Cruise SFC Fuel Cruise SFC Fuel Cruise SFC Fuel NOx
-12.2 -13.5-14.1
-64.0 -8.1 141.4 343.6 -13.5 -8.1 -14.2 -13.6 -14.3-8.0 -12.0-8.0 -49.3 -3.5 -6.3 -2.8
1.3 45.3 1.7 16.5 1325 5.5 1.6 26.2 1642 7.9 1.6 26.4 1529 7.4 1.7 32.6 1280 5.5 36.3 19.4 28.3 3.5 -19.0 -19.5 Flight segment 1 800 -100 0 100 200 300 400 0 300 600 900 1200 1500 -60 -45 -30 -15 0 20 10 30 40 50 60 0 15 30 45 60 1000 1200 1400 1600 1800 10 13 16 19 22 25 700 900 1100 1300 1500 1700
2 3 4 5 6 7 8
1
Baseline Cruise SFC Fuel NOx BPR FPR OPR TET
2 3 4 5 6 7 8 1 2 3 4 5 6 7 8
Flight segment TE T (K) S FC (m g/N s) TE T (K) R el at iv e (t o b as eline) va lu es (%) F u el b urne d (kg) R el at iv e (t o b as eline) va lu es (%) B P R , FP R a nd O P R (--) Flight segment Cruise SFC Fuel burned Oxides of nitrogen Carbon dioxide Water (vapour) NOx NOx NOx NOx
computed yield relatively signiicant reductions in cruise SFC (~ -12%), fuel burned (~ -14%) and NOx emitted (~ -65%). Unlike conventional (two- or three-spool) engines and due to ICR engines ofer higher eiciencies, and hence lower SFC values, with lower values of OPR (Saravanamuttoo et al., 2009; Boggia and Rüd, 2005), both the ICR engine optimised for minimum cruise SFC and the fuel optimised one are characterised by relatively high values of TET and only moderate OPR values (Fig. 4a). his is because these two factors contribute to the improvement of both engine thermal eiciency and efectiveness of the heat exchange processes and, consequently, to the reduction of SFC and fuel burned. TET seems to be a compromise between (i) increasing its value to improve thermal eiciency and heat exchange’s efectiveness and, hence, SFC; and (ii) reducing it to avoid signiicant reductions in propulsive eiciency that can worsen SFC.
Figure 4a also shows that the BPR associated with the cruise SFC optimised engine is higher than the baseline engine BPR. An aspect that may have also a certain contribution to the increase in BPR is the reduction in compression work originated by both the reduction in OPR and the use of an intercooling process. When compared to the other optimum engines computed in this case study, the results show that the engine optimised for minimum fuel burned presents the highest BPR. hese results are consistent with those associated with conventional engines (Figs. 2 and 3). he relatively high value of BPR used in the fuel optimised engine, together with the relatively high value of TET and moderate OPR (Fig. 4a), results in SFC reductions in almost all segments of the light trajectory (Fig. 4c). his, of course, leads to the lowest overall fuel burned that characterises this ICR engine (Fig. 4f).
(a)
(c)
(b)
(d)
Conventional engines optimised for minimum NOx emissions are expected to be characterised by relatively low values of combustor air inlet temperature, combustor air inlet pressure, and TET. In the case of ICR engines, air inlet temperature is mainly related to both CDT (and hence to OPR) and TET (through the recuperation system utilised). Air inlet pressure, in turn, is directly related to OPR. Accordingly, low values of combustor air inlet temperature and pressure mean low values of OPR and TET. Observing the results shown in Fig. 4a, it is possible to see that relatively low values of OPR and TET is indeed one of the characteristics of the ICR engine optimised for minimum NOx emissions. As shown in this igure, the NOx optimised engine presents the lowest OPR and TET of the three optimum engines computed. Regarding BPR, the results show that this parameter is roughly the same as in the case of baseline engine and lower than those values of BPR corresponding to the other two optimised engines. Similar to conventional engines, ICR engines optimised for minimum NOx emissions present relatively high SFC values at each aircrat trajectory segment (Fig. 4c), and cruise SFC and fuel optimised ones produce signiicant increases in NOx emissions (Fig. 4f).
FURTHER RESULTS
When analysing diferent engine cycles, it is important to ind a means of comparing the diferent results obtained. his section describes therefore results showing a comparison of the three engine cycles analysed before. For this purpose, the baseline two-spool engine was considered as reference or baseline engine. For brevity, only one of the three objective functions usually utilised in the previous analyses, fuel, was used in the single-objective optimisation processes performed for comparison purposes. All other details associated with the optimisation of each particular engine coniguration remained the same. As highlighted in the Engine Cycles section, the only diference related to the inclusion of the FN at DP and TO implicit constraints where required. The results of the comparison process of the three engine cycles are summarised in Fig. 5. In particular, the main cycle parameters associated with both the two-spool baseline engine and the three engine conigurations optimised for minimum fuel burned are given in Fig. 5a. hese same parameters, when expressed in relative terms, using the characteristic parameters of the two-spool baseline engine, are illustrated in Fig. 5b. In addition, Figs. 5c and 5d show, respectively, the SFC characterising each segment of the aircrat trajectory, and the main results associated with
CONCLUSIONS
In this work, the Techno-economic Environmental Risk Analysis (TERA) framework, an idea conceived and developed by Cranield University, was utilised in conjunction with an in-house optimiser (i.e. Polyphemus) to carry out aircrat engine cycle optimisation processes. he optimisation processes focused primarily on the evaluation of the capabilities of Polyphemus for performing this type of optimisation processes. For the determination of optimum engine cycles then, simpliications were introduced into the optimisation processes when both defining the aircraft flight trajectory and modelling the diferent engine conigurations analysed. Accordingly, several optimum engine cycles minimising separately three objective functions, cruise SFC, fuel burned, and NOx emitted, were determined. he optimum engine cycles results showed that conventional two- or three-spool engines optimised for minimum cruise SFC and fuel burned are characterised by relatively high values of TET, OPR, and BPR. Since these parameters directly inluence the level of NOx emitted, conventional (two- or three-spool) engines optimised for minimum NOx emissions are characterised by relatively low values of OPR and TET. ICR engines optimised for both minimum cruise SFC and minimum fuel burned are also characterised by relatively high values of
TET, but only moderate OPR values. Further reductions in OPR characterise minimum NOx emissions ICR optimised engines. Regarding BPR speciically, the ICR engine results obtained were consistent with the conventional engines ones. he engine cycle optimisation processes carried out yielded optimum results that relect the general trends that could be expected when optimising according to the objective functions used in this work. It follows then that Polyphemus is suitable for carrying out this type of optimisation processes. his, of course, provides the necessary motivation for continuing with the development of the Polyphemus optimiser. As future work, in order to further elucidate the actual Polyphemus capabilities, optimum results obtained using this optimiser will be compared with known optimum solutions obtained using other well-accepted optimisers. It is expected then that Polyphemus be used in future for both determining optimum and “greener” aircrat engine cycles and optimising the preliminary design of this type of engines.
ACKNOWLEDGEMENTS
During this work, Cesar Celis was partially supported by the Programme Alβan, the European Union Programme of High Level Scholarships for Latin America, Scholarship
Flight segment
Cruise SFC
Baseline Two-spool Three-spool ICR
Fuel burned
Oxides of nitrogen
Carbon dioxide
Water (vapour)
F
u
el b
urne
d (kg)
R
el
at
iv
e (t
o Bas
eline) va
lu
es (%)
1 0 300 600 900 1200 1500
B
P
R
, FP
R a
nd O
P
R (--)
TE
T (K)
1000 1110 1220 1330 1440 1550
0 12 24 36 48 60
2 3 4 5 6 7 8 -60
0
-10.6 -8.8-1.8 -10.6 -8.7-1.8 -10.6
255.4 1465
1445
1340
1473
190.4
-8.7-1.7 -9.6 -6.00.0 60 100 150 200 250 300
-39.0
BPR FPR OPR TET
R
el
at
iv
e (t
o Bas
eline) va
lu
es (%)
-45 -30 -15 0 15 30 45
-42.6 -5.5
24.2
2.9
17.0 21.8
34.9
7.8 9.9 9.4
-10.0 -10.5
5.5 1.80 6.8 1.70 5.6 1.62 6.4 1.61 32.6 39.7
44.0
18.7
Baseline Two-spool hree-spool ICR
Two-spool hree-spool ICR Two-spool hree-spool ICR TET
BPR OPR FPR
Figure 5. Comparison of engines — optimum engine cycles results.
(a) (b)
REFERENCES
Antoine, N.E. and Kroo, I.M., 2005, “Framework for Aircraft Conceptual Design and Environmental Performance Studies”, AIAA Journal, Vol. 43, No. 10, pp. 2100-2109.
Antoine, N.E., Kroo, I.M., Willcox, K. and Barter, G., 2004, “A Framework for Aircraft Conceptual Design and Environmental Performance Studies”, Proceedings of the AIAA-2004-4314, 10th AIAA/ISSMO Multidisciplinary Analysis and Optimization Conference, Albany, USA.
Boggia, S. and Rüd, K., 2005, “Intercooled Recuperated Gas Turbine Engine Concept”, Proceedings of the AIAA 2005-4192, 41st AIAA/ASME/SAE/ASEE Joint Propulsion Conference & Exhibit, Tucson, USA.
Celis, C., 2010, “Evaluation and Optimisation of Environmentally Friendly Aircraft Propulsion Systems”, Ph.D. Thesis, Cranield University, Cranield, United Kingdom.
Celis, C., Long, R., Sethi, V. and Zammit-Mangion, D., 2009a, “On Trajectory Optimisation for Reducing the Impact of Commercial Aircraft Operations on the Environment”, Proceedings of the 19th Conference of the International Society for Air Breathing Engines, ISABE-2009, Montréal, Canada.
Celis, C, Moss, B. and Pilidis, P., 2009b, “Emissions Modelling for the Optimisation of Greener Aircraft Operations”, Proceedings of the GT2009, ASME Turbo Expo 2009, Power for Land, Sea and Air, Orlando, USA.
Celis, C., Mohseni, M., Kyprianidis, K., Sethi, V., Ogaji, S., Haslam, A. and Pilidis, P., 2008, “Multidisciplinary Design Optimization of Aero Engines: Environmental Performance-based Methodology”, Proceedings of the International Symposium on Compressor & Turbine Flow Systems − Theory & Application Areas, SYMKOM’08, Lodz, Poland.
Celis, C., Sethi, V., Zammit-Mangion, D., Singh, R. and Pilidis, P., 2014, “Theoretical Optimal Trajectories for Reducing the Environmental Impact of Commercial Aircraft Operations”, Journal of Aerospace Technology and Management, Vol. 6, No. 1, pp. 29-42. doi: 10.5028/jatm.v6i1.288
Di Lorenzo, G., Friconneau, V., Brandt, P., Lonneux, V., Marinai, L., Pilidis, P. and Ruiz-Olalla, G., 2007, “Technoeconomic Environmental Risk Analysis – Technological Perspective Application to Low Carbon Plant”, Proceedings of the 4th IDGTE Gas Turbine Conference ‘Gas Turbine Technology in a Carbon Constrained World’, Milton Keynes, United Kingdom.
Diedrich, A., Hileman, J., Tan, D., Willcox, K. and Spakovszky, Z., 2006, “Multidisciplinary Design and Optimization of the Silent Aircraft”, Proceedings of the AIAA 2006-1323, 44th AIAA Aerospace Sciences Meeting, Reno, USA.
Goldberg, D.E., 1989, “Genetic Algorithms in Search, Optimization and Machine Learning”, Addison-Wesley, Reading, USA.
Hartley, S.J., 1998, “Concurrent Programming: The Java Programming Language”, Oxford University Press, New York, USA.
Khan, R., Barreiro, J., Lagana, M. C., Kyprianidis, K., Ogaji, S., Pilidis, P. and Bennett, I., 2009, “An Assessment of the Emissions and Global Warming Potential of Gas Turbines for LNG Applications”, Proceedings of the GT2009, GT2009-59184, ASME Turbo Expo 2009, Power for Land, Sea and Air, Orlando, USA.
Kyprianidis, K., Au, D., Ogaji, S. and Grönstedt, T., 2009, “Low Pressure System Component Advancements and its Impact on Future Turbofan Engine Emissions”, Proceedings of the 19th Conference of the International Society for Air Breathing Engines, ISABE-2009-1276, Montréal, Canada.
Kyprianidis, K.G., Di Lorenzo, G., Ogaji, S., Pilidis, P., 2008, “The TERA Approach – A Methodology for Techno-economical, Environmental and Risk Analysis of Multidisciplinary Systems”, Cranield University Multi-Strand Conference, Cranield, United Kingdom.
Long, R.F, 2009, “An Aircraft Performance Model for Trajectory Optimisation”, Cranield University, United Kingdom (unpublished).
Ogaji, S., Pilidis, P. and Hales, R., 2007, “TERA - A Tool for Aero-engine Modelling and Management”, Proceedings of the 2nd World Congress on Engineering Asset Management and 4th International Conference on Condition Monitoring, Harrogate, United Kingdom.
Ogaji, S., Pilidis, P. and Sethi, V., 2009, “Advanced Power Plant Selection: The TERA (Techno-economic Environmental Risk Analysis) Framework”, Proceedings of the 19th Conference of the International Society for Air Breathing Engines, ISABE-2009-1115, Montréal, Canada.
Ogaji, S., Sethi, V., Pilidis, P, Singh, R., Celis, C., Di Lorenzo, G., and Zammit-Mangion, D., 2010, “Power Plant Selection and Deployment: The TERA (Technoeconomic Environmental Risk Analysis)”, Proceedings of the 5th European Turbine Network (ETN) International Gas Turbine Conference, The Future of Gas Turbine Technology, Brussels, Belgium.
Palmer, J.R., 1999, “The TurboMatch Scheme for Gas-Turbine Performance Calculations: User’s Guide”, Cranield University, Cranield, United Kingdom.
Rogero, J.M. and Rubini, P.A., 2003, “Optimisation of Combustor Wall Heat Transfer and Pollutant Emissions for Preliminary Design Using Evolutionary Techniques”, Proceedings of the Institution of Mechanical Engineers, Part A: Journal of Power and Energy, Vol. 217, No. 6, pp. 605-614. doi: 10.1177/095765090321700607
Saravanamuttoo, H.I.H., Rogers, C.F.G., Cohen, H. and Straznicky, P.V., 2009, “Gas Turbine Theory”, 6th Edition, Pearson Prentice Hall, Harlow, England.
Whellens, M.W., 2003, “Multidisciplinary Optimisation of Aero-Engines Using Genetic Algorithms and Preliminary Design Tools”, Ph.D. Thesis, Cranield University, Cranield, United Kingdom.
Wienke, D., Lucasius, C.B. and Kateman, G., 1992, “Multicriteria Target Vector Optimization of Analytical Procedures Using a Genetic Algorithm. Part I. Theory, Numerical Simulation and Application to Atomic Emission Spectroscopy”, Analytica Chimica Acta, Vol. 265, No. 2, pp. 211-225. doi: 10.1016/0003-2670(92)85027-4
No. E07D400097BR. The authors would like to extend their gratitude to both Mr. Richard Long, who developed the APM utilised, and Dr. Jean-Michel Rogero, whose PhD research