*e-mail: [email protected]
FTIR Study of the Relation, between Extra-framework Aluminum Species and the
Adsorbed Molecular Water, and its Effect on the Acidity in ZSM-5 Steamed Zeolite
Luis Fioravanti Isernia*
Laboratorio de Tamices Moleculares, Universidad de Oriente – UO, Maturín, Monagas, Venezuela
Received: September 21, 2011; Revised: December 30, 2012
The infrared spectroscopy study of zeolite samples, obtained by steam treatment at 560-960 °C of the ZSM-5 catalyst (framework Si/Al ratio of 13), suggests an association between adsorbed molecular water and extra-framework aluminum hydroxyls generated after treatment. Moreover, infrared spectroscopy of adsorbed pyridine shows the reduction of the densities of Brönsted and Lewis sites, when treatment temperature rises, with contradicts the frequently accepted mechanism of the transformation of two bridged Si-OH-Al groups for each Lewis site generated. The gradual conversion of the octahedral extra-framework aluminum (Lewis-associated) in polymeric species with low acidity is the most probable cause of this behavior. On the other hand, the apparent decline of the acid Brönsted strength, with the increase in the temperature of the hydrothermal treatment, has two possible causes: a) the decreasing accessibility, of the pyridine molecular probe to bridged Si-OH-Al groups with the strongest Brönsted acidity, inside the channels, and b) the gradual transformation of these groups into extra framework species of weak acidity.
Keywords: hydrothermal dealumination, infrared spectroscopy, ZSM-5 zeolite, Brönsted and Lewis sites
1. Introduction
The zeolite-based catalysts, subjected to high temperature water steam regeneration cycles, undergo a partial exit of tetrahedral coordinated aluminum, out of the crystalline network and the gradual decrease of the catalytic activity by reduction of the number of acid sites.
In the presence of excess steam the disappearance of two bridged (Si-OH-Al) sites for each Lewis site generated is frequently reported. Several authors have propused1-5 that the
interaction between two bridged Si-OH-Al sites, associated6
with Brönsted acidity, generate an extra-framework Al(OH)2+ (or AlO+), which has been considered7-9 as the
true carrier of Lewis acidity. It is generally accepted that the extra-framework aluminum (EFAL) generated after hydrothermal treatment is deposited in the form of 4, 5 and 6 coordinate monomeric species10,11, where 5 and 6
are related with the Lewis acidity in zeolites. On the other hand, the formation of four-coordinate polymeric aluminum species of low acidity on the surface zeolite crystals, has been reported1,12.
Zeolite MFI is an interesting shape-selective solid acid catalyst. However, despite their widespread use in a variety of petrochemical processes, information about the catalytic active centers (bridged Si-OH-Al sites) is not completely understood. This pentasil-type zeolite13-15, is characterized
by a low content of aluminum (Si/Al10), a medium pore size (5.1 × 5.7 Å), great deactivation resistance and high thermal stability.
Fourier transform infrared (FTIR) spectroscopy is widely used in the characterization of catalysts due to its
capacity to provide information without destroying the matrix. On the other hand, the use of special cells16-18,
allows tracking the changes occurring in the IR bands of basic probes, adsorbed on the catalyst acid sites19-21, due
to changes in the nature and distribution of these sites. For example, interaction of pyridine with the acid sites of the catalyst, generates a series of signals, among which two are prominent: one signal around 1545 cm–1 (pyridinium
ion bonded to a Brönsted site) and another near 1455 cm–1
(pyridine adsorbed on Lewis acid sites).
The values of the extinction coefficients ∈B and
∈L, based on the absorbance of these bands, have been reported22,23, so that they may be used in the estimation of
the concentrations of these sites.
The partial disappearance of the Si-OH-Al groups can be followed by checking for changes in intensity and position of the O-H stretching vibrations24 in the region located
between 3700 and 3500 cm–1. The position and the number
of these peaks or bands can vary from one zeolite to another. For example, the bands found at 3640 and 3540 cm−1 due
to bridging hydroxyl groups (Si–OH–Al) in faujasite, are replaced in mordenite and ZSM-5 by a single band25 between
3600 and 3615 cm–1.
The dealumination of a zeolite by hydrothermal treatment26-28 frequently leads to a decrease of its crystallinity,
due to the partial collapse of its microporous structure24,29
through a mechanism which is not yet fully understood. Fourier transform infrared (FTIR) spectroscopy works complementary to X-ray diffraction7,24,29,30 in search for
intensities in the region of 1300 to 300 cm–1. These bands
are grouped in two types of vibrations of the tetrahedral TO4 units (where T = Al or Si):
• Vibrations related to the connections betweenTO4 tetrahedra, which are therefore sensitive to structural modifications;
• Vibrations into the TO4 tetrahedra, which are insensitive to structural modifications.
For ZSM-5 zeolites24, double ring vibration band at
550-560 cm–1 belongs to the type (a), whereas the band at
800 cm–1 of the symmetric stretching mode of internal TO 4
tetrahedra belongs to the type (b). Subsequently, the ratios between the absorbances of these bands can be taken as an acceptable criterion of crystallinity.
In this work, Fourier transform infrared (FTIR) spectroscopy is used to study the nature of adsorbed molecular water, the segregation of aluminum outside the crystal framework, its inter-conversion between forms with different numbers of coordination, and their influence on the acidity of a ZSM-5 zeolite placed under hydrothermal conditions.
2. Experimental
2.1.
Hydrothermal treatment
A ZSM-5 zeolite provided by INTEVEP, underwent hydrothermal treatment, according to the conditions of Table 1. The original zeolite without treatment was labeled as NHT.
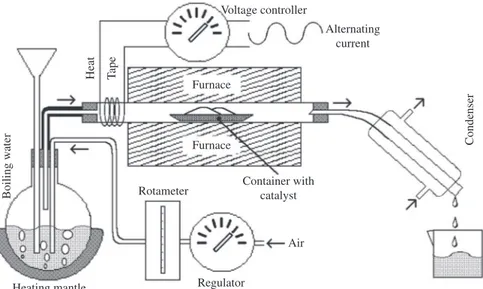
The hydrothermal treatment consisted in the application of a constant air flow, dampened by the bubbling of boiling water, on a portion of NHT contained in a quartz reactor, within a tubular furnace (Figure 1), warmed up to 560, 760 and 960 °C. After 120 minutes, the heating was suspended and dry air was injected into the reactor with the zeolite. The resulting three new zeolite samples were labeled HT560, HT760 and HT960, corresponding to the temperature of the hydrothermal treatment.
2.2.
Fourier transform infrared (FTIR)
spectroscopy
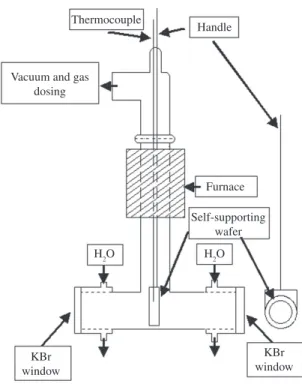
In order to study the OH groups on framework and extra-framework aluminum species, as well as their Brönsted and Lewis acidity, thin self-supporting wafers of each zeolite sample were prepared by the application of 207 MPa of pressure on approximately 15 mg of zeolite. The 1.3 cm diameter wafers were placed in a container that was inserted into a high-temperature vacuum cell (Figure 2). In each trial, the cell containing the sample was subjected to a pressure of1.33mPawithaheatingramprateof10°C/min,until reaching the 500 °C for one hour. Afterwards, the sample was left to cool down to room temperature, to obtain a FTIR spectrum of the wafer surface without adsorbate. Then pyridinewasadded,withpressureincrementof133Pa,until reachingthesaturationatapproximately667Pa.Thegasin excess was removed by vacuum suction, until returning to theoriginalpressureof1.33mPa.Havingdonethis,itwas proceeded to obtain FTIR spectra of each wafer, between 100 and 500 °C, with intervals of 100 °C. Spectra were recorded by a Perkin-Elmer FTIR System Spectrum GX instrument. Scan range: 400-5000 cm–1.
In order to study the structural order, dilution of the sample was required by preparing wafers of approximately 0.07mgofcatalystin100mgofKBr,under103MPaof pressure.SpectrawererecordedbyaPerkinElmerFTIR 1600. Scan range: 450-4400 cm–1.
Figure 1. Schematic of apparatus for hydrothermal treatment.
Table 1. Experimental conditions for hydrothermal treatment.
Temperature 560 °C, 760 °C and 960 °C Rate of heating 5 °C/min
Air flow 100 ml/min Mass of the catalyst 0.7-0.8 g
Time of treatment 2 h Water temperature Boiling
2.3.
X-Ray diffraction
The XRD study was performed using a Siemens D5005 diffractometer with a θ/θ geometry in reflection mode, equipped with a graphite secondary monochromator, in the 2θ range of 5°-60° and a step size of 0.02° and a time of 1.5 seconds. Cu Kα (λ= 1.54056Å) radiation, working at 40Kv and 30 mA.
2.4.
Temperature-Programmed Desorption of
Ammonia (TPD-NH
3)
InordertoobtaintheTPD-NH3 profiles, a Micromeritics TPD/TPR2900systemequippedwithathermalconductivity detector (TCD) and its own software, was used. Each one of the samples (150 mg) was previously pulverized in an agate mortar and activated in a quartz reactor at 500 °C, undera50mL/minlowofdryairat101kPaforonehour. Soon the samples were saturated with NH3 (50 mL/min and 101kPa)atroomtemperaturefor15minutes.ExcessNH3 waseliminatedwitha50mL/minheliumlow(207-276kPa) for15minutes.TheTPDexperimentswereperformedwith acontinuousheliumlow(50mL/min,207-276kPa)and heating rate of 10°C/min until 600 °C. This temperature was maintained for one hour afterwards.
3. Results and Discussion
3.1.
Behavior of the framework OH
Figure 3 shows a small variation of the signal around 3746 cm–1 of O-H stretching vibrations of silanols before
the addition of pyridine, with the increase of the steam temperature. This contrasts with the strong diminution
of the signal at 3613-3617 cm–1 which is consistent with
the reduction of the number of Si-OH-Al groups and the precipitation of aluminum outside the zeolite framework, after the hydrothermal treatment. The parent zeolite without hydrothermal treatment (NHT) also shows the presence of a weak band at 3785 cm–1 and a medium and broad band
at 3700-3642 cm–1, that can be respectively assigned to
νOH of terminal Al-OH and Al-OH still connected by one or two links to the crystal lattice34-36. At a first glance,
the results don’t support the latest presumption because fast disappearance of these bands, with the increase of the temperature of the hydrothermal treatment, does not agree with the increase of the presence of extra-framework aluminum species, resulting from hydrothermal treatment. A possible explanation for this behavior is the increasing condensation of the extra-framework aluminum hydroxyls to polymeric aluminum species. Such behavior was already been discussed in the literature1,12. Nevertheless,
the difference of the spectra of the solids NHT, HT560 and HT760 minus HT960 (Figure 4) provides evidence of a small signal centered at 1622 cm–1 that agrees well with
the deformation vibration of physically adsorbed molecular water37-40; whose intensity decreases with the increasing
temperature of the hydrothermal treatment. Similarly, the bands at 3785 cm–1 and 3700-3642 cm–1, reasonably agree
with the asymmetric and symmetric stretching vibrations of physisorbed water molecules32,33. This opens the
possibility that the increase of the hydrophobic character,
Figure 2. Schematic of high temperature vacuum cell.
that accompanies the partial exit of tetrahedrally coordinated aluminum out of the crystalline network, by effect of the hydrothermal treatment, causes the diminution of the bands at 3785, 3700-3642 and 1622 cm–1. The presence of
small amounts of water, after high-temperature treatment, should not be surprising: Milliken and coworkers41 found
a persistent signal in the 2.7-3.0 µm region that suggests the presence of structural H2O after heating several solids (including a zeolitic one) under vacuum at 700-850 °C. They appointed several possible causes, including water trapped in inclusions and/or its readsorption from the atmosphere. Moreover,CheandGlotch42andVédrine43, have observed
the presence of molecular water, even after pretreatment of solid samples to 500 °C. These results support the possibility of an association between molecular water and extra-framework aluminum hydroxyls, as hydrated species whose disappearance results in the diminution of the last two mentioned bands. Similar observations were made in previous studies10,44.
The gradual disappearance of the signals at 3785 and 3700-3642 cm–1 (Figure 3) with the increase of the
temperature during hydrothermal treatment, reveals small signals at 3640 cm–1 and 3683 cm–1 (zeolite sample HT760)
that finally disappears in HT960. Most likely, the peak around 3640 cm–1 comes from O-H stretching vibrations of
silanols (Si-OH), hydrogen bonded with other silanols or water molecules, inside the zeolite channels45,46. Theoretical
studies made by Jungsuttiwong and coworkers40, allowed
assigning the signal at 3683 cm–1 to “free O-H” stretching
vibrations, pertaining to H5O2+ ions adsorbed inside the
ZSM-5 zeolite channels.
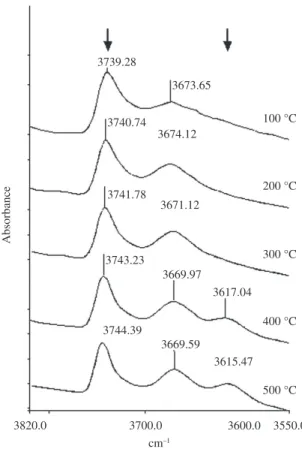
The temperature at which desorption of pyridine occurs, with the consequent reappearance of to the O-H stretching vibrations24 in the region located between 3700 and 3500 cm–1,
indicates the strength of acid sites. Reappearance of the signal at 3613-3617 cm–1 (O-H stretching vibrations of Si-OH-Al)
in NHT could be observed, when pyridine was desorbed at 400 and 500°C (Figure 5). Nevertheless, the signal at
3700-3642 cm–1 did not show important changes. On the
other hand, the absence of the band at 3785 cm–1, could be
explained by the “irreversible” adsorption of pyridine on terminals extra-framework aluminum hydroxyls, with the consequent disappearance of its νOH vibration. This suggests that corresponding acid sites are stronger than the Si-OH-Al groups. That is incompatible with the position of the νOH signal at a higher frequency than the νOH signal of OH bridged groups. However, the removal of residual trapped water adsorbed on extra-framework aluminum by pyridine can be an alternative explanation for the absence of the band at 3785 cm–1.Guisnetandcoworkers47 reported the irreversible
disappearance of the same band under similar circumstances. On the contrary, the band at 3700-3642 cm–1 may be
the result of the superposition of the signals of symmetric stretching vibrations of physisorbed water molecules and Al-OH still connected by one or two links to the crystal lattice, where the latter is dominant. In this case, the removal of water adsorbed on extra-framework aluminum by pyridine, will not cause a noticeable effect on this signal.
In the FTIR spectra of zeolite sample HT560 (Figure 6), the signal at 3613-3617 cm–1 reappears after desorption of
the pyridine at 400 and 500 °C, while signals at 3785 and 3662 cm–1 (this last one being the remaining part of the 3700
3640 cm–1, band) are absent. The growing condensation
of the extra-framework aluminum hydroxyls to polymeric aluminum species, with the increase in the temperature of the
Figure 4. Difference spectra of the solids NHT, HT560 and HT760 minus HT960 in the FTIR region of the deformation vibration the adsorbed water.
hydrothermal treatment, diminishes its contribution to the signal at 3662 cm–1 promoting water as a main contributor
of this signal. In this case, the removal of water adsorbed on extra-framework aluminum by pyridine, would cause the disappearance of signals at 3785 and 3662 cm–1.
As expected, the presence of the signal at 3613-3617 cm–1
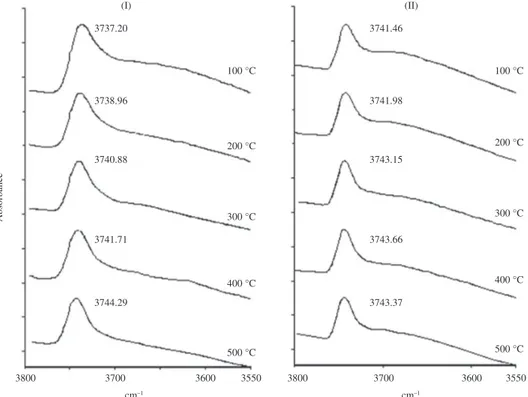
in FTIR spectra of HT760 and HT960 (Figure 7) was not observed, because it was not visible before the adsorption of pyridine (Figure 3). On the other hand, like in the other samples, the signal around 3746 cm–1 of O-H stretching
vibrations of silanols practically remained inalterable. Moreover, the reappearance of the bands at 3785, 3683, 3662 and 3640 cm–1 in the zeolite sample HT760 was not
observed. Once again, the removal of water molecules by pyridine molecules seems to be the cause of the diminution of these signals below the sensitivity of the FTIR spectrometer.
3.2.
Brönsted and Lewis acidity
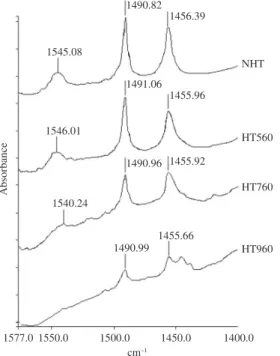
FTIR spectroscopic study of pyridine adsorption at Ts = 200 °C (where Ts is the temperature from which there is no overlap between the signals of the physisorbed and chemisorbed pyridine22,48-50) shows changes in the intensity
of the bands between 1400 and 1570 cm–1 with the increase
of the temperature of the hydrothermal treatment (Figure 8). The variability, often caused by very subtle differences in the experimental conditions, between the reported values of the extinction coefficients ∈B and ∈L, based on the absorbances of the bands around 1545 cm–1 (pyridinium
ion bonded to a Brönsted site) and 1455 cm–1 (pyridine
adsorbed on Lewis acid sites) led to use of the ∈L/∈B ratio (which is less sensible to changes in the experimental conditions). The CB/CL concentration ratio between Brönsted and Lewis acid sites was calculated through the equation: CB/CL = (∈L/∈B).(AB/AL), where AB/AL is the absorbance ratio between the bands around 1545 and 1455 cm–1. Under
Figure 7. Behavior of FTIR spectra of the OH-stretching region, with the increase of pyridine desorption temperature of zeolite samples I) HT760 and II) HT960.
these considerations, the value of ∈L/∈B = 0.7, proposed by Robb and coworkers51, was used as the most adequate value
for the determination of the CB/CL ratio, in ZSM-5 catalysts with Si/Al ratio superior to 7.5.
The decrease of the CB/CL ratio (Table 2) with the increasing temperature of the hydrothermal treatment can be explained by the transformation of tetrahedrally-coordinated framework aluminum in new species without Brönsted acidity. Another explanation for this behavior is the decreasing accessibility of pyridine molecules inside the zeolite channels (where it is presumed that the majority of the Brönsted acid-sites and a minor portion of the Lewis acid-sites are located) due to accumulation of extra-framework aluminum species.
The diminution of the intensity of the bands between 1400 and 1570 cm–1 (Figure 8) indicates that both Lewis
and Brönsted acid site densities decrease at the same time. This contradicts the frequently accepted mechanism that underlies the increasing number of Lewis acid sites at the expense of the bridged Si-OH-Al sites1-5, associated
with Brönsted acidity, after hydrothermal treatment. This behavior may be attributed to the decreasing accessibility of pyridine molecules to Lewis acid sites inside the zeolite channels. However, the gradual conversion of the extra-framework aluminum hydroxyls (Lewis-associated)7-9
in polymeric species of low acidity1,12 may be another
possiblecause.TheresultsofTPD-NH3 analyses also seem to agree, when these show, at increasing hydrothermal treatment temperature, the decreasing of the profile areas of zones HT and LT, corresponding to higher and lesser than 300°C desorption temperatures from acid sites (Figure 9). Several authors52-56 consider that the peak in the LT zone
results of NH3 desorption from non-acid sites. In order to verify or discard the last affirmation, the sample NHT was put under a superficial dealumination with HCl 1N. The elemental analysis (Table 3) shows that HCl treatment leads to an extraction of a 48% of total aluminum and 5% of totalsilicon.However,thecomparisonbetweenTPD-NH3 profiles before and after treatment (Figure 10) shows that the
Figure 8. FTIR spectra of the adsorbed pyridine in the 1577-1400 cm–1 range after pyridine desorption at 200 °C of zeolite samples NHT, HT560, HT760 and HT960.
Table 2. Decrease of Brönsted to Lewis CB/CL ratio with the increasing temperature of the hydrothermal treatment.
Zeolite samples CB/CL
NHT 0.384
HT560 0.224
HT760 0.116
HT960 0.000
Figure 9. TPD-NH3 profiles of zeolite samples a) NHT, b) HT560, c) HT760 and d) HT960.
Figure 10. TPD-NH3 profiles of zeolite sample NHT a) before and b) after treat with HCl 1N.
Table 3. Elemental analysis of zeolite NHT, before and after superficial treatment, with HCl 1N, using Inductively Coupled
Plasma(ICP)techniques.
Sample %Al %Si
NHT (Before treatment) 4.84a 36.24a NHT (After treatment) 2.51a 34.47a
Difference 2.33a 1.77a
%Extracted 48.13b 4.88c
HT area remains almost equal, whereas the LT diminishes significantly. This confirms the association between the LT peak and aluminum species of low acidity.
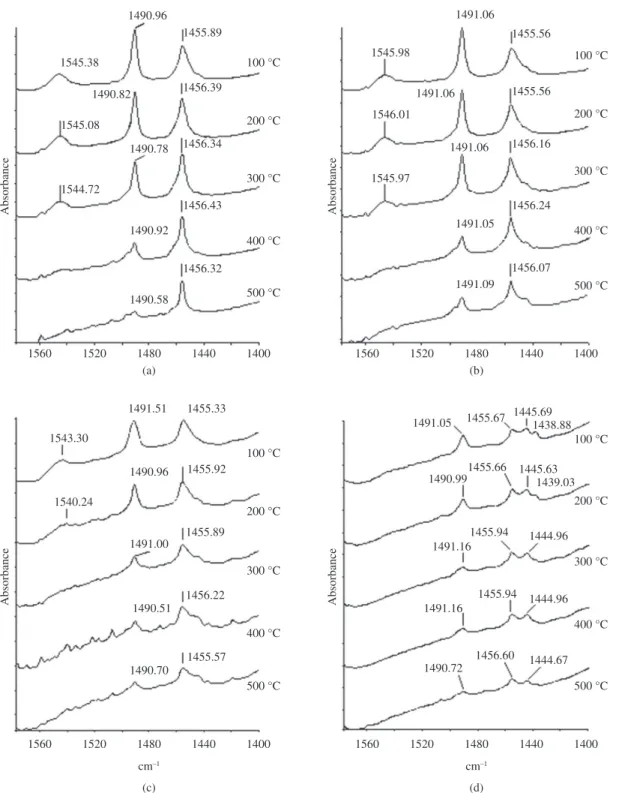
The temperature at which desorption starts and therefore, the disappearance of the bands of the adsorbed pyridine between 1400 and 1570 cm–1 begins, is an indicator
of the force of the acid sites in the catalyst. In the zeolite
samples NHT and HT560, the disappearance of the signal around 1545 cm–1 could be observed, when pyridine was
desorbed at 400 °C (Figure 11, “a” and “b”). Nevertheless, the signal around 1455 cm–1 did not show important changes,
although its intensity diminished slightly, with the increase of the desorption temperature. However, spectra of HT760 (Figure 11c) showed the disappearance of the signal around
with the diminution of the acid-density57-59. Instead, the band
at 1545 cm–1 disappears, in the solids NHT and HT560,
at higher desorption temperatures than the solid HT760 (Figure 11), suggesting that Brönsted acid-sites with superior strength occur in samples with the highest densities of acid-sites. This behavior might be caused by the decreasing accessibility of pyridine molecules, due to accumulation of extra-framework aluminum species after the hydrothermal treatment, into the zeolite channels (where is presumed the presence of the strongest Brönsted acid sites) and/or the gradual transformation of tetrahedrally coordinated aluminum, associated with the strongest Brönsted acid sites, in extra-framework species of low acidity.
3.3.
Study of structural order
Fourier transform infrared (FTIR) spectroscopy, of KBr pellets of zeolite samples NHT, HT560, HT760 and HT960, leads to very similar spectra. However, there are small differences in position and relative intensities of its bands (Figure 12).
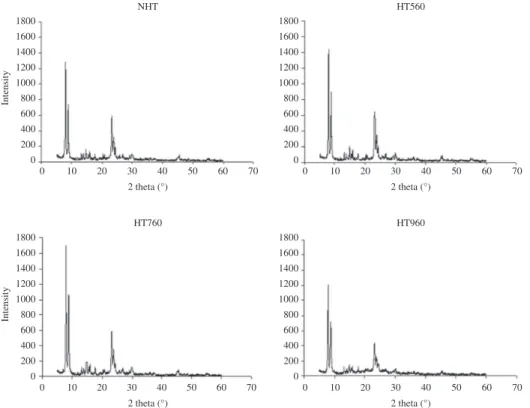
The ratio between integrated absorbances of bands around 550 and 800 cm–1 (double five-member-ring and
internal tetrahedra TO4 symmetric stretching vibrations, respectively) was used as a measure of crystallinity. The values of the ratio represented in Table 4, show a “volcano” behavior, characterized for an initial increase and subsequent decrease with increasing temperatures of hydrothermal treatment. Moreover, at the same table, the cristallinity, estimated from the peak height at 2θ = 24.3° of X-ray difractograms31 (Figure 13), behave similarly. That suggests
a previous step of structural realignment of zeolite sample at treatment temperatures less than 760 °C.
1545 cm–1 when the pyridine was desorbed between 300
and 500 °C. The presence of this band at 100 and 200 °C, contrasts with the apparent absence in this sample, of the band associated to the Si-OH-Al groups, at 3613-3617 cm–1
(Figure 7). Due to its low intensity, this last band can be below the resolution of the FTIR spectrometer. On the other hand, in the zeolite sample HT960 spectra, the signal around 1545 cm–1 is absent at all times (Figure 11d).
The non-disappearance of the band at 1455 cm–1, in the
rank of studied temperatures of desorption, suggests that the Lewis acid sites are stronger than the pyridine accessible Brönsted sites.
At first glance, the results don’t support the frequently accepted opinion that the Brönsted acid strength increases
Figure 13. X-ray diffractograms of zeolite samples NHT, HT560, HT760 and HT960. Figure 12. Superposition of FTIR spectra between 870 and 500 cm–1
hydroxyls in polymeric species of weak acidity resulting from the hydrothermal treatment.
The gradual condensation of the extra-framework aluminum species to polymeric aluminum species of weak acidity, with the increasing temperature of the hydrothermal treatment, is the most probable cause of the diminution of the density of Lewis acid sites. On the other hand, decreasing accessibility of pyridine molecules to the strongest Brönsted acid sites into the zeolite channels due to the accumulation of extra-framework aluminum and/or the gradual transformation of these acid sites, into extra-framework species of low acid strength, may be the possible causes of the observed decrease in Brönsted acid site strength after the hydrothermal treatment.
Crystallinity shows a “volcano” behavior, characterized by an initial increase and subsequent decrease with increasing temperatures of hydrothermal treatment that suggests a previous step of structural realignment of zeolite sample at treatment temperatures less than 760°C.
Acknowledgments
The author thanks the National Research Petroleum Institute ofVenezuela (INTEVEP) and the Kinetic and Catalysis Laboratory of “Los Andes” University of Venezuela,foritsinvaluablesupportinprovidingsource materials and characterization techniques for this work.
4. Conclusions
The results suggest an association between adsorbed molecular water and extra-framework aluminum hydroxyls generated after the hydrothermal treatment: The weak band at 3785 cm–1 can be assigned to asymmetric
stretching vibrations of residual trapped water adsorbed on extra-framework aluminum. Likewise, a medium and broad band in 3700-3642 cm–1 can, probably, have its origin in the
superposition of two νOH signals: from water (symmetric stretching vibrations) and non-terminals extra-framework aluminum hydroxyls (where the latter is dominant). In addition, the diminution in the intensity of these signals is consistent with an increase of the hydrophobicity and the gradual condensation of the extra-framework aluminum
Table 4. Relative crystallinity of zeolite samples NHT, HT560, HT760 and HT960. Calculated from the absorbance ratio (A/C) of bands at 550 cm–1 (A) and 800 cm–1 (C) and from XRD peak height at a diffraction angle 2θ of 24.3°.
Zeolite sample A/C %A/C % Crystallinity. (DRX)
NHT 2.51 100 100
HT560 2.93 117 115
HT760 2.67 106 100
HT960 1.63 65 71
References
1. Zhang W, Han X, Liu X and Bao X. Characterization of the acid sites in dealuminated nanosized HZSM-5 zeolite with the probe molecule trimethylphosphine. Journal of Molecular Catalysis. A: Chemical. 2003; 194:107-113. http://dx.doi.org/10.1016/ S1381-1169(02)00466-1
2. Kiwi-Minsker L, Bulushev DA and Renken A. Active sites in HZSM-5 with low Fe content for the formation of surface oxygen by decomposing N2O: is every deposited oxygen active? Journal of Catalysis. 2003; 219:273-285. http://dx.doi. org/10.1016/S0021-9517(03)00222-7
3. WichterlováB,TvarkováZ,SobalíkZandSarvP.Determination
and properties of acid sites in H-ferrierite: A comparison of ferrierite and MFI structures. Microporous and Mesoporous Materials. 1998; 24:223-233. http://dx.doi.org/10.1016/ S1387-1811(98)00167-X
4. Borade R, Sayari A, Adnot A and Kaliaguine S. Characterization of acidity in ZSM-5 zeolites: an x-ray photoelectron and IR spectroscopy study. The Journal of Physical Chemistry. 1990; 94:5989-5994. http://dx.doi.org/10.1021/ j100378a068
5. Dapaah JKA, Andaluna L, Kobayashi T, Uemichi Y and Sugioka M. Enhancement of Catalytic Activity of Natural Zeolites by Surface Modeification for 1-Butene Isomerizatio. Muroran Institute of Technology. 1997; 47:89-95.
6. Mota CJA, Bhering DL and Rosenbach N. A DFT Study of the Acidity of Ultrastable Y Zeolite: Where Is the Brønsted/ Lewis Acid Synergism?. Angewandte Chemie International Edition. 2004; 4:30503052.
7. Nagy JB, Bodart P, Hannus I and Kiricsi I.Synthesis, characterization and use of zeolitic microporous materials.
Szeged:DecaGenLtd.;1998.
8. JacobsPAandUytterhoevenJB.Assignment of the Hydroxyl Bands in the Infrared Spectra of Zeolites X and Y. Heverlee: Centrum voor Oppervlaktescheikunde en Kolloïdale Schi-kunde, De croylaan 42, B-3030; 1972.
9. Covarrubias C, Quijada R and Rojas R. Ethylene polymerization using dealuminated ZSM-2 zeolite nanocrystals as an active metallocene catalyst support. Applied Catalysis. A:
General. 2008; 347:223-233.http://dx.doi.org/10.1016/j. apcata.2008.06.023
10. Lisboa O, Sánchez M and Ruette F. Modeling extra framework aluminum (EFAL) formation in the zeolite ZSM-5 using parametric quantum and DFT methods. Journal of Molecular Catalysis. A: Chemical. 2008; 294:93-101. http://dx.doi. org/10.1016/j.molcata.2008.08.003
11. Yoon JW, Jhung SH, Choo DH, Lee SJ, Leed KY and Chang JS. Oligomerization of isobutene over dealuminated Y zeolite. Applied Catalysis.A:General.2008;337:7377.http://dx.doi. org/10.1016/j.apcata.2007.12.001
12. KosslickH,JuanR,FrickeVAandMartinA.Studyonthe
nature of aluminum in dealuminated zeolite ZSM-20. Studies in Surface Science and Catalysis. 1994; 84:1013-1020. http:// dx.doi.org/10.1016/S0167-2991(08)63636-8
13. KorobitsynaLL,VelichkinaLM,VosmerikovAV,Radomskaya VI,AstapovaES,RyabovaNVetal.Ultra-high-silicaZSM-5
27. ParkJN,WangJ,HongSIandLeeCW.Effectofdealumination
of zeolite catalysts on methylation of 2-methylnaphthalene in a high-pressure fixed-bed flow reactor. Applied Catalysis.
A: General. 2005; 292:68-75.http://dx.doi.org/10.1016/j. apcata.2005.05.039
28. Beyer HK. Dealumination techniques for zeolites. Molecular Sieves. 2002;3:204255. http://dx.doi.org/10.1007/3-540-69750-0_3
29. GiannettoG,MontesAandRodríguezG.Zeolitas. 2nd ed. Caracas: Innovación tecnológica; 2000.
30. ShuklaDBandPandyaVP.Estimationofcrystallinephasein
ZSM-5 zeolites by infrared spectroscopy. Journal of Chemical Technology and Biotechnology. 1989; 44(2):147-154. http:// dx.doi.org/10.1002/jctb.280440206
31. American Society for Testing and Materials – ASTM. D5758-01(2007)e1: Standard Test Method for Determination of Relative Crystallinity of Zeolite ZSM-5 by X-Ray Diffraction. ASTM; 2007.
32. Hair ML. Infrared spectroscopy in surface chemistry. New York: Marcel Dekker; 1967.
33. Huang M, Adnol A and Kallaguine S. Silylation of H-ZSM-5: an X-ray photoelectron and infrared spectroscopy study. Jo u rn a l o f t h e C h e mi c a l S o c ie t y, Fa ra d a y Transactions. 1993; 89(23):4231-4237. http://dx.doi. org/10.1039/ft9938904231
34. TrombettaM,BuscaG,StoraroL,LenardaM,Casagrande
M and Zambon A. Surface acidity modifications induced by thermal treatments and acid leaching on microcrystalline H-BEA zeolite. AFT-IR, XRD and MAS-NMR study. Physical Chemistry Chemical Physics. 2000; 2:35293537. http://dx.doi. org/10.1039/b001916j
35. Roberge RM, Hausmann H and Holderich WF. Dealumination of zeolite beta by acid leaching: a new insight with two-dimensional multi-quantum and cross polarization 27Al MAS NMR. Physical Chemistry Chemical Physics. 2002; 4:3128-3135. http://dx.doi.org/10.1039/b110679c
36. Armaroli T, Bécue T and Gautier S. Diffuse Reflection
Infrared Spectroscopy (DRIFTS): Application to the in situ Analysis of Catalysts. Revue de L’institut Français du Pétrole. 2004; 59(2):215237.
37. Kefirov D, Ivanova E, Hadjiivanov K, Dzwigaj S and Che M. FTIR Characterization of Fe3+-OH Groups in Fe-H-BEA Zeolite: Interaction with CO and NO. Catalysis Letters. 2008; 125:209-214. http://dx.doi.org/10.1007/s10562-008-9577-3
38. Lasagabaster A, Abad MJ, Barral L and Ares A. FTIR
studyonthenatureofwatersorbedinpolypropylene(PP)/ ethylene alcohol vinyl (EVOH) ilms.European Polymer Journal. 2006; 42:3121-3132. http://dx.doi.org/10.1016/j. eurpolymj.2006.03.029
39. Pavlović M, BaranovićGandLovrekovića D. Raman study of the bending band of water. Spectrochimica Acta Part A: Molecular Spectroscopy. 1991; 47(7):897-906. http://dx.doi.
org/10.1016/0584-8539(91)80277-P
40. Jungsuttiwong S, Limtrakul J and Truong TN. Theoretical Study of Modes of Adsorption of Water Dimer on H-ZSM-5 and H-Faujasite Zeolites. The Journal of Physical Chemistry B. 2005; 109:13342-13351. http://dx.doi.org/10.1021/ jp045021k
41. Milliken RE and Mustard JF. Quantifying absolute water content of minerals using near-infrared reflectance spectroscopy. Journal of Geophysical Research. 2005; 110(E12). http:// dx.doi.org/10.1029/2005JE002534
14. Gonçalves ML, Dimitrov LD, Jordão MH, Wallau M and Urquieta-González EA. Synthesis of mesoporous
ZSM-5 by crystallisation of aged gels in the presence o f c e t y l t r i m e t h y l a m m o n i u m c a t i o n s . C a t a l y s i s Today. 2008; 133-135:69-79. http://dx.doi.org/10.1016/j. cattod.2007.12.108
15. Grigor’eva NG, Galyautdinova RR, Vosmerikov AV,
Korobitsina LL, Kutepov BI and Dzhemilev UM. Conversion
ofa-MethylstyreneoverPentasilZeoliteswithVariousSilica
Ratios. Petroleum Chemistry. 2008; 48:366-370. http://dx.doi. org/10.1134/S096554410805006X
16. Ding C, Wang X, Guo X and Zhang S. Characterization
and catalytic alkylation of hydrothermally dealuminated n a n o s c a l e Z S M - 5 z e o l i t e c a t a l y s t . C a t a l y s i s Communications. 2008; 9:487-493. http://dx.doi.org/10.1016/j. catcom.2007.07.013
17. Zhang Z, Liu D, Zhu X, Yu H, Liu S and Xu L. Acidity effects of Hb zeolite on olefin alkylation of thiophenic sulfur in gasoline. Journal of Natural Gas Chemistry. 2008; 17:45-50. http:// dx.doi.org/10.1016/S1003-9953(08)60024-9
18. Jin F, Cui Y and Li Y. Effect of alkaline and atom-planting treatment on the catalytic performance of ZSM-5 catalyst in pyridine and picolines synthesis. Applied Catalysis.
A: General. 2008; 350:71-78.http://dx.doi.org/10.1016/j. apcata.2008.07.041
19. BenalioucheF,BoucheffaY,AyraultP,MignardSandMagnoux P.NH3-TPDandFTIRspectroscopyofpyridineadsorption
studies for characterization of Ag- and Cu-exchanged X zeolites. Microporous and Mesoporous Materials. 2008; 111:80-88. http://dx.doi.org/10.1016/j.micromeso.2007.07.006
20. MolinerM,Díaz-CabañasMJ,FornésV,MartínezCandCorma
A. Synthesis methodology, stability, acidity, and catalytic behavior of the member ring pores ITQ33 zeolite. Journal of Catalysis. 2008; 254:101-109. http://dx.doi.org/10.1016/j. jcat.2007.12.003
21. Bordiga S, Regli L, Cocina D, Lamberti C, Bjorgen M and
Lillerud KP.Assessing the acidity of high silica chabazite
H-SSZ-13 by FTIR using CO as molecular probe: Comparison
with H-SAPO-34.The Journal of Physical Chemistry B. 2005; 109(7):2779-2784. http://dx.doi.org/10.1021/ jp045498w
22. Selli E and Forni L. Comparison between the surface acidity
of solid catalysis determined by TPD and FTIR analysis
of preadsorbed pyridine. Microporous and Mesoporous Materials. 1999; 31:129140. http://dx.doi.org/10.1016/ S1387-1811(99)00063-3
23. E m e i s C A . D e t e r m i n a t i o n o f I n t eg r a t e d M o l a r Extinction Coefficients for Infrared Absorption Bands of
PyridineAdsorbed on SolidAcid Catalysts.Journal of Catalysis. 1993; 141:347354. http://dx.doi.org/10.1006/ jcat.1993.1145
24. Van Bekkum H, Flanigen EM, Jacobs P and Jensen JC.
Introduction To Zeolite Science and Practice. 2nd ed. New York: Elsevier; 2001.
25. VanHoffJHCandRoelofsenJW.Chapter7Techniquesof
Zeolite Characterization. Studies in Surface Science and Catalysis. 1991; 58:241250. http://dx.doi.org/10.1016/S0167-2991(08)63605-8
26. Groen JC, Moulijn JA and Pérez-Ramírez J. Decoupling
desorption (STPD) and FTIR spectroscopy. Microporous
and Mesoporous Materials. 1998; 20:307316. http://dx.doi. org/10.1016/S1387-1811(97)00026-7
52. Lok BM, Marcus BK and Angell CL. Characterization of zeolite acidity. II. Measurement of zeolite acidity by ammonia temperature programmed desorption and FTIR spectroscopy techniques. Zeolites. 1986; 6(3):185-194. http://dx.doi. org/10.1016/0144-2449(86)90046-1
53. Zhao Q, Chen W-H, Huang S-J, Wu Y-C, Lee H-K and Liu S-B. Discernment and Quantification of Internal and External Acid Sites on Zeolites. The Journal of Physical Chemistry B. 2002; 106:4462-4469. http://dx.doi.org/10.1021/jp015574k 54. Rodríguez-GonzálezL,Rodríguez-CastellónE,Jiménez-López
A and Simon U. Correlation of TPD and impedance
measurements on the desorption of NH3 from zeolite H-ZSM-5. Solid State Ionics. 2008; 179(35-36):1968-1973. http://dx.doi. org/10.1016/j.ssi.2008.06.007
55. Ma D, ZhangWP, ShuYY, Liu XM, XuYD and Bao XH. MASNMR,ESRandTPDstudiesofMo/HZSM-5catalysts:
evidence for the migration of molybdenum species into the zeolitic channels. Catalysis Letters. 2000; 66(3):155-160. http://dx.doi.org/10.1023/A:1019099607029
56. Iwasaki M, Yamazaki K, Banno K and Shinjoh H. Characterization of Fe/ZSM-5 DeNOx catalysts prepared by different methods: Relationships between active Fe sites and NH3-SCR performance. Journal of Catalysis. 2008; 260(2):205-216. http://dx.doi.org/10.1016/j.jcat.2008.10.009
57. LuJ,ZhaoZ,XuC,DuanAandZhangP.EffectsofCalcination Temperature on theAcidity and Catalytic Performances of
HZSM-5 Zeolite Catalysts for the Catalytic Cracking of n-Butane. Journal of Natural Gas Chemistry. 2005; 14:213-220. 58. Dimitrova R and Popova M. Computer Simulation of the
Beta Structure, with Different Lattice Ions and Reactivity, of Hydroperoxo-Metal Complexes Using an Embedded-Cluster Method. Molecular Engineering. 1999; 8(4):471-478. http:// dx.doi.org/10.1023/A:1008338026553
59. Cairon O and Chevreau T. Quantitative FTIR studies of hexagonal and cubic faujasites by pyridine and CO adsorption. Journal of the Chemical Society, Faraday Transactions. 1998; 94:323-330. http://dx.doi.org/10.1039/ a703444j
42. Che C and Glotch TD. The Infrared Spectra Study Of Dehydrated And Dehydroxylated Phyllosilicates. In:
Prodeedings of the 40th Lunar and Planetary Science Conference; 2009; Woodlands, Texas. Woodlands; 2009. 43. Védrine JC,AurouxA, BolisV, Dejaifve P, Naccache C,
WiezchowskiPetal.InfraredMicrocalorimetric,andElectron SpinResonanceInvestigationsoftheAcidicPropertiesofthe
HZSM5 Zeolite. Journal of Catalysis. 1979; 59:248-262. http:// dx.doi.org/10.1016/S0021-9517(79)80029-9
44. Jiao J. Quantitative Characterization of Aluminum in Non-hydrated Zeolite Catalysts by Multi-nuclear Solid-state NMR Spectroscopy. Dr. rer. nat. [Thesis]. Universität Stuttgart zur Erlangung der Würde eines; 2006.
45. Fang J andYongdan L.A FTIR and TPD examination
of the distributive properties of acid sites on ZSM-5 zeolite with pyridine as a probe molecule. Catalysis Today. 2009; 145:101-107. http://dx.doi.org/10.1016/j. cattod.2008.06.007
46. DeAragãoBJGandMessaddeqY.PeakSeparationbyDerivative
Spectroscopy Applied to FTIR Analysis of Hydrolized Silica. Journal of Braziliam Chemical Society 2008; 19(8):1582-1594. http://dx.doi.org/10.1590/S0103-50532008000800019 47. Guisnet M,Ayrault P, Coutanceau C,Alvarez MF and
Datka J.Acid Properties of dealuminated bate zeolites by
IR spectroscopy. Journal of the Chemical Society, Faraday Transactions. 1997; 93:1661-1665. http://dx.doi.org/10.1039/ a607609b
48. Selli E, Isernia A and Forni L. FTIR characterisation of Fe-silicalite catalysts for benzene oxidation to phenol by N2O. Physical Chemistry Chemical Physics. 2000; 2:33013305. http://dx.doi.org/10.1039/b002334p
49. Morterra C and Cerrato G. Pyridine adsorption reveals
high-coordinated cationic centres at the surface of microcrystalline ZnO. Catalysis Letters 1991; 10:357-364. http://dx.doi.org/10.1007/BF00769170
50. Rabeharitsara A, Cerqueira HS, Magnoux P, Guisnet
M, Costa AF and Sousa-Aguiar EF. Transformation of methylcyclohexane on an FCC Catalyst. Brazilian Journal of Chemistry. 2003; 20(2):105110.
51. RobbGM,ZhangWandSmirniotisPG.Acidityofdealuminated