RBRH, Porto Alegre, v. 22, e40, 2017
Scientiic/Technical Article
http://dx.doi.org/10.1590/2318-0331.0117160030
Trend analysis of the load and concentration of physical, chemical and biological
parameters in the Verde River Basin
Análise de tendência de concentrações e cargas de parâmetros físicos, químicos e biológicos da bacia do rio Verde
Carolina Cristiane Pinto1, Stella Braga Andrade1, Éber Andrade Pinto1 and Sílvia Maria Alves Corrêa Oliveira1
1Universidade Federal de Minas Gerais, Belo Horizonte, MG, Brasil
E-mails: [email protected] (CCP), [email protected] (SBA), [email protected] (EAP), [email protected] (SMACO)
Received: October 14, 2016 - Revised: March 14, 2017 - Accepted: April 29, 2017
ABSTRACT
The estimation of loads of pollutants is of crucial interest to identify the level of water quality, understand the processes and identify the sources of pollution. The aim of this study was to calculate time trends of loads and concentrations of eleven physical, chemical and biological parameters, in nine quality monitoring stations of the Verde River Basin from 2008 to 2014. The time series analysis
was performed with different tests. First, with the veriication of autocorrelation of the time series using the Spearman correlation test. Then, Kruskal-Wallis test was used to check signiicant differences between the seasons and, afterwards the Mann-Kendall or
the Seasonal Mann-Kendall time trend tests were applied accordingly. The analysis results indicated differences between the spatial distribution of loads and concentrations for most of the parameters evaluated in this study. The results showed that the simultaneous
analysis of concentration data and low data is essential for a more comprehensive and reliable evaluation of water quality, since the changes in river low over time can mislead the interpretation of the concentration data. Moreover, to analyze only the pollutant load data, without looking how the low and concentration behaves, does not provide conclusive results, since it does not allow to evaluate whether changes in the load values were caused by alterations of the low or concentration. Thus, the results indicate the need to monitor water quality along with low measurement, providing more complete and reliable assessments of the evolution of water quality.
Keywords: Trend analysis; Water quality; Pollutants concentration and load.
RESUMO
A estimativa das cargas poluentes é de interesse crucial para identiicar o nível de qualidade da água, entender os processos e identiicar
as fontes de poluição. O objetivo deste estudo foi calcular as tendências temporais das cargas e concentrações de onze parâmetros
físicos, químicos e biológicos, em nove estações de monitoramento de qualidade da água da bacia hidrográica do rio Verde, no período de 2008 a 2014. A análise das séries temporais foi realizada a partir da veriicação da autocorrelação da série temporal utilizando-se o teste de correlação de Spearman, teste de Kruskal-Wallis para veriicação de diferenças signiicativas entre as estações do ano e os testes de Mann-Kendall e Sazonal Mann-Kendall para análises de tendência temporal. As análises indicaram diferenças entre a
distribuição espacial da carga e da concentração para a maioria dos parâmetros avaliados neste estudo. Os resultados demostraram que
a análise conjunta de dados de concentração e vazão é essencial para uma avaliação mais abrangente e idedigna da qualidade da água, pois alterações no luxo do rio ao longo do tempo podem diicultar a interpretação dos dados de concentrações. Veriicou-se ainda que a análise de dados de carga dos poluentes, sem o estudo do comportamento da vazão e da concentração não fornece resultados conclusivos, visto que não permite avaliar a inluência desses componentes nas alterações da carga. Assim, os resultados corroboram a necessidade do monitoramento da qualidade das águas abranger medições de vazão, o que proporcionaria avaliações mais completas e coniáveis sobre a evolução da qualidade da água.
INTRODUCTION
Time trend analysis can determine whether the values of water quality parameters have increased or decreased over a period of time (ANTONOPOULOS; PAPAMICHAIL; MITSIOU, 2001). The evaluation of water quality parameters time series allows the observation of variability in load and concentration over time, which helps to identify the main impact factors and polluting potentials occurring around the area in analysis. Over the last years, many studies have been performed around the world aiming to detect trends and changes in water quality (PASSELL; DAHM; BEDRICK, 2004; CHANG, 2008; CHRISTOFARO; LEÃO, 2009; TABARI; MAROFI; AHMADI, 2011; GOCIC; TRAJKOVIC, 2013; SUN et al., 2013; TRINDADE, 2013; BARBOSA, 2015). The time series studied by these authors vary
signiicantly depending on the availability of data, and some of
them call for longer monitoring periods in order to obtain more
reliable indings.
According to Helsel and Hirsch (2002), deining whether
the value of a variable shows signiicant increase or decrease trend
is the same as determining whether the distribution of probability or some measure of central tendency of such a variable has changed over the time.
In time trend evaluation the null hypothesis (H0) to be tested is that there is no trend regarding water quality time series (GILBERT, 1987). When the rejection of H0 fails, it does not mean that trend nullity has been proved. On the contrary, it may be an indication that the available evidence, i.e., the data collection, is not enough to indicate that there is no trend (HELSEL; HIRSCH, 2002).
Water quality time series data does not follow a normal distribution due to irregularly performance of samplings and
inluence of seasonality and streamlow in the data, (HELSEL;
HIRSCH, 2002). Therefore, trend studies of such data require
speciic methodology (GROPPO et al., 2008).
The trend analyses applied to the data related to the concentration of water quality parameters is useful to evaluate a water body regarding the current water quality standards. However,
it cannot provide enough information on the identiication of
pollutant sources and possible management strategies for aquatic restoration (QIAN et al., 2007). So the loads, i.e., the bulk of a chemical constituent carried during certain period of time are
particularly important when the amount of the constituents mixed
in the water body is considered (CHRISTENSEN; RASMUSSEN; ZIEGLER, 2002).
The estimation of pollutant loads is of crucial importance to evaluate the water quality, understand the processes, and identify the pollutant sources (QUILBÉ et al., 2006). Nevertheless, most of water quality monitoring programs evaluate concentration parameters, but do not monitor the discharge, which makes it
more dificult to estimate the loads carried along the catchment
basin (ZUCCO et al., 2012).
In Brazil, the water quality monitoring system has not been integrated to the rainfall gaging system, and the measurement of
pollutant concentrations and low discharges in water courses are
rarely done together, which makes simultaneous analyses of the concentration and discharge data impracticable. Brazilian states governments have shown some concern regarding this issue and
23 states are taking part in the Program of Incentive to Share
Water Quality Data (Qualiagua) implemented by ANA (National
Water Agency). This program includes the implementation of some facilities to perform simultaneous discharge measurements to analyze the pollutant loads in water (ANA, 2016). Although the monitoring stations networks are not integrated, if there is a measurement facility along the water course that provides discharge measurements, such data collection may be transferred to places where only the concentration measurement is done (TUCCI, 2009).
In such a context, the aim of this study is to evaluate
and compare the load and concentration trends values related to pollutants in the watershed of Verde River in order to check
whether the analyses would show different indings.
METHODOLOGY
Study area
The Verde River Basin is located in the Southern/Southeastern area of the state of Minas Gerais, Brazil, and has a 6891.4 km2 draining area, and it integrates the hydrographic watershed of Grande River.
Nearly 450 thousand inhabitants live around this watershed, while the urban population is nearly 84% of the total population. The Verde River Basin encompasses 31 municipalities, of which 18 are within the total area of the watershed, and includes 23 administrative districts (CBH GRANDE, 2015). The spring of Verde River is located at an altitude of 2,600 m above the sea level along the border of the states of Minas Gerais, Sao Paulo and Rio de Janeiro, by the boundary of the municipalities named
Passa Quatro and Itanhandu stretched along the left side of a
mountain chain named “Serra da Mantiqueira” (ECOPLAN ENGENHARIA., 2010a).
Due to its geographic location, the South of Minas Gerais is
inluenced by three municipalities, namely Belo Horizonte, Rio de
Janeiro and mainly Sao Paulo. Therefore, high activity and occupation rates, high level of urban services, commerce and service providers characterize this area (ECOPLAN ENGENHARIA, 2010b).
The administrative area of the Verde River Basin, called Water Resources Planning and Management Units of the Verde
River Basin (WRMU GD4) primarily deals with extractive activities,
especially coffee and corn cultivation. Other important activities are the ones implemented at the Industrial Park of Verde River, around its catchment area, especially tannery, fertilizers and electroplating industrial plants located in municipalities featuring more prominent economic activities such as the municipalities
of Caxambu, Três Corações and Varginha. Agribusiness such as cattle farming and rock extraction from Serra Sao Tomé are also
signiicant (IGAM, 2010).
Data related to water quality and discharge of Verde River Basin
as Programa Águas de Minas (Minas Waters Program) since 1997, by recording physical, chemical and biological parameters.
The National Water Agency (ANA), among other assignments, is responsible for keeping and providing an up-to-date database of the hydro meteorological stations throughout the country.
Based on the low discharge measurement data provided by the streamlow gaging stations it is possible to measure the discharge
of rivers, and this information is available on the Hydrologic Information System named HidroWeb.
The data analyzed was collected from 2008 to 2014. The selection of parameters was based on the calculation of percent of both missing censored data and of each water quality parameter considering the data provided by the monitoring stations within a selected period of time. By analyzing the results simultaneously, parameters comprising more than 10% of missing data and more than 90% of unreliable data were eliminated, which is a procedure that has already been used in other studies (OLSEN; CHAPPELL; LOFTIS, 2012; TRINDADE, 2013; CALAZANS, 2015). It is an
important condition as the multivariate analysis is impaired by missing data due to the elimination of other data. Thus, for the proposed studied, the parameters used were: total chloride (Cl
-T), chlorophyll a (Cl-a), thermotolerant coliforms (Therm. Col),
Biochemical Oxygen Demand (BOD), Chemical Oxygen Demand
(COD), pheophytin a (Pheoph-a), total phosphorus (PT), nitrate (N-NO3-), total ammoniacal nitrogen (N-NH
4 +
T), total suspended solids (TSS) and total solids (TS). Some parameters were removed from the database because their measurement unity do not allow the load calculation, such as turbidity, electrical conductivity and
water temperature, while the dissolved oxygen parameter cannot
be interpreted in terms of load.
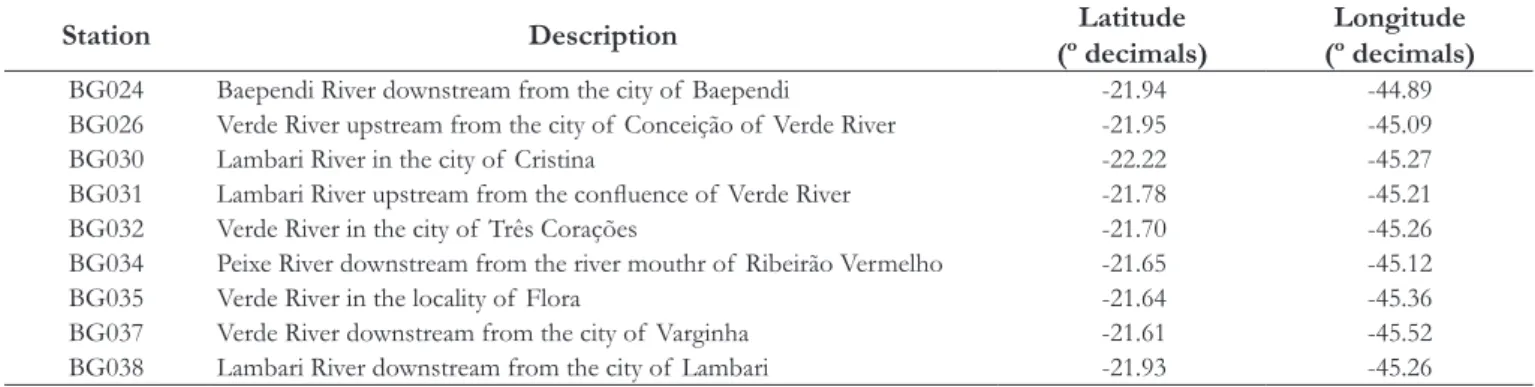
The spatial arrangement of the water quality and discharge measurements stations located along Verde River Basin and used in the study is shown in the Figure 1. The description of the water
quality stations and streamlow measurement stations with their
identiication codes are shown in Tables 1 and 2, respectively.
Figure 1. Location of the streamlow measurement stations and water quality monitoring facilities of Verde River Basin. Source: Map
As already mentioned, water quality measurements in Brazil
are not done together with streamlow measurements, which
makes impossible to directly calculate the pollutant loads. So, it was required to use the discharge transfer function to be able to work in terms of pollutant load.
The simplest way to transfer the discharge is to establish
a linear function between the streamlow and a ratio between the drainage areas of the water quality station and the streamlow
measurement station (COLLISCHONN; TASSI, 2008; TUCCI,
2002). To estimate the streamlow at a place without data, the
correlation equation is deined as the following (Equation 1):
WQ WQ Flow
Flow
A
Q Q x
A
= (1)
where: QWQ= discharge at the water quality monitoring station;
QFlow= discharge at the streamflow measurement station; AWQ= Drainage area of the water quality monitoring station;
AFlow= Drainage area of the streamlow measurement station.
The empirical limitations suggested by Euclydes (2007) to adopt the discharge transfer procedure proportional to the respective catchment area were the following: (i) the difference
(absolute value) between the drainage area of the streamlow measurement station and the place of interest has not exceeded 30% of the drainage area of the watershed of the streamlow measurement station (ii) the streamlow measurement stations
were inserted into the same riverbed and (iii) in an area featuring resembling hydrologic behavior (hydrologically homogeneous areas).
The water quality monitoring stations used in the study had daily discharge measurement data provided by a local measurement facility (water quality monitoring station at the same place as a
streamlow measurement station), or located close to it (water quality monitoring station near a streamlow measurement station).
A measurement facility for discharge was considered as located close when the relation of drainage areas (water monitoring facility area divided by the area of the place where the discharge measurement was done) was between 0.7 and 1.3.
The quantiication of the pollutant loads was provided
by Equation 2, which consists of multiplying the pollutant
concentration values found at each station by the river streamlow
discharge at the same place. The pollutant load was determined for the selected water quality parameters.
(
1)
(
3)
(
3 1)
1
concentration g m x flow m day Load kg day
1000 (g kg )
− −
−
−
= (2)
Trend analysis
Space-time series trend analyses at each monitoring station were calculated in terms of concentration and load for each selected parameters.
The time series analysis was calculated by adopting the following steps: checking the time series autocorrelation by using
the Spearman Correlation test, checking signiicant differences
occurring among the seasons of the year with Kruskal-Wallis test,
and inally applying time trend tests.
Therefore, initially, the data collected over a three-month period were compared to each other by the Kruskal-Wallis test followed by Dunn’s multiple comparison test (when applicable),
with a signiicance level of 5%, in order to detect signiicant
differences between measurement data collected over the seasons of the year.
The comparison between the data collected over four trimesters of the year performed by Kruskal-Wallis’ test was carried out in order to check for the presence or absence of seasonality
factors. Thus, in case of signiicant differences found from one trimester to another (i.e., p < 0.05), then there was inluence of
the seasonality on the data collection and Seasonal Mann-Kendall (SMK) trend test was considered.
In cases in which p-value resulting from Kruskal-Wallis
test for seasonality was not considered signiicant (p > 0.05), the
time trend of the parameter was checked by Mann-Kendall’s (MK) trend test. The statistic S value of the test shows whether there was a positive or negative trend for the parameter. For both, MK and
Table 1. Description of the water quality monitoring stations of the Verde River Basin.
Station Description Latitude
(º decimals)
Longitude (º decimals)
BG024 Baependi River downstream from the city of Baependi -21.94 -44.89
BG026 Verde River upstream from the city of Conceição of Verde River -21.95 -45.09
BG030 Lambari River in the city of Cristina -22.22 -45.27
BG031 Lambari River upstream from the conluence of Verde River -21.78 -45.21
BG032 Verde River in the city of Três Corações -21.70 -45.26
BG034 Peixe River downstream from the river mouthr of Ribeirão Vermelho -21.65 -45.12
BG035 Verde River in the locality of Flora -21.64 -45.36
BG037 Verde River downstream from the city of Varginha -21.61 -45.52
BG038 Lambari River downstream from the city of Lambari -21.93 -45.26
Table 2. Description of streamlow measurement stations along
Verde River Basin.
Code Station Water course Latitude (º decimals)
Longitude (º decimals)
1 61460000 Verde River -21.89 -45.08
2 61473000 Baependi River -21.95 -44.88
3 61484000 Lambari River -22.21 -45.27
4 61500000 Lambari River -21.87 -45.26
5 61510000 Verde River -21.70 -45.25
6 61520000 Peixe River -21.68 -45.26
SMK tests all selected time series data entries were used because the sampling frequency was the same for all monitoring stations.
Later, to conirm the results found by time trends, the
Spearman’s Correlation Test was applied in order to check the autocorrelation in the time series. Thus, the monitoring data entries were ordered in ascending order, and then related with
time. Correlations with p-values lower than 0.05 (conidence level up to 95%) were considered signiicant, i.e., there is a trend over the time for the analyzed parameter at some speciic station. It is worthy remarking that Spearman’s rank correlation coeficient should be applied as an exploratory tool together with other
information, and the conclusions should be based on all the results (GAUTHIER, 2001).
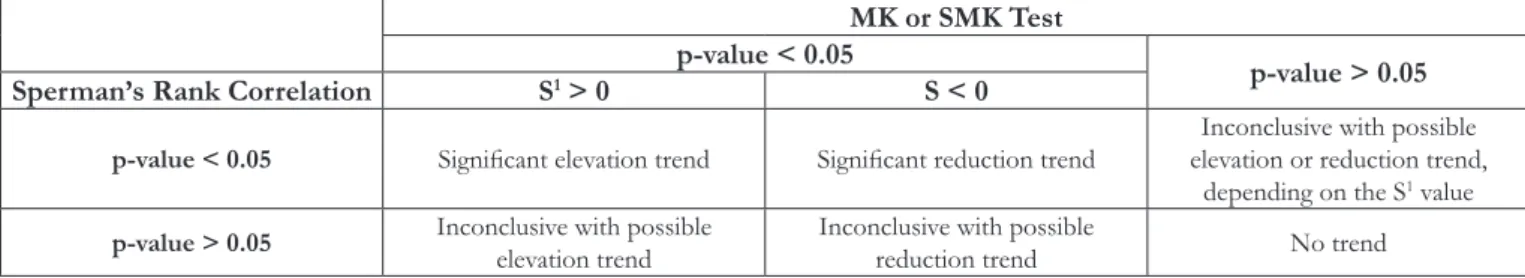
Depending on possible combinations of the results as shown in the Chart 1, the results of the two tests were analyzed in order to determine the time trend of each parameter for each station.
By performing time trend analyses it was possible to evaluate the evolution of water quality at the monitoring stations in terms of load and concentrations of the studied parameters. In order to better understand the results of the statistic tests, charts were drawn based on the time series data, for a better visualization of the trends over a period of time, as well maps for each selected parameter were elaborated for a better spatial visualization of trends in each monitoring station.
All test related to the time trends were performed by using Statistica 10.0 e XLStat 2014.5 softwares. It is worthy remarking that the adoption of such analysis procedure has been reported by other authors (GROPPO et al., 2008; CHRISTOFARO; LEÃO, 2009; TRINDADE, 2013; BARBOSA, 2015).
RESULTS AND DISCUSSION
Great differences were found between the results shown in the Table 3 (concentration data) and Table 4 (load data). The trend analysis of concentrations of parameters for each station showed an average of 66% results different than those found for load, and they indicated a prevailing increasing trend. The monitoring stations that presented bigger differences among the results found by performing the two analyses were BG035 and BG031 (83% of the results), BG037 (75%), followed by BG026, BG032, BG038 and BG034 (67%). If the parameters are considered, the biggest differences between the analyses of concentration and load are for the following parameters: total chloride and BOD (89%), total ammoniacal nitrogen (78%), and total phosphorus (67%).
In general, concentrations of the parameters that presented
the most signiicant elevation trends were nitrate (100%), total
chloride (89%) and total ammoniacal nitrogen (44%), considering all nine stations analyzed (Table 3). On the other hand, the reduction
trend was more expressive for concentrations of pheophytin a
(89%), chlorophyll a (44%) and total suspended solids (33%). Regarding the concentration of some parameters, the
absence of a statistically signiicant time trend has been identiied
over the analysis for the parameters thermotolerant coliforms
(100%), total phosphorus and Chemical Oxygen Demand (78%).
Regarding the general evaluation of the results related to the load data (Table 4), it was found that reduction trend occurred at higher frequencies for the parameters pheophytin a (100%), total phosphorus (78%), chlorophyll a and total solids (67%).
However, elevation trend was observed only for the nitrate parameter (22%) of all load data analyzed. And, by analyzing the
load data, the absence of trend was identiied for some variables
Chart 1. Possible combinations of the results of time trend analysis based on Spearman’s Correlation Test and Mann-Kendall test results.
MK or SMK Test p-value < 0.05
p-value > 0.05 Sperman’s Rank Correlation S1 > 0 S < 0
p-value < 0.05 Signiicant elevation trend Signiicant reduction trend
Inconclusive with possible elevation or reduction trend,
depending on the S1 value
p-value > 0.05 Inconclusive with possible
elevation trend
Inconclusive with possible
reduction trend No trend
1Statistics of Mann-Kendall’s test/Mann-Kendall Seasonal test. Source: Adapted by Costa (2014).
Table 3. Results of time trend data analysis of concentration of water quality parameters studied at nine monitoring stations distributed in Verde River Basin from 2008 to 2014.
Parameter BG026 BG032 BG035 BG037 BG024 BG030 BG038 BG031 BG034
Cl -T (mg L
-1) ↑ ↑ ↑ ↑ - ↑ ↑ ↑ ↑
Cl-a (µg L-1) ?↓ - - - ↓ ↓ ↓ ↓
-Therm. Col. (MPN (100 mL)-1) - - - - - - - -
-BOD (mg L-1 O
2) - ↑ - - - ↑ - ?↑
-COD (mg L-1 O
2) - - ?↑ - - - - ?↑
-Pheoph-a (µg L-1) ↓ ↓ ↓ ↓ ↓ ↓ ↓ ↓
-PT (mg L-1) - - - - - - - - ↓
N-NO3- (mg L-1 N) ↑ ↑ ↑ ↑ ↑ ↑ ↑ ↑ ↑
N-NH4+ T (mg L
-1 N) - ↑ ?↑ ↑ - ↑ ↑ -
-TSS (mg L-1) ↓ ↓ - - - - ↓ -
-TS (mg L-1) ?↓ ↓ - - - ?↓ ↓ -
such as, for example, chemical oxygen demand (78%), total
ammoniacal nitrogen (78%), thermotolerant coliforms (56%) and nitrate (56%).
The concentration trend analysis showed higher elevation or possible elevation trends results (27%) than the load trend
analysis (4%). Similar indings were also observed by. Barbosa,
Trindade and Oliveira (2013) and Coelho (2013) have had also
similar indings. In general, the concentration data was more
stable as 54% of the analyses presented no trend over the time against 32% of analyses without trend for the load data. Many
parameters did not show any signiicant trend and as previously
discussed this does not prove that there is no trend.
In order to better understand the results, time trend analysis
of low measurement data are represented in all the locations of
the monitoring stations, in Figure 2. The results indicate mostly
reduction trends in lows measurements along the whole water basin for the analyzed period, which conirms the elevation results
for the concentration data and load reduction values.
When carrying out a more detailed analysis, it is noticed that concentrations of total nitrate and total chloride parameters showed an elevation trend in all monitoring stations analyzed,
with exception BG024 station, which showed no trend for total
chloride. As a larger part of the watershed is occupied by agricultural activity, the surface runoff occurring in fertilized soil is a major factor that contributes to the release of such elements into the water body, alongside urban drainage system.
Nevertheless, the load trends of these parameters showed different behavior. For the total chloride parameter, out of nine
monitoring stations analyzed, ive showed reduction or inconclusive
with possible reduction trend. While the nitrate parameter showed an elevation or inconclusive with possible elevation trend only at four monitoring stations, namely BG032, BG035 and BG037, which
are in the lower Verde River, and BG034 located in Peixe River.
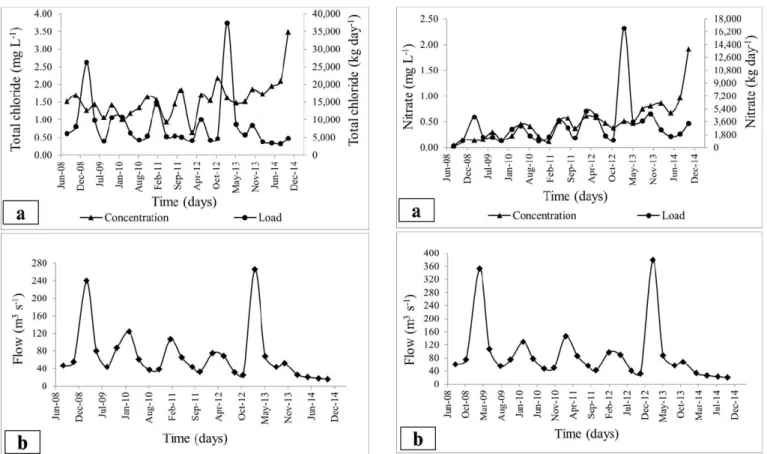
Figure 3a presents the total chloride time series at BG032
station, which showed signiicant elevation trend in the analysis
of concentration data, while in the analysis of load data showed
reduction trend over time. To complement these analyses, a low
time series was also presented regarding this station (Figure 3b). Initially, there is an elevation trend for the concentration data
and a reduction trend for load data. In order to understand such
behavior, it can be analyzed a speciic data collection date, i.e., Oct-31st, 2014. In this date the watercourse low was at the
lowest recorded over the period evaluated (15.60 m3 s-1), so that measuring only the concentration data the highest time series value for concentration (3.48 mg L-1) was reached. Once more is
evident the need to evaluate water quality by analyzing low and
concentration data to achieve more consistent analyses. In Table 5 is presented an interpretation for the total chloride parameter time series results.
Only at two monitoring stations the trend results for concentration and load were the same for the nitrate parameter,
i.e., BG032 and BG035 located by the inal section of Verde River,
which receives discharges of pollutants from the whole watershed. Figure 4a shows the time series evolution of concentration and load data for the nitrate parameter at the station BG035. Even
with the decrease of the values related to the streamlow over
the time series (Figure 4b), an elevation trend of the load values were observed, which indicates actual environmental degradation
intensiication.
An elevation trend of nitrate concentration was noticed
at all stations alongside a reduction low measurement trend,
or inconclusive reduction trend, while the load data showed an elevation trend at some stations (Table 6), which indicates that an increase in the concentration causes an increase in the pollutant loads once the discharge decreases.
Furtherly analyzing Table 3, it is worthy underlining that concentrations for the thermotolerant coliforms parameter did not
present signiicant trends at the monitoring stations. The absence
of trend does not mean that the degradation will be held back, but that it has been stabilized at a very high level. Other studies in which concentration data was analyzed also showed high concentrations of thermotolerant coliforms in all water bodies of the state of Minas Gerais. Usually, the values are very high, i.e., above the detection range by the analytic method adopted, and so no trend was observed (BARBOSA, 2015; CALAZANS, 2015; TRINDADE, 2013).
Regarding the load data analysis, the thermotolerant
coliforms parameter of showed signiicant reduction trend at
Table 4. Results of time trend data analysis of loads of water quality parameters studied at nine monitoring stations in Verde River Basin from 2008 to 2014.
Parameter BG026 BG032 BG035 BG037 BG024 BG030 BG038 BG031 BG034
Cl -T (kg day
-1) ↓ ↓ - ?↓ - - ↓ ↓
-Cl-a (kg day-1) ↓ ↓ ?↓ - ↓ ↓ ↓ ↓ ?↓
Therm. Col. (MPN day-1) ↓ - - ↓ - - ↓ ↓
-BOD (kg day-1 O
2) ↓ ↓ ?↓ ?↓ ?↓ - ↓ ↓ ?↓
COD (kg day-1 O
2) - - - ↓ - - ↓ -
-Pheoph-a (kg day-1) ↓ ↓ ↓ ↓ ↓ ↓ ↓ ↓ ↓
PT (kg day-1) ↓ ↓ ↓ ↓ - - ↓ ↓ ↓
N-NO3- (kg day-1 N) - ↑ ↑ ?↑ - - - - ?↑
N-NH4+
T (kg day-1 N) ?↓ - - - ↓
-TSS (kg day-1) ↓ ?↓ ↓ ?↓ ↓ - ↓ ↓
-TS (kg day-1) ↓ ?↓ ?↓ ↓ ↓ ?↓ ↓ ↓ ↓
Table 5. Time series results of analyses of concentration and load data for total chloride, and of low measurements recorded at
nine Verde River monitoring stations.
Parameter (Cl
-T) BG026 BG032 BG035 BG037 BG024 BG030 BG038 BG031 BG034
Concentration ↑ ↑ ↑ ↑ - ↑ ↑ ↑ ↑
Load ↓ ↓ - ?↓ - - ↓ ↓
-Flow ↓ ↓ ?↓ ↓ ?↓ ?↓ ↓ ↓ ?↓
Note - ↑ elevation trend; ↓ reduction trend; ?↑ inconclusive with elevation trend; ?↓ inconclusive with reduction trend; - with no trend.
Table 6. Time series results of analyses of concentration and load data for nitrate load parameter, and of low measurements recorded
at nine Verde River monitoring stations.
Parameter (N-NO3-) BG026 BG032 BG035 BG037 BG024 BG030 BG038 BG031 BG034
Concentration ↑ ↑ ↑ ↑ ↑ ↑ ↑ ↑ ↑
Load - ↑ ↑ ?↑ - - - - ?↑
Flow ↓ ↓ ?↓ ↓ ?↓ ?↓ ↓ ↓ ?↓
Note - ↑ elevation trend; ↓ reduction trend; ?↑ inconclusive with elevation trend; ?↓ inconclusive with reduction trend; - with no trend.
Figure 2. Map of results of time trend analysis of low measurements at the Verde River Basin, indicating space trends among nine
the monitoring stations BG026, BG031, BG037 and BG038, while at the other stations no trend was observed. However, a
combined analysis of concentration, load and low showed that
the concentrations recorded at all stations remained without trend
independently on the streamlow behavior, which only inluenced
the load (Table 7). This results indicates that the monitoring station situation regarding thermotolerant coliforms remained the same with high concentrations due to the lack of sewage systems to treat the wastewater discharged by the municipalities around the watershed.
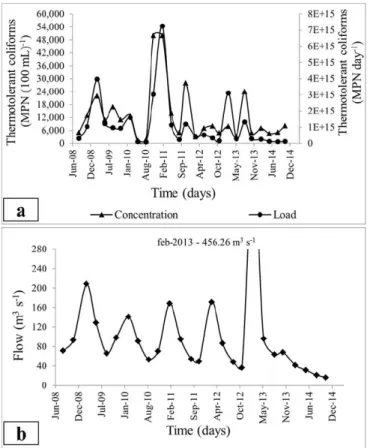
Figure 5a presents time series of concentration and load values recorded at the station BG037, while Figure 5b shows
the low time series. The station BG037 presented higher load
values compared to the others stations, i.e., an average value of 4.82E14 MPN day-1, which may be explained by the fact that it is the last station in the watershed, and receives all pollutant discharge.
Total phosphorus concentration had reduction trend only at the BG034 station, while the other ones showed no trend, unlike what was observed for the nitrate parameter. Phosphorus
concentration was expected to follow the same trend as nitrate
parameter, since agricultural areas mainly occupy the watershed but it was not observed this trend. However, as already known, negative results for trends will not imply the absence of trends (HELSEL; HIRSCH, 2002).
The analysis of load data also indicated a reduction trend,
but these trend results occurred at all monitoring stations, except
BG024 and BG030.
As previously discussed for the thermotolerant coliforms
parameter, at most stations the low data only inluenced the load
data, while the concentration series showed no trend.
At the station BG034 it was observed a reduction trend of total phosphorus concentration values despite of the decrease in
the low measurement values (Figures 6a and 6b). In this case, these
results indicate that a decrease in the concentration is intimately related to the decrease of a pollutant input in the basin, as shown in details in Table 8 for total phosphorus parameter.
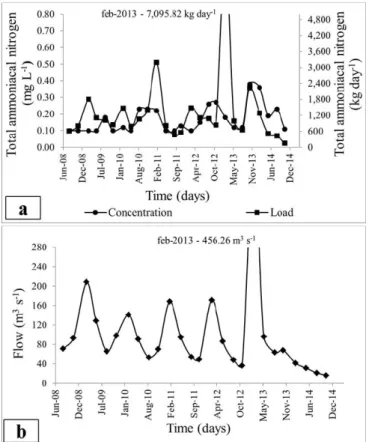
Regarding the concentration of ammoniacal nitrogen
parameter, signiicant elevation or possible elevation trends at two
Table 7. Time series results of analyses of concentration and load data for thermotolerant coliforms parameters, and of low
measurements recorded at nine Verde River monitoring stations.
Parameter (Therm. Col.) BG026 BG032 BG035 BG037 BG024 BG030 BG038 BG031 BG034
Concentration - - -
-Load ↓ - - ↓ - - ↓ ↓
-Flow ↓ ↓ ?↓ ↓ ?↓ ?↓ ↓ ↓ ?↓
Note - ↑ elevation trend; ↓ reduction trend; ?↑ inconclusive with elevation trend; ?↓ inconclusive with reduction trend; - with no trend.
Figure 3. Time series evolution of the station BG032 from the Verde River Basin recorded from 2008 to 2014. (a) concentration
and load of total chloride parameter, and (b) low.
Figure 4. Time series evolution of the station BG035 from the Verde River Basin recorded from 2008 to 2014. (a) concentration
Table 8. Time series results of analyses of concentration and load data for total phosphorus parameter, and of low measurements
recorded at nine Verde River monitoring stations.
Parameter (PT) BG026 BG032 BG035 BG037 BG024 BG030 BG038 BG031 BG034
Concentration - - - ↓
Load ↓ ↓ ↓ ↓ - - ↓ ↓ ↓
Flow ↓ ↓ ?↓ ↓ ?↓ ?↓ ↓ ↓ ?↓
Note - ↑ elevation trend; ↓ reduction trend; ?↑ inconclusive with elevation trend; ?↓ inconclusive with reduction trend; - with no trend.
monitoring stations of Lambari River, were identiied (BG030 and
BG038), and three in the higher Verde River stations (BG032,
BG035 and BG037). At the other stations, no signiicant trends
were observed. On the other hand, a reduction and possible reduction trend was recorded on the database of loads of the stations BG026 and BG031, respectively.
A summary of the trend analysis for this parameter is shown in Table 9. It is worthy noticing that in all monitoring stations where an elevation or possible elevation trend was observed, when the load data in the same stations were analyzed, no trend was
observed (for example, the station BG037 as shown in Figure 7a.).
This can indicate that the increase in concentration values was
due to the decrease in the low values (Figure 7b).
As reported by Trindade (2013), variation in the concentration
may occur due to low changes, and not necessarily due to the existence of a space-time trend.
It is noticed that for all parameters evaluated, when most of cases in which concentration and load data analyses showed
no trend, the low data indicated an inconclusive trend with
possible reduction.
Table 9. Time series results of analyses of concentration and load data for total ammoniacal nitrogen parameter, and of low
measurements recorded at nine Verde River monitoring stations.
Parameter (N-NH4+
T) BG026 BG032 BG035 BG037 BG024 BG030 BG038 BG031 BG034
Concentration - ↑ ?↑ ↑ - ↑ ↑ -
-Load ?↓ - - - ↓
-Flow ↓ ↓ ?↓ ↓ ?↓ ?↓ ↓ ↓ ?↓
Note - ↑ elevation trend; ↓ reduction trend; ?↑ inconclusive with elevation trend; ?↓ inconclusive with reduction trend; - with no trend.
Figure 5. Time series evolution of the station BG037from the Verde River Basin recorded from 2008 and 2014. (a) concentration
and load of thermotolerant coliforms parameter, and (b) low.
Figure 6. Time series evolution of the station BG034 from the Verde River Basin recorded from 2008 to 2014. (a) concentration
In such cases, the inconclusive trend found for low data
may be disregarded and considered as an absence of trend. All results presented corroborate the fact that, for a more encompassing and reliable evaluation of water quality, concentration
and low data must be evaluated together as the changes in the streamlow of the river over time may make more dificult the
interpretation if only concentration data is available as stated also by Anderson et al. (2010).
CONCLUSION
The space-time series analyses indicated differences from load and concentration spatial distributions for most parameters evaluated.
The use of measurements of pollutant concentration
proved to be ineficient to water quality evaluation, and therefore,
for water resource management. Thus, it is recommended that
concentration data should be jointly evaluated with low data
to avoid untrue results by the dilution effect, as the decrease in concentration of certain parameter will not necessarily imply that there was a degradation of the pollutant or restriction of its sources. The decrease may have simply been occurred due to an
increase in the low rate, and consequently, the pollutant dilution. The pollutant load data analysis, disregarding the streamlow
behavior and concentration, did not provide conclusive results as the changes in the load values may be caused by changes in the
streamlow or in the concentration.
ACKNOWLEDGEMENTS
The authors thank IGAM - Water Management Institute of Minas Gerais - for providing water quality measurement data, and
ANA - The National Water Agency for providing streamlow data.
REFERENCES
ANA – AGÊNCIA NACIONAL DE ÁGUAS. Portal da qualidade das águas. Brasília: ANA, 2016. Available from: <http://www2.
ana.gov.br/Paginas/imprensa/noticia.aspx?id_noticia=13074>.
Access on: 24 sept. 2016.
ANDERSON, H.; FUTTER, M.; OLIVER, I.; REDSHAW, J.; HARPER, A. Trends in Scottish River water quality. Washington: Environment Protection Agency, 2010. 178 p.
ANTONOPOULOS, V. Z.; PAPAMICHAIL, D. M.; MITSIOU, K. A. Statistical and trend analysis of water quality and quantity data for the Strymon River in Greece. Hydrology and Earth System Sciences, v. 5, n. 4, p. 679-691, 2001. http://dx.doi.org/10.5194/ hess-5-679-2001.
BARBOSA, P. E.; TRINDADE, A. L. C.; OLIVEIRA, S. M. A. C.
Confirmação estatística da hipótese do impacto da sazonalidade na variação da carga de sólidos totais e coliformes termotolerantes no rio
São Francisco, em Minas Gerais. In: CONGRESSO BRASILEIRO DE ENGENHARIA SANITÁRIA E AMBIENTAL, 27., 2013, Goiânia, GO. Anais... Rio de Janeiro: Associação Brasileira de
Engenharia Sanitária e Ambiental, 2013.
BARBOSA, T. B. C. Avaliação da qualidade das águas Supericiais da sub-bacia do rio Paracatu em função do uso e Ocupação do solo. 2015. 156 f. Dissertação (Mestrado em Saneamento, Meio Ambiente e
Recursos Hídricos) - Escola de Engenharia, Universidade Federal
de Minas Gerais, Belo Horizonte, 2015.
CALAZANS, G. M. Avaliação e proposta de adequação da rede de
monitoramento da qualidade das águas supericiais das sub-bacias do rio
das Velhas e do rio Paraopeba, utilizando técnicas estatísticas multivariadas. 2015. 196 f. Dissertation (Master’s thesis) - Escola de Engenharia, Universidade Federal de Minas Gerais, Belo Horizonte, 2015.
CBH GRANDE – COMITÊ DA BACIA HIDROGRAFICA DO RIO GRANDE. Comitê de Bacia Hidrográica do Rio Verde: GD4.
Brasília: CBH Grande, 2015. Available from: <http://www.grande. cbh.gov.br/GD4.aspx>. Access on: 12 oct. 2015.
CHANG, H. Spatial analysis of water quality trends in the Hain River basin, South Korea. Water Research, v. 42, n. 13, p. 3285-3304, 2008. PMid:18490047. http://dx.doi.org/10.1016/j.watres.2008.04.006.
CHRISTENSEN, V. G.; RASMUSSEN, P. P.; ZIEGLER, A. C. Real-time water-quality monitoring and regression analysis to estimate nutrient and bacteria concentrations in Kansas streams. Water Science and Technology, v. 45, n. 9, p. 205-211, 2002. PMid:12079104.
CHRISTOFARO, C.; LEÃO, M. M. D. Caracterização temporal do
arsênio nos cursos d’água da bacia hidrográfica do Rio das Velhas,
MG, Brasil, ao longo de uma década (1998-2007). Ambiente e Água, v. 4, n. 3, p. 54-66, 2009. http://dx.doi.org/10.4136/ambi-agua.102.
Figure 7. Time series evolution of the station BG037 from the Verde River Basin recorded from 2008 and 2014. (a) concentration
COELHO, M. Estratégia de monitoramento da qualidade da água para a gestão de recursos hídricos em bacias urbanas. 2013. 147 f. Dissertation
(Master’s thesis) - Universidade Federal do Paraná, Curitiba, 2013.
COLLISCHONN, W.; TASSI, R. Introduzindo hidrologia. Porto
Alegre: Instituto de Pesquisas Hidráulicas, UFRGS, 2008.
COSTA, E. P. Avaliação da violação de parâmetros de qualidade das águas
supericiais aos limites da legislação mineira em sub-bacias hidrográicas
do rio São Francisco. 2014. 163 f. Monograph (Master’s Degree) - Universidade Federal de Minas Gerais, Belo Horizonte, 2014.
ECOPLAN ENGENHARIA. Lume Estratégia Ambiental. Comitê da Bacia Hidrografica do Rio Verde. Instituto Mineiro de Gestão das Águas. Plano Diretor de Recursos Hídricos da Bacia do Rio Verde: resumo executivo. Minas Gerais: Ecoplan Engenharia, 2010a. 75 p.
ECOPLAN ENGENHARIA. Lume Estratégia Ambiental. Comitê da Bacia Hidrografica do Rio Verde. Instituto Mineiro de Gestão das Águas. Plano Diretor de Recursos Hídricos da Bacia do Rio Verde. Minas Gerais: Ecoplan Engenharia, 2010b. 400 p. v. 1A.
EUCLYDES, H. P. (Ed.). Atlas digital das águas de Minas: uma ferramenta para o planejamento e gestão dos recursos hídricos. 2nd ed. Viçosa: Universidade Federal de Viçosa, Fundação Rural Mineira, Instituto Mineiro de Gestão das Águas, 2007. 78 p.
GAUTHIER, T. D. Detecting trends using Spearman’s Rank Correlation Coefficient. Environmental Forensics, v. 2, n. 4, p. 359-362, 2001. http://dx.doi.org/10.1006/enfo.2001.0061.
GILBERT, R. O. Statistical methods for environmental pollution monitoring. New York: John Wiley & Sons, 1987. 320 p.
GOCIC, M.; TRAJKOVIC, S. Trend analysis of water quality parameters for the Nisava River. Architecture and Civil Engineering, v. 11, n. 3, p. 199-210, 2013. http://dx.doi.org/10.2298/ FUACE1303199G.
GROPPO, J. D.; MORAES, J. M.; BEDUSCHI, C. E.; GENOVEZ, A. M.; MARTINELLI, L. A. Trend analysis of water quality in some rivers with different degrees of development within the São Paulo state, Brazil. River Research and Applications, v. 24, n. 8, p. 1056-1067, 2008. http://dx.doi.org/10.1002/rra.1091.
HELSEL, D. R.; HIRSCH, R. M. Statistical methods in water resources: techniques of water-resources investigations. Virgínia: United States Geological Survey, 2002. 522 p. chap. 3, v. 4.
IGAM – INSTITUTO MINEIRO DE GESTÃO DAS ÁGUAS.
Monitoramento da qualidade das águas supericiais da bacia do rio Grande
em 2009. Belo Horizonte: IGAM, 2010. 287 p. Relatório anual.
OLSEN, R. L.; CHAPPELL, R. W.; LOFTIS, J. C. Water quality sample collection, data treatment and results presentation for principal components analysis: literature review and Illinois River watershed case study. Water Research, v. 46, n. 9, p. 3110-3122, 2012. PMid:22487543. http://dx.doi.org/10.1016/j.watres.2012.03.028.
PASSELL, H. D.; DAHM, C. N.; BEDRICK, E. J. Hydrological and geochemical trends and patterns in the upper Rio Grande, 1975–1999.
Journal of the American Water Resources Association, v. 40, n. 1, p. 111-127, 2004. http://dx.doi.org/10.1111/j.1752-1688.2004.tb01014.x.
QIAN, Y.; MIGLIACCIO, K. W.; WAN, Y.; LI, Y. Trend Analysis of Nutrient Concentrations and loads in selected canals of the Southern Indian River Lagoon, Florida. Water, Air, and Soil Pollution, v. 186, n. 1-4, p. 195-208, 2007. http://dx.doi.org/10.1007/s11270-007-9477-y.
QUILBÉ, R.; ROUSSEAU, A. N.; DUCHEMIN, M.; POULIN,
A.; GANGBAZO, G.; VILLENEUVE, J.-P. Selecting a calculation method to estimate sediment and nutrient loads in streams:
application to the Beaurivage River (Québec, Canadá). Journal
of Hydrology, v. 326, n. 1-4, p. 295-310, 2006. http://dx.doi. org/10.1016/j.jhydrol.2005.11.008.
SUN, C. C.; SHEN, Z. Y.; XIONG, M.; MA, F. B.; LI, Y. Y.; CHEN, L.; LIU, R. M. Trend of dissolved inorganic nitrogen at stations downstream from the Three-Gorges Dam of Yangtze River. Environmental Pollution, v. 180, p. 13-18, 2013. PMid:23727562.
http://dx.doi.org/10.1016/j.envpol.2013.05.003.
TABARI, H.; MAROFI, S.; AHMADI, M. Long-term variations of water quality parameters in the Maroon River, Iran. Environmental Monitoring and Assessment, v. 177, n. 1-4, p. 273-287, 2011. PMid:20700652. http://dx.doi.org/10.1007/s10661-010-1633-y.
TRINDADE, A. L. C. Aplicação de técnicas estatísticas para avaliação
de dados de monitoramento de qualidade das águas supericiais da porção
mineira da bacia do rio São Francisco. 2013. 181 f. Dissertation (Master’s thesis) - Escola de Engenharia, Universidade Federal de Minas Gerais, Belo Horizonte, 2013.
TUCCI, C. E. M. Regionalização de vazões. 1st ed. Porto Alegre: Editora da UFRGS/ABRH, 2002. 256 p.
TUCCI, C. E. M. Hidrologia: ciência e aplicação. 4th ed. Porto Alegre: Editora da UFRGS/ABRH, 2009. 943 p.
ZUCCO, E.; PINHEIRO, A.; DESCHAMPS, F. C.; SOARES, P. A. Metodologia para estimativa das concentrações em cursos
de água para vazões de referência: uma ferramenta de suporte e
apoio ao sistema de gestão de bacias hidrográficas. REGA, v. 9, n.
1, p. 25-37, 2012. http://dx.doi.org/10.21168/rega.v9n1.p25-37.
Authors contributions
Carolina Cristiane Pinto: Contributed to the conception of work, data acquisition and treatment, discussion, writing and review of the article.
Stella Braga Andrade: Contributed to the data treatment, analysis of results and drafting the article.
Éber Andrade Pinto: Contributed to the analysis of data, deinition
of methodologies and drafting the article.
Sílvia Maria Alves Corrêa Oliveira: Contributed to the orientation of the study, deinition of methodologies, discussion of results,