Performance Evaluation of Sub-space Techniques for Array
Processing in TDMA Systems
zyxwvutsrqponmlkjihgfedcbaZYXWVUTSRQPONMLKJIHGFEDCBA
F.R.P. Cavalcanti, C.E.R. Fernandes, A.L.F. de Almeida, J.C.M. Mota.
[email protected], [email protected], [email protected], [email protected]Universidade Federal do Cearh, Campus do Pici, CP: 6004 CEP: 60455-970, Fortaleza-CE, Brazil
zyxwvutsrqponmlkjihgfedcbaZYXWVUTSRQPONMLKJIHGFEDCBA
Abstract
zyxwvutsrqponmlkjihgfedcbaZYXWVUTSRQPONMLKJIHGFEDCBA
-
zyxwvutsrqponmlkjihgfedcbaZYXWVUTSRQPONMLKJIHGFEDCBA
I n studying the possibility of increasing wirelesssystem capacity, we evaluate the performance o f some algorithms that make use of sub-space techniques to estimate the covariance matrix, and compare these results to those obtained through traditional methods, such as the Direct Matrix Inversion -
Maximum Signal-to-Noise Ratio and Maximal Ratio Combining. Illustrative simulation results demonstrate that the Minimum Mean Square Error - signal Sub-Space and the Weighted Sub- Space algorithms may lead to a better performance than full- rank conventional algorithms. Furthermore, a more elaborate system-level simulation in a T D M A IS-136 context is performed and it shows that such benefits also appear in a more practical scenario.
I . INTRODUCTION
Delayed multipaths and strong interference sources are some of the main characteristics of mobile radio communication systems. It is well known that the major challenges in this field are related to the mitigation of impairments caused by this harsh environment, such as Inter- Symbol Interference (ISI) and CO-Channel Interference (CCI), which can degrade Bit Error Rate (BER) performance, leading to a poor transmission quality.
Several signal processing techniques have been applied in order to achieve increased capacity and improved performance in high-speed data applications, as would be expected to fulfill the requirements of the incoming third generation of mobile communications. Adaptive Antenna Array (AAA) diversity [ l ] is a classical solution for those problems of combating multipath fading and canceling interfering signals.
In this context, classical solutions include Direct Matrix Inversion (DMI) and Maximal Ratio Combiner (MRC) algorithms [2]. However, these methods, in particular the MRC, exhibit considerable performance degradation in strong CCI scenarios.
For antenna array processing we concentrate on two optimization criteria. The first is the Maximum Signal-to- Interference-plus-Noise Ratio (MSINR) and the second is the Minimum Mean-Squared Error (MMSE). The sub-space techniques used in this work are based on Reduced-Rank (RR) modeling and on Sub-space (SS) weighting. The algorithms based on the RR approach are the MSINR- Eigencanceler (MSINR-EC) [3,4] and the MMSE
-
signal Sub-space (MMSE-SS) [5] and they work with the noise and signal sub-spaces respectively. The Weighted Sub-Space algorithm (MSINR-WSS) [5] is an example of a sub-space weighting algorithm based on a MSINR criterion. For interference reduction in the presence of CCI, improved BER performance can be achieved by these techniques over traditional ones, such as MSINR-based DMI (MSINR-DMI) and MRC algorithms. We point out that one of the limitations of classical RR techniques is the need of a priori knowledgeThis work is supported by the Ericsson Research Brazilian Branch under
the ERBB/UFC Technical Cooperation Contract.
about the number of CCI sources present. The SS weighting approach is one way to overcome this limitation.
In this paper, we evaluate the performance of these SS
techniques in comparison to existing traditional adaptive array algorithms. Two sets of simulation results are presented. First, illustrative simulation results with a semi-static fading channel are presented for prescribed interference and noise scenarios. This set of results aim to highlight the properties of each algorithm in different Signal-to-Interference Ratio (SIR) and SNR scenarios.
Following these results, we present a system-level evaluation of some selected algorithms from which we want to show the feasibility of increasing capacity of a TDMA-IS-136-like system [6]. In this case, a Space-Time (ST) channel model is used. Furthermore, a modified version of the MMSE-SS algorithm with dynamic rank selection is
used to cope with the time-varying nature of the fading channel. In both sets of simulation results, the benefits of employing the sub-space techniques are verified.
In the remainder of this paper, we organize the sections as follows: Section I1 describes the signal model. In section Ill, we review the expressions for the SS algorithms of interest. Some illustrative simulations are presented in section IV, in order to highlight the benefits of the SS techniques. The system-level simulator is the subject of section V, along with the corresponding simulation results, and, at last, in section VI, we draw some conclusions and perspectives.
11. SIGNAL MODEL
Let us assume a mobile communication system that employs an N-element uniform linear Adaptive Antenna Array (AAA) at the base station. We represent the signal
received at the array as x[n] = [x,[n],x,[n],
zyxwvutsrqponmlkjihgfedcbaZYXWVUTSRQPONMLKJIHGFEDCBA
..., x , _ , [ n ] ] T ,where the superscript T denotes transpose and each entry
zyxwvutsrqponmlkjihgfedcbaZYXWVUTSRQPONMLKJIHGFEDCBA
x k [ n ] , k
zyxwvutsrqponmlkjihgfedcbaZYXWVUTSRQPONMLKJIHGFEDCBA
= 0, 1,...,
N-1, represents the signal received at theantenna element k after coherent demodulation, matched
filtering and sampling at t = nT. The environment is assumed
to be a flat Rayleigh fading channel in the presence of white Gaussian noise and co-channel interference. The signal vector is then represented as:
x [ n ] = u[n]
+
i[n]+
v [ n ] I.(1)
where ~ [ n ] , i[n] and v[n] are the vector components relative to desired user, interference and noise signals, respectively. A , and A , are the desired user and interference
signal amplitudes, respectively. The sequence a[.] represents the equally probable and uncorrelated data symbols for the user of interest. The ambient noise, represented by the vector
=
A , h , ~ [ n l + ~ A , h , z , [ n l + v [ n l ,
/ = I
zyxwvutsrqponmlkjihgfedcbaZYXWVUTSRQPONMLKJIHGFEDCBA
user of interest. The ambient noise, represented by the vector
zyxwvutsrqponmlkjihgfedcbaZYXWVUTSRQPONMLKJIHGFEDCBA
v[
zyxwvutsrqponmlkjihgfedcbaZYXWVUTSRQPONMLKJIHGFEDCBA
n ] ,zyxwvutsrqponmlkjihgfedcbaZYXWVUTSRQPONMLKJIHGFEDCBA
is complex-valued, stationary, zero-mean, whiteGaussian distributed with variance
zyxwvutsrqponmlkjihgfedcbaZYXWVUTSRQPONMLKJIHGFEDCBA
0 ;.
The complex gain for the desired user signal is included in the vector hs, while for interferers signals the gains are represented by the vectors h,, where j = I , ..., L, and L is the number of CCI sources present. Initially, we assume that the channel is stationary over a time-slot corresponding to a prescribed number of symbol periods.
For the moment, it is assumed that spacing between antenna elements is larger than the coherence distance in such a way that fading is independent between any two antennas. Later in this paper, for system-level evaluation purposes, this assumption is relaxed and correlated fading is considered. Perfect slot and symbol synchronization is assumed for the desired and interfering users.
ADAPTIVE ANTENNAS
The output of the AAA optimum combiner is given by
y[n] = WHX[n],
zyxwvutsrqponmlkjihgfedcbaZYXWVUTSRQPONMLKJIHGFEDCBA
where the optimum weight vectorzyxwvutsrqponmlkjihgfedcbaZYXWVUTSRQPONMLKJIHGFEDCBA
w, in theminimum mean square error sense, is expressed as
w = R - ' r , R representing the covariance matrix of the received signal vector and r the cross-correlation vector between the desired signal and the received vector,
r = E{~'[n]x[n]lh,}=
zyxwvutsrqponmlkjihgfedcbaZYXWVUTSRQPONMLKJIHGFEDCBA
AAh,, which is estimated by:111. REVIEW OF SUB-SPACE TECHNIQUES FOR
where the asterisk represents complex conjugation. Here, we used M to denote the number of time samples of the training
sequence, i.e., the window size used in the calculation. Since the covariance matrix is Hermitian, it is possible to diagonalize the matrix R by using a Unitay Similarity
Transformation. The resulting diagonalized matrix is
expressed as follows [7]:
where the N-by-N matrix Q has as its columns the orthonormal set of eigenvectors q , , q , , ,.. , q, of the matrix R , and A is a diagonal matrix which has the associated eigenvalues
A,
,A2
,...
,AN
for the elements of its main diagonal. Owing to the orthonormal nature of the eigenvectors, we find that Q " Q =I
, where I is the N x Nidentity matrix. From this and (3) we rewrite matrix R as follows:
A = Q " R Q ,
(3)zyxwvutsrqponmlkjihgfedcbaZYXWVUTSRQPONMLKJIHGFEDCBA
N
R = Q A Q "
= c A k q k q : . (4)zyxwvutsrqponmlkjihgfedcbaZYXWVUTSRQPONMLKJIHGFEDCBA
k = I
From (1) and the assumption of mutual independence among the user signal, interference and noise, it is clear that we can rewrite R as a sum of matrices, R = R u + R , + R V ,
where R,, R, and
R V
are respectively the covariance matrices of the components, q n ] , i[n] and v[n], of the signal~ [ n ] .
It is straightforward to note that each
A k
can be decomposed into three components,A:)
,A(,)
andAy),
associated with each of the signal components, q n ] , i [ n ]
and v[n], respectively. From this and (3), based on the Karhunen-Lobve expansion [ 7 ] , we can rewrite the
eigenvalues associated to the eigenvectors of the matrix in (4), as:
a
-
+ +The selection of the space of representation is based on an energy criterion, taking into account ( 5 ) and the fact we have
organized the eigenvectors of the covariance matrix in descending order of their associated eigenvalues, such that,
A , 2 A
2 2 . . . 2 A p 2 . . 2 A N , where p is the value that approximates the signal sub-space dimension. This means that nearly the whole signal sub-space can be defined by thep largest eigenvalues,
A,>
A,
2.. .2Ap
, p < N . On the otherhand, we assume the noise sub-space is composed by the remaining eigenvalues, i.e.,
AP+,
2.. .2AN
.A. SS Algorithms for a known number of CCI sources:
In this sub-section, we review the S S algorithms, which
use the information about the quantity of CCI sources present.
The MMSE cost finction is intended to minimize the mean-squared error (MSE) between the array output and the desired signal. Let us assume for the MMSE cost function the signal sub-space is composed by the desired signal plus CCI components. We may express the MMSE covariance matrix as:
, k = 1 ,..., N. ( 5 )
k -
. . A , .
l M
A4 "=I
R,,,, = - C x [ n ] x " [ n ] = R,
+
R~
+
R,,
Alternatively, we can estimate the covariance matrix in (6) by a reduced-rank approximation, which makes use only of the eigenvectors associated to the largest p eigenvalues [ 5 ] .
Therefore, based on (4), the RR approach to the MMSE estimate can be written simply as:
( 7 )
Here, it is as.sumed that p = L+1. This procedure leads to the following sub-space approximation of the weight vector
~ 5 1 :
Note that each selected' eigenvector ;s weighted by its respective eigenvalue, which may be expressed as in ( 5 ) .
The MSINR cost function attempts to maximize the Signal-to-Interference-plus-Noise Ratio (SINR) at the array output. In this case, we assume the signal sub-space is composed only by the CCI components, and we can write the covariance matrix estimate as follows:
Under the MSINR criterion, the sub-space approach for estimation of the covariance matrix is based on the
application of a reduced-rank method, known as the
zyxwvutsrqponmlkjihgfedcbaZYXWVUTSRQPONMLKJIHGFEDCBA
Eigencanceler (EC) [3,4], which performs interference
cancellation by making use of the noise sub-space, which is said to be orthogonal to the interference sub-space. In estimating the Eigencanceler covariance matrix, we employ only the eigenvectors associated to the N - p smallest
eigenvalues of the matrix
zyxwvutsrqponmlkjihgfedcbaZYXWVUTSRQPONMLKJIHGFEDCBA
zyxwvutsrqponmlkjihgfedcbaZYXWVUTSRQPONMLKJIHGFEDCBA
.,,R,,, As a result, we obtain theestimation of the inverse covariance matrix, as follows:
where p = L. This. procedure leads to the following MSINR-
EC weight vector [5]:
As the computation of the -covarian/ce matrix of this algorithm does not take into account the desired user signal
sub-space, we can state that = 0 , V
zyxwvutsrqponmlkjihgfedcbaZYXWVUTSRQPONMLKJIHGFEDCBA
zyxwvutsrqponmlkjihgfedcbaZYXWVUTSRQPONMLKJIHGFEDCBA
k . Therefore, (5)can be rewritten as:
(12)
X F R E q
= X i )
zyxwvutsrqponmlkjihgfedcbaZYXWVUTSRQPONMLKJIHGFEDCBA
+&"',
k =zyxwvutsrqponmlkjihgfedcbaZYXWVUTSRQPONMLKJIHGFEDCBA
1 ,..., N.B. SS Algorithms for an unknown number of CCI sources.
It is still possible to deal with the problem of the AAA optimum combiner considering the more realistic assumption that the number of interferers is not known in advance and therefore, must be estimated by any means. To accomplish this task the MSINR-WSS [5] method works with the eigenvalues of the signal sub-space, in the absence of noise. These eigenvalues are weighted by a non-linear hnction, which is chosen to emphasize the eigenvalues associated with large interferers, leaving them unchanged, and force to zero those associated with weak interferers, if any.
In modeling MSINR-WSS covariance matrix, we assume the signal sub-space is composed only by the CCI components. Thus, we can express the covariance matrix
from (9), just by subtracting the noise power. This leads to:
zyxwvutsrqponmlkjihgfedcbaZYXWVUTSRQPONMLKJIHGFEDCBA
R
= RMSINR-0p
(13)From this and
zyxwvutsrqponmlkjihgfedcbaZYXWVUTSRQPONMLKJIHGFEDCBA
( 5 ) , we see thata;)
= 0 . Therefore,a,
=a;) ,
k = 1, ... ,N, are the estimated eigenvaluesrepresenting the interference in absence of noise. The non- linear function used to weight the sub-spaces is composed by a composition of two TAN-'(*) functions, each one properly scaled and shifted, in such a way as to cause the behavior discussed above. This hnction is used to estimate the interference plus noise matrix, which can be written as [5]:
where f(kJ is the non-linear hnction we have Just described.
As an alternative to the WSS method, we may employ the MMSE criterion in an approach very similar to the MMSE- SS algorithm, for which the number of CCI sources is unknown. Therefore, in considering this method, it is
necessary to perform rank estimation dynamically. Since the energy of the space of representation is not equally distributed into the eigenvectors, an analysis of the eigenvalues may give us some knowledge about which eigenvectors are more important to the weight vector computation. In this analysis, the noise power is a reference parameter (as in [3]), which allows us to select the relevant eigenvectors. The condition to choose the r a n k p is stated as follows:
where bV2 is an estimate of the noise power.
This technique, which is referred to in this paper as MMSE Dynamic Rank Selection (MMSE-DRS), is especially interesting in a fading environment where the actual power of the interferers, and consequently, the SIR, depends on the effect of the channel.
1V. ILLUSTRATIVE SIMULATIONS
a,
>a,
>...>ap
2c?;,
(15)In order to gain some insight about how the sub-space algorithms work under controlled conditions, we performed some simulations using the signal model discussed before. The simulator makes use of a TDMA (time-division multiple-access) slot format composed of 162 symbols. For signal processing purposes, we consider that the first 14 symbols are used for training, and they are followed by the
148 data symbols, which bear the user information. The 14- symbol-long training sequence is used to track the channel and adapt the weight vector during the training period. After this, the weight vector is kept fixed to the end of the slot and used to estimate the array output. An 8-antenna-element array is employed and for the following simulations and BPSK modulation is assumed.
All results were averaged in a range of lo4 to lo5 time- slots, depending on the SNR. We will consider two main situations, one for
a
strong CCI power (Total SIR= OdB), and the other for weaker interference (Total SIR = 7dB). Weare considering all interferers signals have the same power. For the situation shown in Fig. 1, only one CCI component is present, and SIR = 7dB. In this case, since the array counts with several degrees of freedom, all the SS algorithms present good performance, and they outperform MSINR- DMI. However, they are not significantly better than MRC, because the interference power is weak, and such a situation is well suited to this algorithm. Note that for this scenario MRC is even better than MSINR-DMI.
For the next situation, shown in Fig. 2, the overall interference power is left unchanged (SIR = 7dB), but the
number of CCI sources is increased to 3 . The first remark at this point concerns the sensitivity of MSINR-EC to the number of interferers present. Results in Fig. 2 demonstrate that this algorithm presents a significant BER degradation, relative to Fig. 1, showing that the loss of some degrees of freedom in the array structure may be very important to the computation performed by this technique.
Also remarkable in Fig. 2 is that MRC, as well as MMSE- DRS and WSS, is very robust to the quantity of CCI components present, once the overall interference power is
10'
zyxwvutsrqponmlkjihgfedcbaZYXWVUTSRQPONMLKJIHGFEDCBA
j
~:::::::::'
...zyxwvutsrqponmlkjihgfedcbaZYXWVUTSRQPONMLKJIHGFEDCBA
I.. ...zyxwvutsrqponmlkjihgfedcbaZYXWVUTSRQPONMLKJIHGFEDCBA
J . ...I...,...
zyxwvutsrqponmlkjihgfedcbaZYXWVUTSRQPONMLKJIHGFEDCBA
...
zyxwvutsrqponmlkjihgfedcbaZYXWVUTSRQPONMLKJIHGFEDCBA
-4 -_
zyxwvutsrqponmlkjihgfedcbaZYXWVUTSRQPONMLKJIHGFEDCBA
0zyxwvutsrqponmlkjihgfedcbaZYXWVUTSRQPONMLKJIHGFEDCBA
2 4SNR per antenna
zyxwvutsrqponmlkjihgfedcbaZYXWVUTSRQPONMLKJIHGFEDCBA
(dB)Fig.l. Performance of SS algorithms for L=l and SIR=7dB.
All algorithms have similar performances in both cases (1
and
zyxwvutsrqponmlkjihgfedcbaZYXWVUTSRQPONMLKJIHGFEDCBA
3 CCI sources), except for the MSINR-EC, as explainedabove. Results of the third set of simulations can be seen in Fig. 3, In this situation, only one strong interferer is considered, in such a way that SIR = OdB. Comparing to Fig.
1, it is clear that MRC is very sensitive to the received interference power, presenting a significant BER degradation. This degradation was much more moderate for the SS techniques, including the MSINR-EC, emphasizing it
is very robust in view of the overall power received from CCI sources, when the number of interfering signals is fixed.
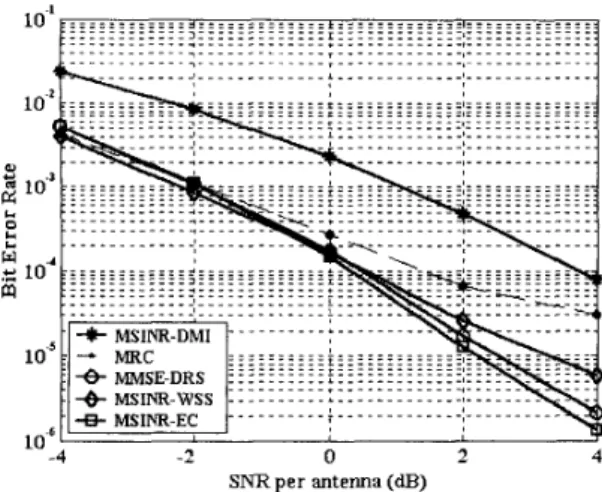
Fig. 4 shows the results obtained for SIR = OdB and 3 CCI components. Comparing Fig. 4 to Fig. 2, we again see the performance loss of the MRC algorithm due to the increase
of total interference power. For the other algorithms, the degradation in performance relative to Fig. 2 is not so
notorious. The effects of decreasing the degrees of freedom to the SS algorithms can be observed once more in a comparison between Fig. 3 and Fig. 4, from which we certify the performance degradation of MSINR-EC due to its sensitivity to the number of CCI sources. It is then possible to conclude that the performance of MSINR-EC is strongly dependent on the degrees of freedom available to the array, and not on the total power delivered by all the CCI signals.
10" ... ... _,_ ... -. .... -, ... e ... -* ... .,. .... -, ...
zyxwvutsrqponmlkjihgfedcbaZYXWVUTSRQPONMLKJIHGFEDCBA
...,...I...I... /... ...-...,...
...,...,...,... ~. .. . . . ~ . ...,.... .. , - - -
...
-4 -3 -2 -1 0 1 2 3 4
S N R per antenna (dB)
Fig. 3. Performance of SS algorithms for L=l and SIR=OdB.
10)
10'
10-
E 10'
5
z
!
in" a"
-4 -3 -2 -1 0 1 2 3 4
S N R per antenna (dB)
Fig.2. Performance of SS algorithms for L=3 and SIR=7dB.
some of the algorithms exhibit a BER floor due to fading. As last, it is possible to verify that for high SNR values,
V. SYSTEM-LEVEL EVALUATION
For a system-level evaluation of the sub-space techniques in focus, we selected a TDMA IS-136 context [6]. The system-level simulator is described in Table I, which summarizes the parameters adopted in the simulation.
Uplink power control is based on standardized maximum and minimum mobile station transmission power [6]. Channel tracking is performed after the training period in the decision-directed mode. A simple link-budget model is adopted with slightly more pessimistic interference levels when compared to the recommended UMTS path loss model [8]. Coherent 8-PSK modulation is employed as expected in hture evolution of TDMA systems (e.g. the EDGE system [IO]). The desired received power at the base station is set so
that an 18 dB Eb/No ratio is perceived in most connections. Our system-level evaluation procedure is as follows. Considering that most TDMA systems are implemented with a 7/21 reuse pattern, we seek the implementation of tighter reuses, such as the 319 pattern. For that purpose, we employ the system level simulator in order to obtain the significant statistics for this particular reuse pattern.
10'1 . . . , . . . , . . . , . . . t . . . r . . . , . . . , . . . ...
.. ....,...*...L...,... , - - -
... ,..., ...,...,...r...(...
...
... .............,......r.......*......
-4 -3 -2 -1 0 1 2 3 4
SNR per antenna (dB)
TABLE I
SYSTEM-LEVEL SIMULATION PARAMETERS
Multicell grid, 7/21,4/12 or 3 /9, 120’ ideal sectors Cell Layout
Sector Antenna Gain
zyxwvutsrqponmlkjihgfedcbaZYXWVUTSRQPONMLKJIHGFEDCBA
11 dBiMobile Antenna Gain 0 dBi Path-loss model
Shadowing Standard Deviation 8 dB Cell Radius 1000 m
351og(d) + shadowing [dB]
Uplink Power Control Yes Uolink Max. Transmission Power 2R dBm Uplink Min Transmission Power
-
7dBmFrequency 900 MHz
Symbol Rate / Modulation 24 3 Kbaud / 8-PSK Desired Received Power at Base -102 dBm Noise Power Density - I 74 dBm/Hz Noise Figure 5 dB
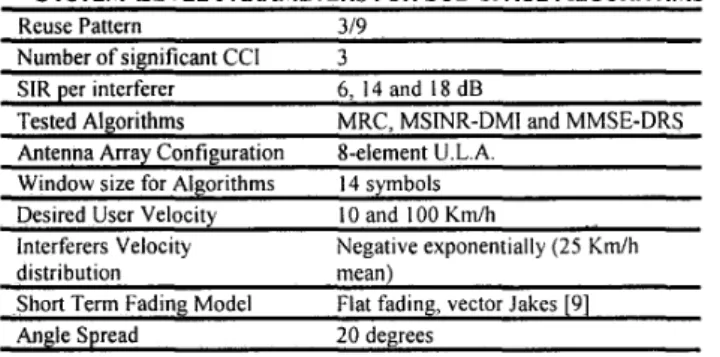
A large number of system snapshots were obtained in order to characterize the interference scenario where users are uniformly distributed in the coverage area. The cumulative distribution functions of the SIR per interferer were obtained and analyzed aiming characterize 90% of the system configurations. Results are summarized in Table 11.
With these parameters in mind, we built a worst-case scenario where the sub-space algorithms were tested. In this sense, the performance results so obtained are expected to be representative of 90% of system configurations.
In order to illustrate the performance of the adaptive antenna algorithms at the system level we compare MRC, MSINR-DMI and the MMSE-DRS algorithms according to the parameters extracted from the system-level simulations.
The Eb/No ratio was varied from 15 to 25 dB, covering
most
zyxwvutsrqponmlkjihgfedcbaZYXWVUTSRQPONMLKJIHGFEDCBA
of the possible occurrences of this parameter at thesystem-level. Table I1 summarizes other simulation parameters.
Results are presented in Fig. 5 for a desired user velocity of
I O km/h and 100 km/h. The gain in E n o of the MMSE-DRS over MSINR-DMI is on the range of 1.5 to 2.5dB. These array gains can be translated in increased cell coverage. On the other hand, even for 100 k m h , a target uncoded BER of
3%
zyxwvutsrqponmlkjihgfedcbaZYXWVUTSRQPONMLKJIHGFEDCBA
[ 6 ] is attained with MMSE-DRS at EbMo less than thetarget of 18dB. This confirms the feasibility of employing the
3/9-reuse pattern with the implementation of this SS
technique.
TABLE I1
SYSTEM-LEVEL PARAMETERS FOR SUB-SPACE ALGORITHMS
Reuse Pattern 3/9 Number of significant CCI 3 SIR per interferer
Tested Algorithms Antenna Array Configuration Window size for Algorithms Desired User Velocitv
6, I4 and I8 dB
MRC, MSINR-DMI and MMSE-DRS 8-element U L A
14 symbols I O and 100 Km/h Interferers Velocity
distribution mean) Short Term Fading Model
Angle Spread 20 degrees
Negative exponentially (25 Km/h
Flat fading, vector Jakes [9]
[-W MMSE-DRS
I
zyxwvutsrqponmlkjihgfedcbaZYXWVUTSRQPONMLKJIHGFEDCBA
15
zyxwvutsrqponmlkjihgfedcbaZYXWVUTSRQPONMLKJIHGFEDCBA
20 25Ebmo
zyxwvutsrqponmlkjihgfedcbaZYXWVUTSRQPONMLKJIHGFEDCBA
(a)Fig. 5. Algorithms performance at system-level
VI. CONCLUSIONS
In this paper, we reviewed some SS techniques for antenna array processing and applied such algorithms in a TDMA system context. Both illustrative and system-level simulation results confirmed the superiority of the SS techniques over conventional methods, such as DMI and MRC. An MMSE-SS algorithm based on a dynamic rank selection provides gains that can be translated into higher coverage or capacity in a TDMA system. Further applications of these techniques comprise the EDGE system where a more challenging propagation environment is present and space-time processing is required.
REFERENCES
[ I ] RAPPAPORT. T. S.. LIBERTI. J . C.. Jr.. Smuri Antennus f o r Wireless
Communications: IS-95 and Third Generation CDMA Applications,
Prentice Hall PTR, New Jersey, 1999.
WINTERS, J. H., “Optimum combining in digital mobile radio with co-channel interference”, IEEE Journal on Sel. Areas in Comm.. pp.
[3] WU, X.. HAIMOVICH, A. M., SHAH, A., “Reduced-rank array processing for wireless communications with applications to IS-54/IS-136”, IEEE Trans on Commun, vol. 48, no. 5. pp. 743-747, May 2000.
[4] WU, X . , HAIMOVICH,
zyxwvutsrqponmlkjihgfedcbaZYXWVUTSRQPONMLKJIHGFEDCBA
A. M., “Adaptive arrays for increasedperformance in mobile communications”, in Proc. 6th Int. Symp. Personal, Indoor and Mobile Radio Communications (PIMRC’95), Toronto, Canada, Sept., 1995, pp. 653-657.
BOCCUZZI, J., PILLAI, S. U,, WINTERS, J. H., “Adaptive antenna array using sub-space techniques in a mobile radio environment with flat fading and CCI”, IEEE, 1999.
[6] TINEIA-I 36-000-8, TDMA Third Generation Wireless, March12000. [7] HAYKIN, S., Adupiive Filter Theory, jrd edition, Prentice Hall Inc.,
New Jersey, 1996.
[8] EST1 TR 101 112, Universal Mobile Telecommunicaiions Sysiem
zyxwvutsrqponmlkjihgfedcbaZYXWVUTSRQPONMLKJIHGFEDCBA
(Umis). Seleciion Procedures f o r the Choice of Radio Transmission
Technologies of ihe UMTS (UMTS 30.03 Version
zyxwvutsrqponmlkjihgfedcbaZYXWVUTSRQPONMLKJIHGFEDCBA
3.2.0), Annex B,[9] BUEHRER. R. M.. KOGIANTIS, A. G., LIU, S., TSAI, J.. UPTEGROVE, D., “Intelligent antennas for wireless communications - uplink”, Bell Labs Technical Journal, July-September, 1999.
[2]
528-539, 1984.
[5]