Diagnostic Performance of
Visual Screening Tests in the
Elderly
Carla Costa Lança1 and Elisabete Carolino2
1 - Escola Superior de Tecnologia da Saúde de Lisboa (ESTeSL) – Instituto Politécnico de Lisboa / CIESP, Escola Nacional de Saúde Pública, UNL, Portugal
2 - ESTeSL-IPL, Portugal
ICNAAM 2011
1. INTRODUCTION
The aging of Portuguese population is characterized by an increase of individuals aged older than 65 years. Preventable visual loss in older persons is an important public health problem. Tests used for vision screening should have a high degree of diagnostic validity confirmed by means of clinical trials. The primary aim of a screening program is the early detection of visual diseases (Bertuzzi et al., 2006). Between 20% and 50% of older people in the UK have undetected reduced vision and in most cases is correctable (Jessa, 2007).
Elderly patients do not receive a systematic eye examination unless a problem arises with their glasses or suspicion vision loss (Carcenac et al, 2009). This study aimed to determine and evaluate the diagnostic accuracy of visual screening tests for detecting vision loss in elderly.
I C N A A M 2 0 1 1
Furthermore, it pretends to define the ability to find the subjects affected with vision loss as positive and the subjects not affected with the same disease as negative. The ideal vision screening method should have high sensitivity and specificity for early detection of risk factors. It should be also low cost and easy to implement in all geographic and socioeconomic regions (Collins, 2006).
Sensitivity is the ability of an examination to identify the presence of a given disease and specificity is the ability of the examination to identify the absence of a given disease (Sardanelli, 2009). It was not an aim of this study to detect abnormalities that affect visual acuity. The aim of this study was to find out what´s the best test for the identification of any vision loss.
I C N A A M 2 0 1 1
2. METHODS
The research protocol followed the Tenets of the Declaration of Helsinki. Ethics approval for this study was obtained from the local ethics committee. Informed consent was obtained from the elderly after the nature of the study was explained. Elderly, who were institutionalized, were invited to undergo an orthoptic examination between April to June of 2010.
This study is defined as study of diagnostic performance (Sardanelli, 2009). We use visual acuity as a reference standard or gold standard. Visual acuity was assessed using the Lea chart letters and symbols at a distance of 3 meters. The chart is graded in logarithmic steps and each of its 15 lines contains five symbols (except for the first, which has only four).
I C N A A M 2 0 1 1
In each line, the distance between the symbols is equal to their width, whereas the distance between one line and the next is equal to the height of the symbols in the lower row (Bertuzzi et al., 2006). The symbols were presented from the top row downwards, and the correct answers were pointed out. Visual acuity was assessed in monocular vision with spectacles. Occlusion was performed by patching the non-tested eye. All visual acuity examinations started with the right eye.
A convenience sample was used to recruit participants. The non-collaborate elderly were classified as ‘non-compliant’ and were excluded from the study.
I C N A A M 2 0 1 1
After performing the Lea chart test, all the elderly underwent an examination with following tests: near convergence point, near accommodation point, stereopsis, contrast sensibility and amsler grid.
After initial descriptive analysis, the diagnostic accuracy of 5 visual tests was evaluated by means of the ROC method (receiver operating characteristics curves), sensitivity, specificity, positive and negative likelihood ratios (LR+/LR-). In the ROC method the area under the curve is a measure of test accuracy.
I C N A A M 2 0 1 1
3. RESULTS
A sample of 44 elderly agreed to participate in this study. The mean age of the participants was 76.7±9.32 years (Mean±SD). Most participants were female (72.7%). The visual acuity assessment took about 6 minutes per eye in compliant elderly. One elderly could not be tested because of lack of compliance. The results of the examinations for the best-corrected visual acuity were normal in 13 of 44 examinations (normal score between 0 and 0.1 in logMar scale; abnormal score between 0.2 and 0.8).
I C N A A M 2 0 1 1
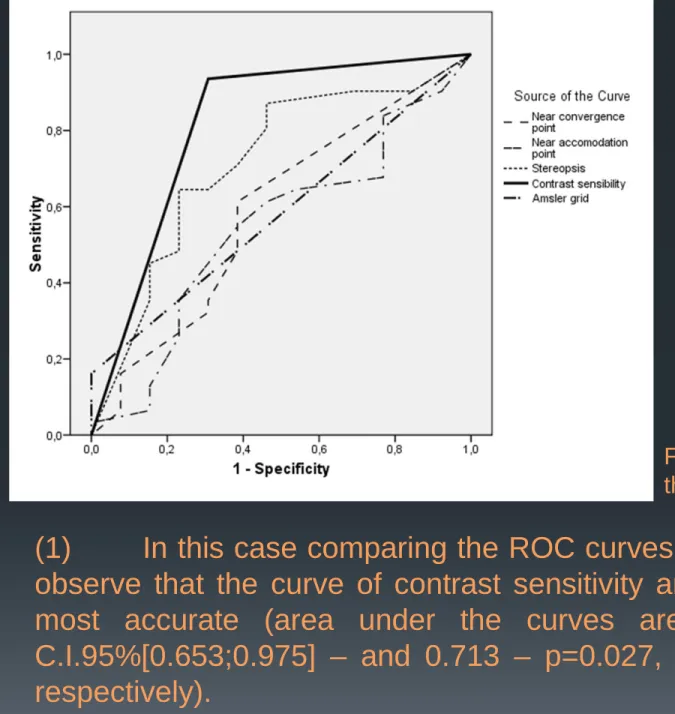
The diagnostic validity of the 5 tests was assessed by means of the ROC curve, sensitivity, specificity, positive and negative likelihood ratios (LR+/LR-). The area under the curve was compared for each vision test. Using this curve is possible to decide the best visual screening test to classify the elderly with or without disease (vision loss). An ROC curve plots the sensitivity of a test versus its false-positive rate for various points and it is applied when the tests results are interpreted subjectively. The ROC curves (figure 1) demonstrate several issues: I C N A A M 2 0 1 1
(1) In this case comparing the ROC curves of the 5 tests we can observe that the curve of contrast sensitivity and stereopsis are the most accurate (area under the curves are 0.814 – p=0.001,
The closer the curve follows the left-hand border and then the top border of the ROC space the more accurate the test.
FIGURE 1. ROC curves for the 5 tests. I C N A A M 2 0 1 1
(2) The other three curves corresponding to the other three tests come closer to the 45-degree diagonal of the ROC space, and are less accurate (areas under the curves are closer to 0.5 and p>0.05);
The positive and negative LRs according to Bertuzzi et al. (2006) can be defined in terms of sensitivity and specificity, where
and .
The LR+ is related to how much to increase the probability of
disease if the test is positive, while the LR- is related to how much
to decrease it if the test is negative.
The Confidence Interval for Sensitivity and Specificity was performed by Wilson “score” method, without continuity correction, given by: y specificit y sensitivit LR − = + 1 specificity y sensitivit LR− = 1− ( ) . 4 ˆ 1 ˆ 2 ˆ 2 2 2 2 1 2 1 2 2 1 z n z n p p z n z p α α α − − − + − ± + I C N A A M 2 0 1 1
The Wilson interval is an improvement (the actual coverage probability is closer to the nominal value) over the normal approximation interval. This interval has good properties even for a small number of trials and/or an extreme probability.
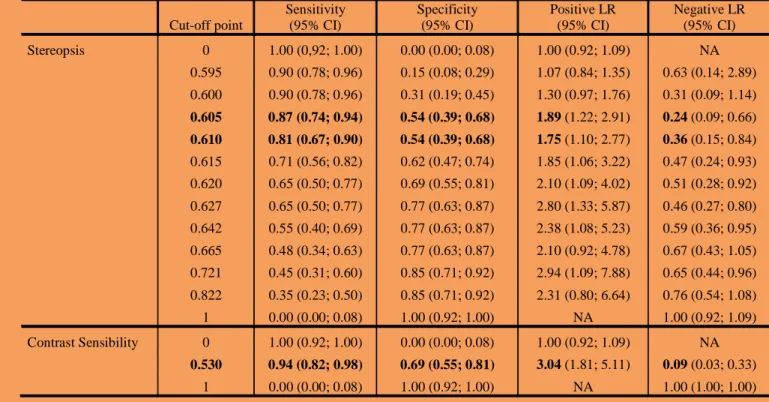
In the present study, the scores with the best diagnostic validity are presented in table 1.
TABLE 1. Diagnostic validity (sensitivity, specificity, LR+ and LR-) at each cut-off point.. Cut-off point Sensitivity (95% CI) Specificity (95% CI) Positive LR (95% CI) Negative LR (95% CI) Stereopsis 0 1.00 (0,92; 1.00) 0.00 (0.00; 0.08) 1.00 (0.92; 1.09) NA 0.595 0.90 (0.78; 0.96) 0.15 (0.08; 0.29) 1.07 (0.84; 1.35) 0.63 (0.14; 2.89) 0.600 0.90 (0.78; 0.96) 0.31 (0.19; 0.45) 1.30 (0.97; 1.76) 0.31 (0.09; 1.14) 0.605 0.87 (0.74; 0.94) 0.54 (0.39; 0.68) 1.89 (1.22; 2.91) 0.24 (0.09; 0.66) 0.610 0.81 (0.67; 0.90) 0.54 (0.39; 0.68) 1.75 (1.10; 2.77) 0.36 (0.15; 0.84) 0.615 0.71 (0.56; 0.82) 0.62 (0.47; 0.74) 1.85 (1.06; 3.22) 0.47 (0.24; 0.93) 0.620 0.65 (0.50; 0.77) 0.69 (0.55; 0.81) 2.10 (1.09; 4.02) 0.51 (0.28; 0.92) 0.627 0.65 (0.50; 0.77) 0.77 (0.63; 0.87) 2.80 (1.33; 5.87) 0.46 (0.27; 0.80) 0.642 0.55 (0.40; 0.69) 0.77 (0.63; 0.87) 2.38 (1.08; 5.23) 0.59 (0.36; 0.95) 0.665 0.48 (0.34; 0.63) 0.77 (0.63; 0.87) 2.10 (0.92; 4.78) 0.67 (0.43; 1.05) 0.721 0.45 (0.31; 0.60) 0.85 (0.71; 0.92) 2.94 (1.09; 7.88) 0.65 (0.44; 0.96) 0.822 0.35 (0.23; 0.50) 0.85 (0.71; 0.92) 2.31 (0.80; 6.64) 0.76 (0.54; 1.08) 1 0.00 (0.00; 0.08) 1.00 (0.92; 1.00) NA 1.00 (0.92; 1.09) Contrast Sensibility 0 1.00 (0.92; 1.00) 0.00 (0.00; 0.08) 1.00 (0.92; 1.09) NA 0.530 0.94 (0.82; 0.98) 0.69 (0.55; 0.81) 3.04 (1.81; 5.11) 0.09 (0.03; 0.33) I C N A A M 2 0 1 1
For the stereopsis test the scores were 0.605 (sensitivity 0.87, specificity 0.54; LR+ 1.89, LR-0.24) and 0.610 (sensitivity 0.81,
specificity 0.54; LR+ 1.75, LR-0.36). The scores with the best
diagnostic validity for the contrast sensibility test was 0.530 (sensitivity 0.94, specificity 0.69; LR+ 3.04, LR-0.09).
4. DISCUSSION
The sensitivity and specificity, respectively, were 87% and 54% for the stereopsis test and 94% e 69% for the contrast sensibility test. A low specificity could lead to an excessive number or
false-positive referrals, whilst low sensitivity would result in elderly at risk of being visual impaired not being detected.
Ivers et al (2001) found that best-corrected visual acuity or contrast sensitivity had the highest area under the ROC curve for most eye diseases examined. They also found poor sensitivity and
specificity for both tests. However the “gold standard” of a full eye examination performed by an ophthalmologist it takes time and is not cost-effective. I C N A A M 2 0 1 1
Visual acuity was used was golden standard because the advantages of logMar acuity data over the Snellen fraction are well known. Assessing vision loss in elderly using the contrast sensitivity is rapid, simple and relatively cheap, making it a potentially suitable choice for large-scale screenings.
I C N A A M 2 0 1 1
REFERENCES
* Agresti A, Coull B A (1998). Approximate is better than 'exact' for interval estimation of binomial proportions. The American Statistician. 52: 119–126.
* Bertuzzi F, Orsoni JG, Porta M, Paliaga GP, Miglior S (2006). Sensitivity and specificity of a visual acuity screening protocol performed with the Lea Symbols
15-line folding distance chart in preschool children. Acta Ophthalmologica
Scandinavica. 84: 807-811.
* Carcenac G, Herard M, Kergoat MJ, Lajeneusse Y., Champoux N, Barsauskas
A, Kergoat H (2009). Assessment of visual function in institutionalized elderly
patients. American Medical Directors Association. 10: 1 45-47.
* Collins, ML (2006). Screening methods for detection of preclinical visual loss in children: implementing programs – the political will. American Orthoptic Journal. 56: 50-53.
* Ivers R Q, Macaskill P, Cumming R G, Mitchell P (2001). Sensitivity and Specificity of Tests to Detect Eye Disease in an Older Population. American Academy of Ophthalmology. 108 (5): 968-975.
* Jessa Z, Evans B, Thomson D, Rowlands G (2007). Vision screening of older people. Ophthal. Physiol. Opt. 27: 527-546.
* Newcombe R. G. (1998). Two-sided Confidence Intervals for the Single Proportion.Comparison of seven methods. Statistics In Medicine. 17: 857-872.
* Sardanelli F, Di Leo G (2009). Biostatistics for radiologists: planning, performing, and writing a radiological study. New York: Springer. ISBN 978-88-470-1132-8.
* Wilson E. B. (1927). Probable inference, the law of succession, and statistical inference. Journal of the American Statistical Association. 22: 209–212.
I C N A A M 2 0 1 1
I C N A A M 2 0 1 1