110
Universidade Católica Portuguesa
Faculdade de Ciência Económicas e Empresariais
CASE STUDY ON EQUITY VALUATION
“Equity Valuation of Mota-Engil S.G.P.S., S.A.”
by
Pedro David Gonçalves Cardoso
Dissertation submitted in partial fulfillment of requirements for the degree of MSc in Business
Administration, at the Universidade Católica Portuguesa, 5th of September 2011
ii
ABSTRACT
The objective of this Dissertation is to obtain a price per share of the Portuguese construction company, Mota-Engil, SGPS, S.A. Equity valuation is important for a variety of reasons. One of the most important reasons is that equity valuation of a company provides an analysis that potential buyers or sellers of stocks of that respective company take into consideration.
The recent trend in the last years of mergers and acquisitions of companies also reinforces the importance of equity valuation in the current business environment. Inevitably, equity valuation of a company is subjective by nature, depending on the assumptions considered to perform the valuation. Despite that fact, this Dissertation’s objective is to perform an equity valuation of Mota-Engil as accurate as possible.
A good valuation has to be technically correct, based on solid assumptions that translate the reality of the company and it has to take into consideration the different activities of the firm being evaluated, as well as the future operational targets of the company. In the particular case of Mota-Engil, it is essential to differentiate the different activities of the company and evaluating each one of them individually, otherwise the equity value of the company would be incorrect. Following this line of reasoning, the evaluation of Mota-Engil conducted in this Dissertation consisted in a sum of all the different activities of the company separately, using the Discounted Cash Flow approach.
The equity value of Mota-Engil estimated in this Dissertation tryies to reflect the reality of the company, despite considering that many variables might influence the correcteness of this valuation process. In the end, a comparison between this Dissertation and Millenium Investment Banking equity valuation of Mota-Engil was made.
iii
Table of Contents
Introduction ... 1
1.Literature Review ... 2
1.1 Valuation Approaches ... 2
1.2 Contingent Claim Valuation ... 3
1.3 Asset Based Valuation ... 4
1.4 Discounted Cash Flow Models ... 4
1.4.1 Free Cash Flow to the Firm Model ... 4
1.4.1.1 Variables of the FCFF ... 4
1.4.1.2 Value of the Firm ... 5
1.4.1.3 Terminal Value ... 6
1.4.2 Weighted Average Cost of Capital (WACC) ... 6
1.4.2.1 Cost of Equity ... 7
1.4.2.2 Risk-free rate ... 7
1.4.2.3 Equity Beta ... 8
1.4.2.4 Market Risk Premium ... 8
1.4.2.5 Cost of Debt ... 9
1.4.2.6 Weights of Debt and Equity ... 10
1.4.2.7 Cyclical Companies Valuation ... 10
1.4.3 Dividend Discount Model ... 10
1.4.4 Free Cash Flow to Equity Model ... 11
1.4.5 Adjusted Present Value of Model ... 11
1.4.5.1 FCFF vs APV ... 12
1.4.6 Excess Return Models ... 13
1.5 Relative Valuation ... 13
1.5.1 Price Earnings Ratio ... 14
1.5.2 EV/EBITDA. ... 15
1.5.3 DCF vs Relative Valuation ... 15
1.6 Cross-Border Valuation... 16
1.7 Valuation in Emerging Markets ... 16
2. Company Overview ... 17
2.1 Introduction ... 17
2.2 Mota-Engil:Engineering and Construction ... 18
iv
2.4 Strategic Guidelines and Objectives of Mota-Engil for the Future ... 19
2.5 Recent Performance of Mota-Engil ... 20
3. Engineering and Construction Overview ... 23
3.1 Mota-Engil: Engineering and Construction in Portugal ... 23
3.2 Mota-Engil: Engineering and Construction in Central Europe (Poland) ... 24
3.3 Mota-Engil: Engineering and Construction in Africa ... 25
3.4 Mota-Engil: Engineering and Construction in Latin America ... 26
4. Environment and Services Overview ... 27
4.1 Waste Management ... 27
4.2 Water Distribution ... 28
4.3 Overview of the Portuguese water and waste sectors ... 29
4.4 Logistics ... 31
4.4.1 Portuguese Logistics segment ... 32
4.5 Multi-services ... 32
5. Methodology used for the Equity Valuation of Mota-Engil ... 33
6. Variables used in the Dissertation ... 33
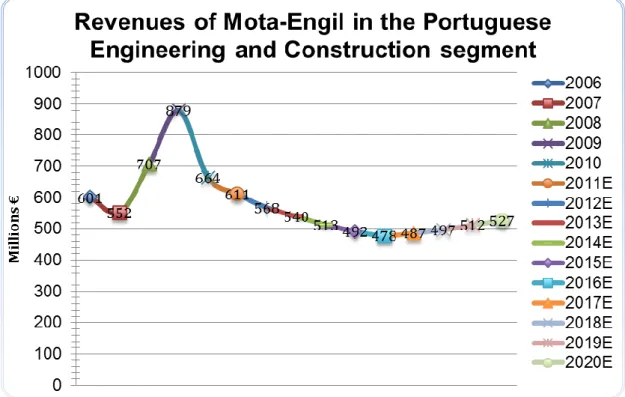
6.1 Revenues of Engineering and Construction ... 33
6.1.1 Revenues of Mota-Engil in the Portuguese Engineering and
Construction sector ... 34
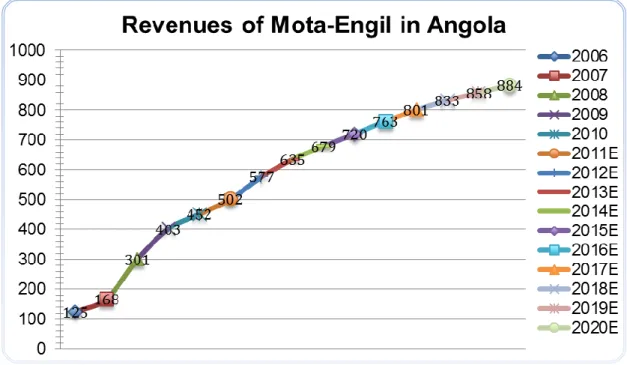
6.1.2 Revenues of Mota-Engil in the Angolan Engineering and Construction
Sector... 35
6.1.3 Revenues of Mota-Engil in other African countries ... 36
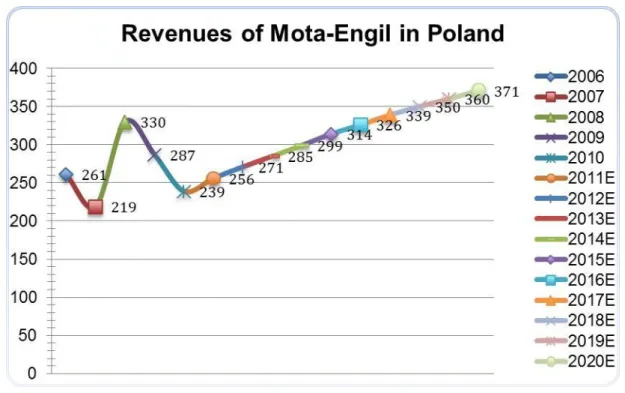
6.1.4 Revenues of Mota-Engil in Central Europe (Engineering and
Construction) ... 37
6.1.5 Revenues of Mota-Engil in Latin America (Engineering and
Construction) ... 38
6.2 Revenues of the Environment and Services segment ... 40
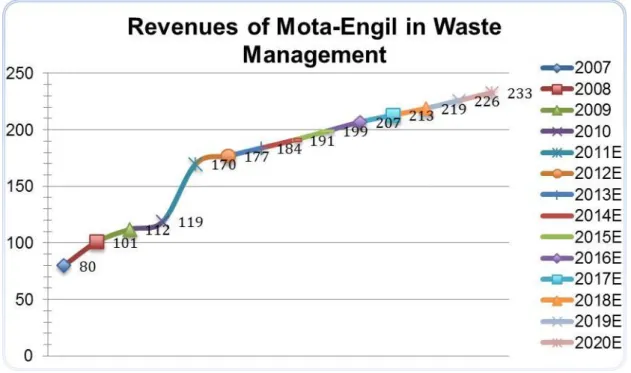
6.2.1 Revenues of Waste Management ... 40
6.2.2 Water Distribution ... 41
6.2.3 Logistics ... 42
6.2.4.Multi-services ... 43
6.3 Operating Expenses and other Operating Income ... 45
6.4 Gross Tangible and Intangible Assets of Mota-Engil ... 46
6.5 Depreciation ... 46
v
6.7 Capital Expenditures ... 47
6.8 Non-cash Working Capital ... 48
6.9 Cost of Equity ... 48
6.9.1 Risk Free Rate ... 48
6.9.2 Beta of Mota-Engil ... 49
6.9.3 Market Risk Premium ... 49
6.10 Cost of Debt ... 50
6.11 Weights of Debt and Equity ... 50
6.12 Corporate Tax Rate ... 51
6.13 Terminal Value ... 52
7.Enterprise Values of EC and ES ... 52
8. Dividends to shareholders ... 53
9. Debt and Interest expenses ... 53
10. Partnership in Angola with Sonangol ... 53
11. Minority Interests of Environment and Services ... 54
12. Equity Value of Mota-Engil ... 55
13. Relative Valuation ... 55
14. Investment Banking Comparison ... 57
14.1 Valuation and Estimates of Millenium Investment Banking ... 57
14.2 Key performance indicators comparison ... 57
15. Sensitivity Analysis ... 58
16. Conclusion ... 59
Appendix 1: International presence of Mota-Engil ... 60
Appendix 2- Forecasts of Mota-Engil ... 61
Appendix 3- Macroeconomic Framework ... 62
Appendix 4- Overview of the Portuguese Construction Sector ... 65
Appendix 5- Overview of the Polish Construction Sector ... 68
Appendix 6- SUMA activity (Portugal and abroad) ... 70
Appendix 7- Indaqua... 72
Appendix 8- Operators and Population covered in the drinking water supply services ... 74
Appendix 9- Operators and population covered in the Portuguese waste services 2009 ... 76
Appendix 10- Evolution of the Portuguese population covered by water and waste services 79
Appendix 11- Ownership of share capital of multimunicipal and municipal concessions of
water services and of municipal waste management operators ... 81
vi
Appendix 12- Turnover of the Portuguese Water and Waste sectors ... 83
Appendix 13- Operating expenses and other operating income... 85
Appendix 14- Historical values of Gross fixed assets, Depreciation and Net Fixed Assets;
Historical values of CAPEX and Historical values of NWC ... 89
Appendix 15- Debt and Financial costs of Mota-Engil ... 93
Appendix 16- Fundamentals used for the Relative Valuation ... 96
Appendix 17- Transport Concessions ... 98
Appendix 18- Comparison of each segment with MIB ... 104
Balance Sheet ... 113
Income Statement ... 115
Cash-Flow Statement ... 116
vii
ACKNOWLEDGEMENTS
First of all, I would like to thank my family, especially my parents for the support and comprehension during this decisive stage of my academic life. I would also like to thank my friends Pedro and Raul for the help provided during these past few months. Moreover, a special thank to Professor José Tudela Martins, especially for its availability and patience, to Dr. João Vermelho of Mota-Engil for all the information provided and to Mrs.Nazaré and Isabel for the technical support they provided. Last but not the least, I would like to thank Jorge, Rita, Inês, Marta and Sofia for always having confortable words during this tough process and most of all, I want to thank Joana for her friendship and solidarity in the past few months.
1
112
Introduction
The objective of this Dissertation is to provide a price per share for the leading construction company of Portugal, Mota-Engil, S.G.P.S., S.A. It is the price per share that reflects the equity value of a company and due to the recent focus that Equity Valuation has gained in the past years; this Dissertation also makes a comparison between its evaluation and an evaluation of an Investment Banking, Millenium Investment Banking.
Unfortunately, Portuguese companies are not facing appropriate economic conditions, but there are exceptions to that reality. Mota-Engil is one of those examples. It is a company with a very strong presence in all the markets where it operates and it was one of the first Portuguese companies to invest abroad with successful results. It is a fact that the company has been able to surpass its difficulties and most of all; it is interesting to see a company with such a variety of business segments as Mota-Engil. However, in the perspective of the analyst, it is true that evaluating Mota-Engil might be extremely tough due to the portfolio of activities of the company.
Mota-Engil has two main segments: Engineering and Construction and Environment and Services. The partnership with Banco Espírito Santo in Ascendi is also an important investment of the company. This Dissertation focused more on these three segments of Mota-Engil.
The structure of the Dissertation is divided in four major fields. The first is the Literature Review, which reflects the state of the art of Equity Valuation processes. Then an overview of the company and of its performance is conducted. The third division of this Dissertation is the market overview, both in Engineering and Environment, with a focus on the markets overviews, where Mota-Engil has businesses. Finally, the fourth part is the valuation process (mainly with the help of the Discounted Cash Flow models) and its results, not forgetting the comparison with one of the best Investment Banks of Portugal, Millenium Investment Banking.
2
1. Literature Review
1.1 Valuation Approaches
There is more than one method to value a company and it is important to use more than one method because that enables the comparison of values of each approach, but most important than that, firms use more than one method because different assets of a firm sometimes demand the use of more than one method of valuation, more appropriate for each situation. “According to Luehrman (1997), managers need to value operations, opportunities and ownership claims of the firm” and despite the FCFF/WACC approach being the most used model, Luehrman states that the “APV, Option pricing and FCFE are the best models to value each one of the three variables, respectively”. Damodaran (2006) presents four approaches to estimate the value of a company: Discounted Cash Flow, Asset Based Valuation, Relative Valuation and Contingent Claim Models. Despite the existence of a variety of models to estimate the value of a company, Fernandez (2007) demonstrated by analyzing ten different methods of company valuation that the estimated values gave the exact same value for all the methods; the differences relied on the cash flows used in each method. Other factor that differs among the methods of valuation is the estimation of the tax shields; there are various approaches to calculate them (Fernandez, 2006).
Regarding the valuation of Mota-Engil, the two methods that are going to be used are: the Discounted Cash Flow Method and the Relative Valuation Method. The Discounted Cash Flow Model will be used because it is a mainstream model and fits well in the case of Mota-Engil and Relative Valuation will be used due to its simplicity, but also to complement the Discounted Cash Flow valuation. Despite that, this section will address some other methods of valuation.
Valuation Models referred in Literature Review Contingent Claim
Valuation
Asset-based Valuation Discounted cash flow models Relative Valuation
Black Scholes Binomial Model Liquidation Value Replacement Cost Book Value
Free Cash Flow to the Firm Dividend Discount Model Free Cash Flow to Equity Adjusted Present Value Economic Value Added
EV/EBITDA Price/Earnings (PER) EV/Sales Price to Book Value Price to Cash Flow Figure 1- Valuation Models referred in Literature Review
3
1.2 Contingent Claim Valuation
An option can be thought as a claim that can be exercised by its holder under certain circumstances and it can value assets. “Leslie and Michaels (1997) explain that a financial option can either be a right to buy or sell a given amount of a specific asset at a fixed price at or before the expiration of the option”. The purpose of the method is to apply financial options in the valuation of opportunities in real markets. An option can be exercised or not and it is a call option, if it gives the owner the right to buy and a put option, if it gives the owner the right to sell the underlying asset. There are differences among options. For instance, American options can be exercised at any time, but the European options can only be exercised at the maturity of the option.
“According to Leslie and Michaels (1997), there are six variables that cause the option value to fluctuate, in relation to the underlying asset”:
The stock price, which is the value of the underlying asset
The uncertainty regarding the future stock price
Time to expiration of the option
The risk-free interest rate, which is the yield corresponding to a security with the same maturity of the option
Dividends paid on the underlying asset
The exercise price of the option
Increases in the first four variables given above raise the option value. Increases in the exercise price of the option and in the dividends paid on the underlying asset lower the value of the option.
The underlying thought behind this approach is that financial options can be used to better estimate future payoffs of specific investments of the firm that can or cannot be made, like investments in R/D. Many authors defend the position that the DCF method is incomplete in the evaluation of investment opportunities and “Woolley and Canizzo (2005) recommend the use of the real option valuation to correctly determine the value of future possible investments”, however, they recognize some difficulties in implementing the model among executives, especially due to the fact that executives are not used to it. “Leslie and Michaels (1997) state that real options valuation is a useful method, due to the fact of allowing some flexibility and recognizing the value of learning in the valuation of the company”, contrasting with the static model of the Discounted Cash Flow Valuation. They also state that this model “seeks profits from the uncertainty and from the technological progresses”, in contrast to the other approaches, that are generally more conservative in relation to future investments. There are two models of option pricing: the Black-Scholes model and the Binomial model.
In the specific case of Mota-Engil, the method will not be used in this paper because it is not a relatively easy model to apply for this specific valuation, since it will require difficult mathematical computations.
4
1.3 Asset Based Valuation
This method is not appropriate for the case of Mota-Engil because it “relies too much on accounting figures and does not focus on possible growth investments” (Damodaran, 2006). With this approach, the value of a business can be obtained through the analysis of the value that the market is willing to pay for the assets of the firm if they were liquidated today, which is called the Liquidation Value Method. Other option available in Asset Based Valuation to determine the value of a company is the Replacement Cost Method, which estimates the replacement value of the assets that the firm possesses at the moment. The Book Value Based Valuation that estimates the value of a business by examining the book values of the assets and of the equity on a balance sheet (Damodaran, 2006) is also an approach to estimate the value of a company within the Asset Based Valuation method. The Asset Based Valuation does not always correspond to the true value of a company and relying on accounting figures can be risky to properly evaluate a firm, especially in cases where the firms have good prospects of developing projects with good growth perspectives for the future.
1.4 Discounted Cash Flow Models
The mechanism behind the discounted cash flow models to determine the present value of a company is relatively simple. The process consists in determining the expected future cash flows of a firm and discounting them at a specific discount rate that reflects the level of risk of those cash flows and of the firm. Despite being somehow intuitive, the discounted cash flow models require a few sets of assumptions to determine the present value of a company, especially regarding the expectations of future possible growth rates. There are three main discounted cash flow models that are going to be analyzed in this paper:
Free Cash Flow to the Firm Model Free Cash Flow to Equity Model Adjusted Present Value Model
1.4.1 Free Cash Flow to the Firm Model
The Free Cash Flow to the Firm can be defined as “ after-tax earnings before deductible financing charges such as interest expense, lease rentals, and so forth plus all deductible non-cash charges (depreciation, deductible amortization, deferred taxes, etc.) and less new cash outlays for required capital expenditures and investment in net working capital” (Froot, 1997).
FCFF= EBIT (1-Tax rate) + Depreciation – Capital expenditure- Working Capital
1.4.1.1 Variables of the FCFF
5
In order to perform the valuation of a company, this variable has to be estimated for future time periods. This process involves forecasting revenues and operating expenditures based on future perspectives of the economies and of the industries or markets, where the firm operates.Tax Rate
The tax rate used in the FCFF formula can be a marginal tax rate or an effective tax rate, being the marginal rate the most commonly used tax rate.
Depreciation
“According to Koller et. al (2005), there are three ways to estimate depreciations”. The first option is to estimate depreciation based on the reports of the company and using their method of depreciating assets. The second option is to estimate it as a percentage of revenues and the last one is to calculate depreciation as a percentage of tangible assets.
Capital Expenditures
Capital expenditures can be forecasted with the help of the historical accounting values in the balance sheet of a company. The other method used to estimate capital expenditures is to rely on the average reinvestment rate of a peer group of similar companies and use that rate to calculate the capital expenditures of the company that is being evaluated.
Working Capital
It is given by the difference between current assets and current liabilities. If it is bigger than one, it means that the company is able to meet its short-term liabilities. As any variable in this formula, it has to be forecasted in the future and those predictions would be inevitably better if the current situation and future strategies of the company are transparent and reliable. The working capital definition will not be used in this dissertation. It will be used the definition of Non-cash working capital, which is basically the working capital, but “netting out all the interest bearing debt (long-term and short-term) debt, as well as cash and investments marketable securities from current assets” (Damodaran, 2002).
1.4.1.2 Value of the Firm
“The FCFF approach of estimating the value of a company is given by the discount of the expected future free cash flows of the firm by the weighted average cost of capital (Luehrman 1997)”. This method requires special attention in respect to the future growth rate used to estimate the future cash flows of the firm and in perpetuity; the growth rate of the future cash flows should not be bigger than the growth rate of the economy. The growth rate used shall depend on the characteristics of the firm, namely, “the company’s size, the historical growth rates or the competitive position in its industry” (Damodaran, 2005). Other important factor in this model is the number of different stages of growth
6
that are used in the valuation of the company, not forgetting that in perpetuity the reinvestment needs of the company have to be in accordance with the assumption of growth stability of the firm.Non-equity claims are not included in the equity value of a company. Debt like bonds, short-term and long-term-debt, but also pensions of workers, operating leases or minority interests are examples of non equity claims and consequently, should be subtracted from the enterprise value, when performing the equity valuation of the company with this approach. The same happens with non-operating assets such as marketable securities, excess cash or subsidies to the company. Operating assets must also be subtracted.
After subtracting non-equity claims and non-operating assets from the enterprise value estimated with the FCFF approach, the equity valuation of the company is obtained.
1.4.1.3 Terminal Value
The terminal value component usually represents the majority of a company’s value and in the estimation of the terminal value; the most sensible factor to take into consideration is the choice of the correct growth rate to use in perpetuity to calculate the terminal value. It is assumed that the “company in perpetuity will grow at a constant growth rate and that the capital expenditures of the firm should equal its depreciations in perpetuity (Kaplan and Ruback, 1995)”. Having an accurate growth rate can be problematic and as a rule, this “growth rate should not be bigger than the expected growth rate of the economy where the company operates (Damodaran, 2008)”. In order to have a terminal value of a company, predictions should be made regarding the future expected cash flows for a given time period, never exceeding 15 years (Ohlson and Xiao-Jun Zhang, 1999). The major drawback in the terminal value estimation is related to the impossibility of determining with complete certainty that technological changes will not influence the growth rates of the firm in the future.
1.4.2 Weighted Average Cost of Capital (WACC)
The cost of capital is an important variable in the Discounted Cash Flow approach. It varies depending on the free cash flows used in the valuation process. A company has two sources of financing. One source is to resort on debt; the other one is to use equity. The value of tax shields is generally included on the cost of capital because the cash flows do not incorporate those values and the “cost of capital must be computed with the market values of both sources of financing (Goedhart et al. 2005)”.
The objective of every firm is to find the optimal mix between both sources of financing, so that a company could maximize its value. The WACC formula estimates the cost of capital that a firm has, when it uses both equity and debt. In order to estimate the WACC of a company, three variables have to be computed. The three variables are: the cost of equity, the after-tax cost of debt and the weights of debt and equity used in the funding process (Damodaran, 2002). Miles and Ezzel (1980) criticize the common WACC formula because it assumes a stable capital structure, which is something that does not
7
always hold. “Luehrman (1997) also states that it is unrealistic that both the cost of equity and debt are stable”. Furthermore, he points out that the “estimation of the interest tax shields relies on weak assumptions and consequently, companies with more complex tax positions will be miss valued with the WACC approach”. “Damodaran (2005) counter argues by saying that the WACC formula allows the change of debt levels over time and in those circumstances, continues to be an appropriate discount rate for the cash flows of the firm”.1.4.2.1 Cost of Equity
Cost of Equity= Risk-free rate + Beta Market Premium
The Capital Asset Pricing Model (CAPM) is the most commonly used approach to determine the cost of equity of a firm, which is no more than the “appropriate rate of return of a given asset, assuming that the securities market is efficient and that the investors are risk-averse, always expecting a premium for the risk they take (Mullins, 1982)”. The theory behind this model is that the only factor that can affect equity investments in the long term is the risk inherent to the market. This systematic risk is measured by a betathat can vary, depending on the risk of a particular asset in comparison with a specific market or portfolio of stocks.
According to the formula of the CAPM, a stock with a higher beta will have a higher expected return than the market. This formula is not one hundred per cent accurate and sometimes the returns are lower or higher than expected.
“One of the main problems of the CAPM is the negative correlation between market capitalization and systematic risk (Roll 1981)”. Moreover, the assumptions behind the CAPM like perfect information in the markets, lack of transaction costs and the inexistence of a limit to both borrowing and lending are too unrealistic. Despite those limitations, Ang & Chen (2005) proved that CAPM was more than able to correctly estimate returns and even for a relatively long period of time. Other problem of the CAPM model is that “the model is not appropriate for companies with higher growth rates than the cost of equity and with irregular dividend payments (Mullins, 1982)”. “Fama and French (1996) consider that the problem of the CAPM model is the lack of reliability considering the composition of the market portfolio”. Despite these problems, the CAPM still is the most used model to predict stock returns and it is effective in “estimating opportunity costs of risky capital by the firms, identifying attractive stocks, evaluating performance (Zou, 2006)”.
1.4.2.2 Risk-free rate
“According to Fernandez (2003), the appropriate risk-free rate for valuation purposes has to be the rate of the long-term default-free government bonds and the maturity of those bonds should be the same as the period of time used in the cash flows forecasts”. Furthermore, it is important that “the risk free rate is expressed in the same currency as the market risk premium, in order to avoid inflation problems (Damodaran 2008)”.
8
1.4.2.3 Equity Beta
The beta of a security is a parameter that measures the level of systematic risk, which is the “risk that cannot be eliminated by having a diversified portfolio (Rosenberg, 1995)”. It is one of the variables included in the CAPM and “according to Rosenberg (1995) is determined by the uncertainty of future economic events and the response of the security to those events”.
There are three alternatives to estimate the beta (Damodaran, 1999): the historical market beta, the fundamental beta and the accounting beta. Damodaran (1999) considers that there are three factors that might affect the estimation of the historical beta, namely, “the period of time, the return interval and the market index used”. According to the author, “the beta of a firm depends on three factors: the type of business where a firm operates, the level of operating leverage of the firm and finally, it depends on the level of financial leverage of the firm”.
The common practice to estimate a beta is to rely on the regression of a stock return against the return of a market portfolio, or the historical market approach to estimate the beta, but this result is dependent of the market index and of its composition, which might be dominated by some stocks. The second flaw of using the regression to estimate the beta concerns the fact of the beta being affected by the standard error of the regression and the final problem is the use of historical data to compute the regression and consequently, contributing to a biased beta, that does not take into consideration possible modifications of capital structure of differences in growth rates.
An alternative approach is to use the average beta of an industry as an expectation of the company’s beta. Kaplan and Peterson, (1998) proved that this method was reliable by taking into consideration the “full information of the industry and all the relevant players that operated on it”. However, this approach has the difficulty of accurately defining a peer group of similar companies. Even companies that are similar present some differences among them that might pose a problem in the estimation of a proper beta. “Kaplan and Peterson, (1998) add the fact that some important firms in the industries, where that company is present, might be left out”.
The process of finding a perfect beta is almost impossible to be conducted, but there are mechanisms that help estimating it in a more correct way. For instance, “the market index used should be one that includes as many securities as possible, should reflect the level of diversity of the marginal investor and finally, it is recommendable that the index is market weighted (Damodaran 1999)”. The period of time should be “adjusted according to the level of stability of the company and monthly return intervals should be used (Damodaran, 1999)”.
1.4.2.4 Market Risk Premium
The market risk premium definition represents the extra return that the investors require to invest in riskier assets. “According to Damodaran (1999), in order to estimate the market risk premium, three
9
methods can be used: surveys to investors to obtain their expectations, analysis of historical values and analysis of the current market”.Fernandez (2009) defines 4 different concepts of market risk premium, which might be responsible for the variety of values that analysts estimate for the market risk premium, since analysts do not differentiate each type of market risk premium. The four concepts of market risk premium are:
Historical equity premium: historical differential return of the stock market over treasuries
Expected equity premium: expected differential return of the stock market over treasuries
Required equity premium: the incremental return of a diversified portfolio over the risk-free rate required by an investor.
Implied equity premium: the required equity premium that arises from assuming that the market price is correct.
The first concept is the easiest one to compute because it is observable, but also because it is equal for all investors.
There is a sensitive point regarding the market risk premium, which is the question of including or not a parameter regarding country risk. Damodaran (2008) does not recommend including a parameter of country risk because “the risk between countries is uncorrelated and because the investors that own the operations are also diversified in their portfolios”. James and Koller (2000) defend the opposite and state that the “country risk premium should be included in the estimates of the cash flows”. They argue that the “risk of emerging markets can be diversified if there is a global investment portfolio, that the risks are specific to each company and industry and the third reason is related to the error of adjusting the equity risk premium because sometimes the sovereign debt is riskier”. The country risk premium can be given by the rating agencies through the spreads associated with those ratings, but also by the economical and political authorities of the countries, namely, through the country risk scores.
1.4.2.5 Cost of Debt
The cost of debt of a firm depends on the “riskless rate, the tax benefits of using debt and of the default risk of the firm, being the cost of debt generally measured by the company’s bond ratings, which is a process that involves three steps” (Damodaran, 2002). The first one is to estimate the firm’s debt and interest expenses. The second step is to compute financial ratios at each level of debt, in order to estimate the rating of the company and finally, after the default spread based on the rating of the company being added to the risk-free rate to get the pre-tax cost of debt, applying the marginal tax rate. After applying the marginal tax rate, the cost of debt is given (Damodaran, 2002).
10
1.4.2.6 Weights of Debt and Equity
The weights of debt and equity used by a company have to be correctly estimated, so that the cost of capital is minimized and to reach that objective, different values of debt and equity have to be weighted to calculate the minimum cost of capital (Damodaran, 2002). Relying on book values of Debt and Equity is not a recommended approach to estimate the minimum cost of capital of a firm (Fernández, 2003). It is preferable to use the market values of both equity and debt.
1.4.2.7 Cyclical Companies Valuation
When companies have a volatile performance, being highly affected by different cycles in their business, it means that the methods of valuing those companies become much more susceptible of being incorrect. It is recommendable “to look into these companies in the long-term and construct different scenarios, avoiding possible surprises that might affect the correct value of the company” (Goedhart et al., 2005).
Despite being relatively simple and commonly used, the FCFF is not exempt from defects. One of the arguments to criticize the FCFF technique is related to the influence that a volatile capital structure of a company might have on the reliability of the method. The FCFF is a good method when the capital structure is stable (Luehrman, 1997) but if it is not, new values of the WACC have to be estimated and that would be difficult to perform an accurate and correct valuation of a company.
1.4.3 Dividend Discount Model
The dividend discount model estimates the value of a company by the discount of expected future dividends at the cost of equity. In the Dividend Discount Model, assumptions are needed in relation to the growth rates of earnings and payout ratios. “The forecasted growth rate of dividends cannot be greater than the expected growth of the economy in the future and the growth rates of dividends and other measures of performance of the firm are expected to be equal” (Damodaran, 2006).
“The model is appropriate for firms that have stable growth rates over time” (Damodaran, 2006), which is not the case of Mota-Engil, so this variant of the Discounted Cash flow model will be discarded in this specific case. Many authors appreciate the model and “Foerster and Saap (2005) demonstrated in their study that the Dividend Discount Model is particularly effective to value the equity of a mature firm, with stable growth rates and dividend payments”. However, “these two assumptions limit the applicability of this model” (Mullins, 1982). This model has been constantly developed to overcome its limitations, like the existence of a variant of the initial model that now takes into account the possibility of different stages of growth. The link between dividends and stock prices is relatively weak in the opinions of some authors. For instance, “Shiller (1981) has shown that stock price was much more volatile than dividends”. The model does not take into account operational variables, which is a disadvantage relatively to the FCFF, but since the shareholders that have shares of the company might receive dividends or benefit from share buybacks, this model seems interesting in their optical. “The
11
major drawback of this model is when the level of leverage of a company is high and unstable” (Luerhman, 1997).1.4.4 Free Cash Flow to Equity Model
The FCFE is the sum of all the cash flows that equity holders can claim. It is a method of valuation that “focuses on what the value of the company is after paying debt obligations” (Damodaran, 2006).
FCFE = Net Income - Net CAPEX+ Working Capital + New Debt – Debt Repayment
The FCFE is an alternative of the DDM because it assumes that the companies do not pay everything they can afford to pay as dividends. Like the DDM, it is a “good method to evaluate ownership claims (Luerhman, 1997)” because managers need to know not only the value of the investments their companies are going to participate together with other parties, but also the interests their companies have in the investments. Moreover, it is capable like the DDM of “measuring how the cash flows and risk of equity holders might be influenced by differences in the ownership structure of the company (Luerhman, 1997)”.
This alternative of the Dividend Discount model fits very well in companies with high levels of debt, which is the case of Mota-Engil.
1.4.5 Adjusted Present Value Model (APV)
The APV model is an alternative solution to one major imperfection from the other Discounted Cash Flow models. That imperfection is the assumption that the capital structure of a firm is stable over the years. There is some controversy among different authors regarding capital structure issues. “According to (Fama and French, 2002), in the trade-off model, a company is capable of choosing its leverage target, but with the pecking-order model, the company is not able to do that”. However, their studies regarding those hypotheses were inconclusive. “Luerhman (1997) defends that this model is particularly effective in the valuation of the operations of a company, like a business, a product, or a market”.
The APV requires fewer assumptions than the FCFF and consequently, it is less vulnerable to errors. The APV is capable of estimating the value of an asset, but also to discover the origin of the value of that specific asset. It has the drawback of “requiring new predictions for the levels of debt of the company (Booth, 2007)”, which can be more problematic in comparison with the WACC method.
Value of the Firm=
There are three main components in the APV model. The first component corresponds to the present value of the firm financed only with equity. The second component is the present value of the tax benefits corresponding to a given level of debt that the company uses to finance itself; those benefits are the interest tax shields that arise due to deductions of interest payments. The third component is
12
the present value of expected bankruptcy costs that the firm has due to possessing that specific level of debt (Luerhman, 1997). In the end, the value of the company is given by the sum of these three parts. The first component of the APV is given by the discount of the expected free cash flows to the firm by the unlevered cost of equity. The second component demands some assumptions, like the possibility of variations in the tax rate and level of debt. “According to Cooper and Nyborg (2006) the appropriate discount rate of the interest tax benefits is the cost of debt. “Luerhman (1997) argues that to properly discount tax shields, a higher rate than the cost of debt should be used”. The third part of the APV is the most difficult to estimate, due to the ambiguity in the values of probability of bankruptcy, usually measured with the interest coverage ratio and of the present value of bankruptcy costs, being both difficult to measure and consequently, representing a disadvantage of this model in relation to the WACC model.1.4.5.1 FCFF VS APV
There has been a recent debate in the academic field regarding the comparison of these two models because they are relatively similar. Some authors state that the “two approaches under the same assumptions lead to the same value of the company like Jennergren (2008)”. Other authors like “Oded and Michel (2007) argue that there are differences between APV and FCFF”.
The APV is also more practical to value the company by the definition of a Sum-of-the-Parts valuation, which is better to value the company in each country where it operates. Moreover, in the APV each component of valuation is clearly specified, understating the criteria of value additivity. The critical point regarding the APV is the discount rate. For the equity part, the unlevered cost of equity is used, but for the tax shields, there is no consensus. Some analysts use the cost of debt and others use a higher rate to better reflect the risk involved. The terminal value of the tax shields is usually computed by using the same long-term growth rate of the unlevered part of the company. Comparing the two approaches, the “APV is better in situations where companies have an unstable capital structure, complicated tax positions and a complex strategy of funding (Luerhman, 1997)”.
FCFF continues to be the preferred model to many managers due to its simplicity and because it became over the years the most used model to perform companies’ valuation. Regarding its simplicity, it is inevitable that companies that aim a specific capital structure use it because the model fixes the capital structure of a company, however, to achieve that objective, the debt/equity ratio at market values changes and problems of circularity might appear, since it is ultimately this ratio that allows the estimation of the market values of debt and equity, essential for the final objective of having a fixed capital structure. Other disadvantage of the WACC model is related to the use of only one discount rate in the computation of the value of a company, assuming that rate supports all the risk a firm faces in its activities.
13
The APV has two main disadvantages according to Luerhman (1997). The first disadvantage is related to the fact that “income from stocks may be taxed differently when the investor files a personal tax return”. The second disadvantage is that the model does not take into account “costs of financial distress, as well as other financial side effects”. Miles and Ezzell (1980) state that the choice between these two models will depend on: “the exogeneity of the debt re-payment schedule and on the exogeneity of the leverage ratio in relation to the market values”. An exogenous ratio of leverage seems implausible for the authors and when there is an assumption of an exogenous schedule of debt payments, “Miles and Ezzell (1980) defend the use of the APV, instead of the FCFF/WACC approach”.1.4.6 Excess Return Models
These models consist in determining the excess returns of a firm relatively to the book values. “Baran et al., 2007 state that the EVA is an approach that looks to the value of a company in the eyes of the owners of it and most importantly, looks fundamentally to the capacity of value creation that a firm might have”. The EVA is appropriate to compare the excess returns over the cost of capital and the dynamic ROE in the case of excess returns in relation to the cost of equity of the firm. The models have the disadvantage of relying too much on the market, which is not always efficient and the other disadvantage of these models concerns the fact of not properly distinguishing the different business units that the firm might have.
EVA= (ROIC-WACC)* Invested Capital
These models, especially the EVA are considered to be simpler than Discounted Cash Flow models; “Burksaitiene (2009) states that the inputs used are the same in both methods”.
1.5 Relative Valuation
Other approach to evaluate a company is the use of multiples. “In relative valuation, the objective is to value assets of a firm based on how similar assets are currently priced in the market. There are two characteristics of relative valuation. The first one is the standardization of prices in order to value assets on a relative basis and the second one is to find an appropriate set of comparable firms (Damodaran, 2002)”.
The selection of comparable firms can pose a problem in relative valuation. It is difficult to find comparable firms in some cases. “According to Goedhart et al (2005), only firms with similar expectations of growth and return on invested capital should be compared”. Other approach to the choice of comparable firms is the one used by Bhorjraj and Lee (2001). The authors suggest that “the choice of comparable firms should be a function of the variables that drive cross-sectional variation in a given valuation multiple, instead of the common approach of choosing comparable firms based on
14
industry match”. The disadvantage of using a peer group consisting of firms of the same industry is that “those firms can have major differences in growth rates, returns on invested capital or in capital structures and due to that, defining the peer group only as firms inside the same industry can be problematic (Goedhart et al 2005)”.When properly used, “multiples can help a company to test its forecasted cash-flows, enable the comparison of a company’s performance with the performance of its competitors and can also identify the key factors to succeed in a specific industry” (Goedhart et al, 2005).
There are many multiples available to realize a relative valuation of a company and “Goedhart et al (2005) specifies four principles to apply multiples in a proper way: the use of comparable firms with similar prospects for ROIC and growth, the use of forward-looking multiples, the use of enterprise value multiples and the adjustment of enterprise-value-to-EBITDA multiple for non-operating items like operating leases and pensions, which should be added to the enterprise value”. “According to Fernandez (2001), multiples can be divided in three groups”:
Multiples based on the company’s capitalization (Equity value) Multiples based on the company’s value (Equity and Debt values) Growth-referenced multiples
Among the multiples based on the company’s capitalization, there are multiples such as the Price Earnings Ratio (PER), the Price to Sales (P/S) and the Price to Book Value (P/BV). These ratios have the advantage of not considering debt, but it can also be a problem if the levels of debt of the company are too different from the levels of the firms in the peer group. In the category of the multiples based on the company’s value, which are not influenced by the financing structure of the firm, there are multiples such as the Enterprise Value to EBITDA (EV/EBITDA) or the Enterprise Value to Sales (EV/Sales). The third group of multiples is the growth-referenced multiples, like the PEG or the Enterprise Value to EBITDA growth.
Besides these three categories, “Fernandez (2001) also refers relative or sector-specific multiples and emphasizes that these multiples have to be placed in a specific context, can be in respect to the firm’s own history, with respect to the market or with respect to the industry”. Regarding the valuation of Mota-Engil, a special focus will be given to two specific multiples: the Price to Earnings ratio and the Enterprise Value to EBITDA multiple.
1.5.1 Price Earnings Ratio
PE= Market price per share/Earnings per share
The PE ratio is the most widely used method of valuation (Source: Morgan Stanley Dean Witter Research), however, it is also one of the most misused and manipulated ratios. The PE ratio must be
15
consistently defined and variations in the definition of earnings should be avoided in the computation of the ratio. A major flaw of this multiple is that it is affected by the capital structure of a company. Additionally, it also “includes non-operating items in earnings, which may represent one-time events unnecessary in the valuation of the company (Goedhart et al, 2005)”. “Damodaran (2002) refers that firms that have higher growth, lower risk and higher payout ratios, controlling for other variables, have higher PE ratios, but also states that it is important to control these fundamentals across countries, time and companies, so that this multiple can give a precise estimation of a company’s value”. “Lie and Lie (2002) found evidence supporting the fact that the PE multiple based on forecasted earnings is more accurate than a PE based on historical earnings”. In the opposite direction of Lie and Lie (2002) is Sommer (2009), who states that a “PE based on historical earnings is more accurate than a PE based on forecasting earnings”.1.5.2 EV /EBITDA
EV/EBITDA= (Market value of equity + Market value of Debt- Cash)/EBITDA
“Férnandez (2001) argues that this ratio performs much better than PER in the majority of industries, including the construction sector”. The Enterprise Value to EBITDA multiple can be an alternative to the P/E ratio, due to the fact of “not being so affected by changes in capital structure and depreciations (Goedhart, 2005)”. Other reasons for the increasing popularity of this ratio are related to the fact of being a broader ratio, in the sense that “less firms have negative EBITDA then earnings per share and because it is more easily compared between firms with different levels of financial leverage, being a recommendable ratio for companies that have large investments in their activities (Damodaran, 2002)”.
A report of Moody’s Investors Service in 2000 stated some flaws that the ratio might have, namely the “fact of EBITDA not taking in consideration the reinvestment needs of a company, of being a wrong measure of liquidity or of ignoring changes in working capital”.
1.5.3 DCF vs. Relative Valuation
It is not fair to think that these two approaches compete with each other, in order to perform the best evaluation of a company. The method used should be to estimate the value of a company with both approaches. Many authors argued in favor of this idea. “Goedhart et al. (2005) and Férnandez (2001) suggested that multiples should be used as a complement to the most common approach used to value a company, the DCF”. Instead of substitutes, these two methods of evaluation should be understood as complements, despite DCF being more complete, it is important to compare the valuations of both DCF and multiples, especially because multiples give an important attention to market evaluation and on peer group comparison. Moreover, multiples do not demand as many assumptions as DCF valuation.
16
1.6 Cross-Border Valuation
Currently, the majority of the companies have the opportunity of developing a considerable volume of businesses in other countries. It can be acquisitions, projects with international partners, mergers and evaluating those activities is becoming increasingly important and it has to deal with some factors like “the choice of the currency to execute the analysis, the timing of discounting the foreign cash flows, the choice concerning the tax rate used (domestic or foreign), the estimation of the cost of capital and the risks involved in the cross-border activities (Froot, 1997)”. “According to Froot, 1997 there are two methods to discount foreign currency cash flows. One is to discount the cash flows in the foreign currency; the other is to convert the cash flows to the home currency and then discounting them, fitting particularly well in cases where projects are very vulnerable to changes in exchange rates”.
Cross-border valuation follows the same structure than conventional valuation, but in this type of valuation, there are special features like “different currencies, tax rates, legislation that requires some adaptations and the WACC method might be substituted by the APV or complemented with real options to better evaluate investments in foreign countries (Froot, 1997)”.
1.7 Valuation in Emerging Markets
“Koller (2000) stated that his favorite valuation approach in emerging markets is to use the discounted cash flows, but constructing different scenarios to properly deal with the risk associated with operations in emerging markets, especially macroeconomic variables like inflation rates, growth rates of GDP, interest rates, among others”.
When valuing operations in emerging markets, “the risks associated should be incorporated in the cash flows and not added to the risk free rate due to three main reasons: the first is that investors can diversify most of the risks associated with emerging markets, the second reason is that many of those risks differ by industry and are not uniform in all the industries of an emerging country and the final reason is that equity investments in a company can be lower than the risk associated with that specific country, for instance, investments in government bonds can be riskier than equity investments in corporations (Koller, 2000)”.
17
Mota-Engil
Engineering
and
Construction
Environment
and
Services
Transport
Concessions
2.
Company overview
2.1 Introduction
Manuel António da Mota created Mota Engil in 1946 in Amarante. Mota‐Engil is the current leader in the Portuguese sectors of civil construction and public works. Immediately after the foundation of Mota-Engil in Portugal, the company developed a branch in Angola. Currently, Mota-Engil is benefiting from the fact of being present in Angola since its foundation. The presence in Angola is a key success factor of the company nowadays and it is expected to continue to be in the future.
Mota‐Engil SGPS, the holding of the Group is quoted on PSI‐20, which is the most important index of the Euronext Lisbon, since 2005. The group is widely known for its presence in Portugal, but also in the other 19 countries where it operates (Appendix 1). The Mota‐Engil group has a portfolio of different activities, however, the three main areas where Mota‐Engil operates are:
Major shareholders of Mota-Engil SGPS
Mota Gestão e Participações
39,29%
Algosi- Gestão de Participações Sociais
14,92%
Privado Holding
5,06%
António Vasconcelos da Mota
2,45%
Figure 2- Major shareholders of Mota-Engil SGPS, SA Source: Euronext Lisbon Figure 1-Business Structure of Mota-Engil
18
Engineering and Construction
• Highways and Railways, Bridges and Viaducts,
Ports, Airports, Infrastructure maintenance,
Dams and Hydraulic Infrastructures, Silos and
Chimneys, Quarrying
Infrastructures
•Hotels, Shopping malls, Hospitals, Schools,
Public Buildings, Housing, Offices, Industrial
Construction, Schools and Public Buildings,
Rehabilitation of Buildings
Buildings
•Housing, Offices, Business Centres,Commerce
Real Estate
•Hydraulic Concrete, Electro mechanics,
Central Laboratory
Other Business Areas
2.2 Mota-Engil: Engineering and Construction
Mota‐Engil has the reputation of being one of the most important companies in the sector of Engineering and Construction in Portugal and in the other countries where it has construction projects. Mota‐Engil has focused on four main areas of the engineering and construction sector:
Source: Mota-Engil Figure 3-Engineering and Construction
19
Waste
• Solid urban waste
and industrial
waste collection
and treatment
• Urban cleaning
• Used oils
recycling and
enhancement
• Environmental
Education
Water
• Water and
sanitation
concessions
• Management of
water supply
systems
• Wastewater
management and
treatment
Logistics
• Management of
port terminals
• Operation of road
and rail terminals
• Integrated
logistics services
• Carriage of goods
by rail operations
Multi‐Services
• Buildings and
facilities
maintenance
• Rehabilitation of
pipelines
• Landscape
architecture
• Design,
construction and
maintenance of
green spaces and
golf courses
• Car park
management
• Operation of
electronic markets
• Finishing of mail
and Direct mail
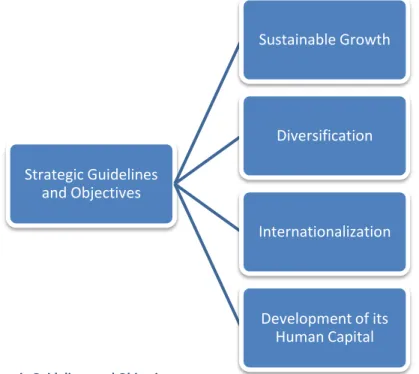
Strategic Guidelines
and Objectives
Sustainable Growth
Diversification
Internationalization
Development of its
Human Capital
2.3 Mota Engil: Environment and Services
I
n this segment, Mota‐Engil has businesses in four major areas:2.4 Strategic Guidelines and Objectives of Mota-Engil for the Future
The strategy of Mota-Engil for the future is focused on four main pillars according to the company: Figure 4-Environment and Services Source: Mota-Engil
Figure 5-Strategic Guidelines and Objectives Source: Mota-Engil
20
Moreover, the company is in a permanent search for new businesses and high returns. For each segment, Mota-Engil has some guidelines that will probably be achieved in the future and that were taken into consideration for the valuation of the company in this dissertation.The management team of the company reinforces the fact that the company is on track to achieve its long‐term goals, that the growth rate in Environment and Services accounts for small sized acquisitions and finally, that the level of leverage would be lower if the acquisitions turn out to not happen. In the dissertation, it was not assumed such an optimistic perspective, at least in relation to the forecasts of the future total turnover and EBITDA of the company (Appendix 2).
2.5 Recent Performance of Mota-Engil
Highlights of Mota‐Engil in 2010
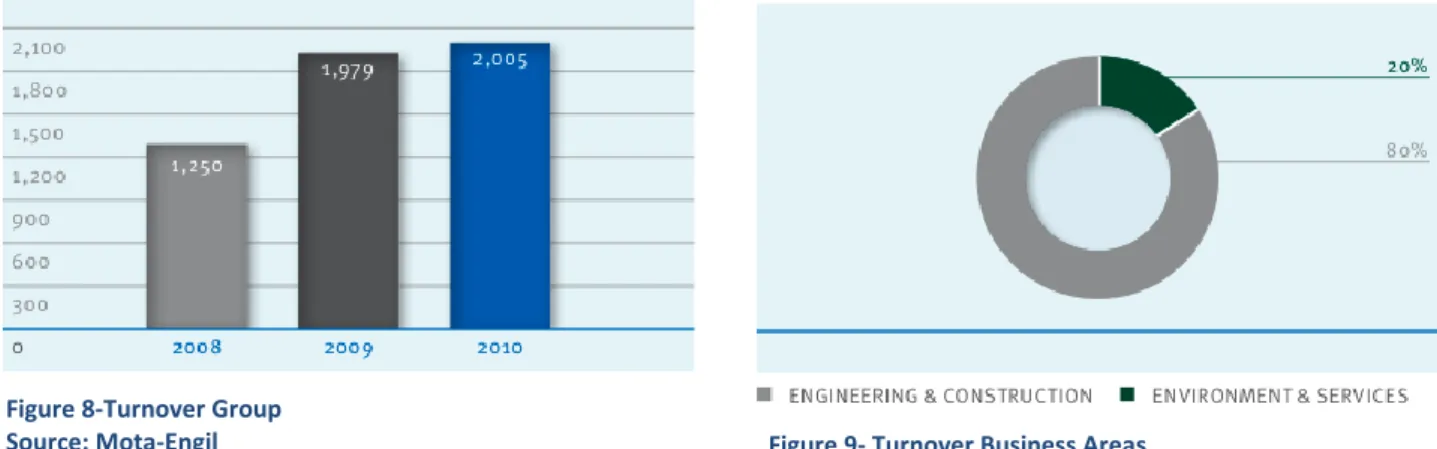
‐ Total turnover of 2.005 €million.
‐ EBITDA and EBIT margins of 11,8% and 6,6%, respectively ‐ Net income of 40,1 €million
‐ Backlog of €3.300million
‐ Corporate debt (with recourse) amounted to 907 €million Figure 7- Highlights of Mota-Engil in 2010 Source: Mota‐Engil Figure 6-Future Perspectives for Mota-Engil Source: Mota-Engil
21
The turnover of the group saw an increase in 2010 of approximately 1.3% in relation to 2009. The Engineering and Construction segment represents nearly 80% of the total turnover of the group and the Environment and Services segment nearly 20%. In the forecasts of the revenues of both segments, it was assumed that the current weights will be maintained in the next decade because despite the growth that the segment of Environment and Services has seen in the previous years, the Engineering and Construction segment still is the segment where Mota-Engil has its main competitive capabilities. The countries where Mota-Engil expects to develop the Engineering and Construction segment assure the company that this segment will also grow in the future at considerably high growth rates. The same line of reasoning applies to the Environment and Services segment, where the expectations of growth are also high for the next decade.The EBITDA of the group in 2010 also increased, mainly because the EBITDA margin of Engineering and Construction improved to 10.2% in 2010, when in 2009 it was only 7.9%. In 2010, the EBITDA increased approximately 21% in comparison with 2009. However, due to the higher volume of revenues generated by the Engineering and Construction segment, the contribution for the EBITDA of Engineering and Construction is still higher than the EBITDA of Environment and Services segment. In 2010, the EBITDA of Engineering and Construction was 67% of the total EBITDA of the company. Environment and Services contributed for 33% of the total EBITDA of Mota-Engil.
Figure 11-Capex Source: Mota-Engil Figure 10-Net Debt Excluding Non-Recourse
Source: Mota-Engil Figure 8-Turnover Group
Source: Mota-Engil Figure 9- Turnover Business Areas
22
One of the major weaknesses of Mota-Engil is the high level of Debt that the company possesses. Net Debt remained relatively constant in relation to 2009. In 2010, the Net Debt of Mota-Engil amounted to 1.015€ billion, in comparison with 908€ million in 2009. The Net Debt of the Engineering and construction segment was 303€ million in 2010 and the Net Debt of the Environment and Services segment was approximately 445€ million.In relation to CAPEX, the total amount in 2010 was 161€ million. The Environment and Services segment had 83€ million in CAPEX and the segment of Engineering and Construction 75€ million. In the time period of 2011-2020 used in this Dissertation, it was assumed that the total amount of CAPEX would decrease in comparison with recent years.
The order book in December of 2010 amounted to 3.3€ billion. From those 3.3€ billion, 2.9€ billion were from the Engineering and Construction segment, since Environment and Services is only related with the provision of services contracts in the Waste and Multi-Services sectors. The weight that Peru and Mozambique have in the order book of the company increased in 2010 and compensated the reduction in the Portuguese construction segment.
Figure 13-Order Book Source: Mota-Engil Figure 12-Order Book
23
3.
Engineering and Construction Overview
3.1 Mota-Engil: Engineering and Construction in Portugal
Mota‐Engil is the leader of the Portuguese construction sector. Portugal accounted for 42% of Construction revenues and 26% of the Construction’s EBITDA of Mota-Engil. The sector is currently in a deep crisis, which is something understandable due to the fact of the country being in a very difficult financial situation (Appendix 3) too. The Portuguese construction sector has been in crisis since a few years ago and the perspectives for the near future are not optimistic. The three main problems identified by Mota-Engil in this sector in Portugal are: low demand, excessive installed capacity and low operating margins. As a matter of simplicity, the activities of Mota‐Engil in this sector in Ireland and Spain are also included in the business segment of Portugal, since they have a residual weight on the total turnover of the company.
In Portugal, this activity continues to be dependent of the public investments and the Portuguese government will have some difficulties boosting this sector in the following years, due to the need of stabilizing the public finances (Appendix 3). It has already faced a contraction in public investments in the year of 2010. Especially negative is the fact of the residential‐building construction segment being the most affected by the financial crisis. Unfortunately, it is natural that when a country faces a financial crisis with consequences for the banking sector, families have more difficulties in obtaining loans to buy houses. The lack of confidence and the unemployment rate are also factors affecting the decrease in demand for housing in the previous years, a trend that has a good probability of being accentuated in the next years in Portugal. The private investments in the segment of non‐residential buildings also decreased, as a consequence of the financial crisis in the previous years. However, the public investments in this segment offset a little bit that reality in the past years, mainly due to the school‐buildings rehabilitation program done by “Parque Escolar”.
The Portuguese construction sector has been highly affected over the recent years by the poor economic performance of the country. In fact, the level of investments in this sector has decreased considerably over the years, both private and public investment. In 2010, it decreased 5.8% according to FEPICOP and it prolonged to nine the number of years that it has been decreasing. The production of the sector also decreased by the ninth consecutive year and in 2010, the estimated decrease was around 6.5% (Source: FEPICOP). The accumulated decrease in this sector is now of 35% (Source: FEPICOP). In Appendix 4, reality of the Portuguese construction sector is further developed.
24
Structure of the Portuguese Construction sector in 2010 (%of Total Revenues)Civil Engineering 46%
Residential 29%
Non-residential (private) 16%
Non-residential (public) 9%
Figure 1- Structure of the Portuguese construction sector Source: FEPICOP
3.2. Mota-Engil: Engineering and Construction in Central Europe (Poland)
Regarding Central Europe, Mota‐Engil has operations in Romania, Poland, Czech Republic, Slovakia and Hungary (Appendix 3). However, it is the presence in Poland that is most important for Mota‐Engil. In Poland, the company expects to grow in the segment of Engineering and Construction, especially in highway infrastructure (Appendix 5). According to the consolidated report of the company, three main factors have influenced the high growth in this segment in Poland and will continue to influence in the next years: the investments for the EURO 2012, investments financed by the EU and the growth of the property market. For this region, one of the objectives of Mota‐Engil is to develop the residential segment (highly affected by the financial crisis) in the most important cities of the countries in Central Europe like Warsaw, Prague or Bratislava. Central Europe is becoming very important for the strategy of Mota‐Engil, due to the expected growth rates in the segment of Engineering and Construction in those countries and it is even more important because the Portuguese market in this segment is stagnant.
Mota‐Engil has been conducting a policy of proximity with regional customers and in 2010, Mota‐Engil started operating in Lubuskie and Slaskie. The field of operations of Mota‐ Engil in Poland has now two more regions. In 2011, the company will focus its operations in Poland on the homebuilding sector, starting the third stage of the Slotysowska and the second stage of the Devonska II projects, with construction beginning in the second term of 2011.
Highlights of Mota‐Engil in Poland (2010) and factors influencing the future performance of the company in this region:
‐ Operations in Poland and Czech Republic: revenues of €239 million 2010 (15% of Construction Revenues and 5% of Construction EBITDA)
‐ Eastern Europe is short of decent roads, Poland most of all. It has fewer kilometers than even Slovenia, a country one‐tenth its size (Source: The Economist).
‐ Poland has currently 916 kms of motorways (23 kms per million inhabitants as compared to 271 kms per million inhabitants in Portugal)
‐ GGDKiA, the Polish road infrastructure authority should double capital expenditure to PLN 28 billion in 2011