Universidade de Trás-os-Montes e Alto Douro
Collective movement behaviour in association
football
Tese de Doutoramento em Ciências do Desporto
Candidato: Bruno Sérgio Varanda Gonçalves
Orientador: Professor Doutor António Jaime da Eira Sampaio
Coorientador: Professor Doutor Nuno Miguel Correia Leite
Composição do Júri:
Presidente: Professor Doutor Artur Agostinho de Abreu e Sá
Arguente: Professor Doutor Bruno Filipe Rama Travassos
Arguente: Professor Doutor Hugo Miguel Cardinho Alexandre Folgado
Vogal:
Professora Doutora Isabel Maria Rodrigues Gomes
Orientador: Professor Doutor António Jaime da Eira Sampaio
Funding
The work presented in this thesis was supported by the Portuguese Foundation for Science and Technology (FCT) and European Social Fund (ESF), through a Doctoral grant awarded by Bruno Gonçalves (SFRH/BD/86044/2012) under the Human Potential Operating Program (POPH); and through the Project Symbiotic technology for societal efficiency gains: Deus ex Machina (DEM), NORTE-01-0145-FEDER-000026, co-financed by Fundo Europeu de Desenvolvimento Regional (FEDER) by NORTE 2020.
Agradecimentos
Ao professor Jaime Sampaio, pela orientação, disponibilidade e pela exigência em todo o processo. Por todos os ensinamentos, pessoais e profissionais. Foi e será sempre uma referência, para onde quer que vá, faça o que fizer.
Ao professor Nuno Leite, pela coorientação e por ter sempre acreditado em mim de há uns anos a esta parte.
A todos os coautores dos trabalhos publicados. Pelo contributo científico, sugestões e correções.
Ao Eduardo Abade, pela companhia, virtual e presencial. Por todas as conversas, pessoais e profissionais. Por toda a confiança e valorização no meu trabalho. Mas essencialmente, pela pessoa boa que és e pelo grande amigo que te tornaste, obrigado!
À Sara Santos e ao Diogo Coutinho, pelos valores humanos em que se suportam, por estarem sempre disponíveis, pelas inúmeras conversas de partilha académica e pessoal. Por sempre me mostrarem o que significa dedicação e companheirismo. E principalmente, por me fazerem sentir útil durante estes anos.
Ao Bruno Figueira, por todos os momentos partilhados ao longo destes anos. Bons e maus, pessoais e profissionais, recordações para a vida...
Ao Hugo Folgado, pela partilha académica de todos estes anos. Sempre disponível a ajudar, sempre a pessoa antes do trabalho.
Ao Bruno Travassos, pela partilha de conhecimento, de vida e de trabalho.
Ao Angel Ric, pelas inúmeras conversas, pela partilha, por tão bem me receber sempre que foi necessário. Gracias amigo!
Ao Nuno Mateus, pelo apoio e valorização do que fui fazendo.
Ao Bruno Pasquarelli, pela amizade e partilha... ainda que longe... estás sempre presente! À tropa chinesa, Cui, Liu & Zhang, thanks for your part in my journey.
Ao Benedict Low, thanks for the support mate!
Ao Tiago Oliveira, pela troca de ideias e pela sempre boa disposição. À Patrícia Posse, por todo o suporte, pessoal e profissional.
À Juliana Exel, pela troca de ideias e sugestões.
Ao Marco Aguiar, pelo companheirismo ao longo destes anos.
Ao professor Victor Maças, pela partilha e por acreditar e valorizar o meu trabalho. Ao professor Luís Vaz, pelas palavras sempre simpáticas de valorização.
À Katy, por todos estes anos. Por sempre me valorizares, por estares sempre presente nos momentos mais difíceis, por sempre me apoiares, por toda a paciência e persistência... fazes parte de tudo isto!
E por último, porque serão sempre os primeiros na minha vida, à minha FAMILIA. Por serem a fonte de forças para tudo o que faço, por todos os valores que me transmitiram, por toda a dedicação em prol de um sentimento de união. Amo-vos muito!
Abstract
Positional tracking technologies have been providing reliable information that can boost the interpretation of football team’s performance by adopting different data-driven approaches. Accordingly, the available research is focused on quantifying the physical and physiological demands of the players when involved in real practice situations. However, these demands are dependent on team strategy and opponent behaviour, requiring performance to be analysed with a more complex approach. Thus, the general aim of this study was to explore the determinants of collective movement behaviour in association football by using positioning-derived variables. To fulfil this purpose, the data were collected from different environments (training and competition) and different players (under-15, under-17, under-19, professionals and amateurs). Social Network approaches, non-linear processing techniques and both time-motion and notational analysis were applied. During training conditions, small- and large-sided games (unbalance and pitch-area restrictions boundary conditions, respectively) were designed and analysed. In unbalanced games, results showed that the manipulation of the number of opponents may be effective to over-emphasise the use of the local information by the players to support the dynamics of the positional decision-making process. Regarding to the effects of limiting players’ spatial exploration during large-sided games, the results showed a great impairment in the co-adaptation between teammates’ positioning while a decrease in the physical and physiological performances was observed. In match environments, under-15 showed higher correlation between the dyads’ positioning regularity and the network passing density, indicating a possible higher dependence of the ball position rather than in the under-17 teams. During under-19 matches, results showed that displacements of all players were nearer and more regular with their own position-specific teammates. During professional matches, three scenarios should require additional attention when aiming to design match transferable tasks: i) transition from effective playing space (EPS) formed by 3 nearer players to EPS formed by 4 nearer players; ii) transition from EPS formed by 4 nearer players up to EPS formed by 8 nearer players; and iii) transition from EPS formed by 8 nearer players to EPS formed by 9 nearer players. Overall, the presented data approaches have intended to provide practical and holistic processing tools that can be used to better understand the sport collective movement behaviour through dynamical positioning. Keywords: dynamical systems; complex systems; behavioural dynamics; performance analysis; time-motion; GPS.
Resumo
Os avanços nas tecnologias de captação do posicionamento dos jogadores de futebol têm permitido adquirir informação fiável sobre o seu desempenho. A investigação disponível foca-se na quantificação de exigências físicas e fisiológicas dos jogadores em situações de contexto de treino e jogo. No entanto, estas exigências são dependentes da estratégia da equipa e do comportamento dos adversários, o que obriga a que o desempenho seja analisado através de metodologias mais complexas e multidisciplinares. Assim, este trabalho teve como objetivo explorar as características de funcionamento que estão na base do comportamento coletivo em futebol usando variáveis de posicionamento. Os dados foram recolhidos em ambientes de treino e de competição, em escalões de Sub-15, Sub-17, Sub-19, profissionais e amadores. Para o tratamento dos dados, foram aplicadas técnicas de processamento linear e não-linear, análise de redes sociais, análise de variáveis de tempo e movimento e análise notacional. Em ambiente de treino, foram desenhadas e analisadas tarefas de jogo em espaço reduzido (em desigualdade numérica) e com espaço próximo do regulamentar (com restrição de zonas do campo). Nas situações de desigualdade numérica, os resultados mostraram que a manipulação no número de adversários poderá ser efetiva para a necessidade do uso de informação local durante as decisões dinâmicas de posicionamento. Em situações de restrição espacial, os resultados revelaram uma diminuição drástica na capacidade de coadaptação posicional dos colegas de equipa e uma redução das necessidades físicas e fisiológicas. Em ambientes de competição, o escalão Sub-15 apresentou uma maior correlação no posicionamento com os colegas de equipa e uma maior densidade na rede de passes, comparativamente com o escalão Sub-17, indicando uma maior dependência do posicionamento da bola. No escalão Sub-19, os resultados evidenciaram que o posicionamento dinâmico de todos os jogadores foi mais próximo e mais regular com os colegas pertencentes ao mesmo posto específico. Em competição com jogadores profissionais, três cenários requerem maior atenção aquando do desenho de tarefas com transferibilidade comportamental: i) transição da superfície de espaço de jogo ocupado pelos 3 colegas de equipa mais próximos para o espaço ocupado por 4; ii) transição de 4 até 8; e iii) transição de 8 para 9. Todas as abordagens empíricas tiveram como objetivo fornecer ferramentas de processamento para melhor compreender a dinâmica do comportamento posicional.
Palavras-chave: sistemas dinâmicos; sistemas complexos; dinâmica comportamental; análise do desempenho; tempo-movimento; GPS.
List of publications and communications
Peer-reviewed papers in international journals (ISI)
Five original manuscripts have been published or submitted for publication on the ground of this thesis:
Gonçalves, B., Folgado, H., Coutinho, D., Marcelino, R., Wong, D., Leite, N., & Sampaio, J. (In press).
Changes in effective playing space when considering sub-groups of 3 to 10 players in professional football matches. Journal of Human Kinetics.
Gonçalves, B., Coutinho, D., Santos, S., Lago-Penas, C., Jiménez, S., & Sampaio, J. (2017). Exploring
Team Passing Networks and Player Movement Dynamics in Youth Association Football. PLoS
One, 12(1), e0171156.
Gonçalves, B., Esteves, P., Folgado, H., Ric, A., Torrents, C., & Sampaio, J. (2017). Effects of Pitch
Area-Restrictions on Tactical Behavior, Physical, and Physiological Performances in Soccer Large-Sided Games. Journal of Strength and Conditioning Research, 31(9), 2398-2408.
Gonçalves, B., Marcelino, R., Torres-Ronda, L., Torrents, C., & Sampaio, J. (2016). Effects of
emphasising opposition and cooperation on collective movement behaviour during football small-sided games. Journal of Sports Sciences, 34(14), 1346-1354.
Gonçalves, B., Figueira, B., Maçãs, V., & Sampaio, J. (2014). Effect of players’ specific position during an
11-a-side simulated football game. Journal of Sports Sciences, 32(2), 191-199.
Communications at scientific meetings
Exploratory results of this thesis have been presented in national and international scientific meetings, originating some publications in proceedings and abstract books:
Gonçalves, B., Marques, P., Lago-Peñas, C., Exel Santana, J., Coutinho, D., & Sampaio, J. (2017,
5th-6th October). Exploring how the position of the ball can affect the ratio of effective playing space from confronting teams in association football. Oral presentation at the International Congress Complex Systems in Sport Linking Theory to Practice - Training to Improve Performance, Barcelona, Spain.
Gonçalves, B. (2017, 27th March). Monitorização em Futebol: dimensão física, técnica e tática. Oral
presentation at IV Congresso de Futebol (certificado pelo IPDJ), Universidade de Trás-os-Montes e Alto Douro, Vila Real, Portugal.
Gonçalves, B., Esteves, P., Folgado, H., Ric, A., Torrents, C., & Sampaio, J. (2016, 11th-12th
November). Effects of soccer pitch area-restrictions on tactical behaviour, physical and physiological performances in large-sided games. Oral presentation at the CIDESD 2016: International Congress of Exercise and Health, Sports and Human Development, Évora, Portugal.
Gonçalves, B. (2016, 1st July). Novas tecnologias na observação e análise do comportamento
individual e coletivo em futebol. Oral presentation at the Cursos de Treinadores “UEFA Advanced A” (Grau III), Federação Portuguesa de Futebol, Fátima, Portugal.
Gonçalves, B. (2016, 11th April). Monitorização através de tecnologia GPS®. Oral presentation at 3º Congresso de Futebol (certificado pelo IPDJ), Universidade de Trás-os-Montes e Alto Douro, Vila Real, Portugal.
Gonçalves, B., Marcelino, R., Torres-Ronda, L., Torres-Martín, C., & Sampaio, J. (2014, 14th-15th
November). Footballers’ movement behaviour when playing small-sided games manipulating the number of opponents and teammates. Oral presentation at the CIDESD 2014: International Congress of Exercise and Sports Performance, Guarda, Portugal.
Gonçalves, B., Marcelino, R., Leite, N., & Sampaio, J. (2014, 4-15th May). Using GPS systems to
monitor team sports performance. Oral presentation at the 3rd Seminar on Biomechanics, Health and Sustainable Environment: Health Co-Benefits of Climate Change Mitigation – The Adaptaclima II Project, Vila Real, Portugal.
Other publications
Some parallel studies were developed with the thesis advisor, Jaime Sampaio, and others researchers regarding to collective movement behaviour in sport. From this collaboration resulted the following original manuscripts:
Folgado, H., Gonçalves, B., & Sampaio, J. (2017). Positional synchronization affects physical and physiological responses to preseason in professional football (soccer). Research in Sports Medicine, 1-13.
Coutinho, D., Gonçalves, B., Travassos, B., Wong, D. P., Coutts, A. J., & Sampaio, J. E. (2017). Mental Fatigue and Spatial References Impair Soccer Players' Physical and Tactical Performances. Frontiers in Psychology, 8(1645).
Ric, A., Torrents, C., Gonçalves, B., Torres-Ronda, L., Sampaio, J., & Hristovski, R. (2017). Dynamics of tactical behaviour in association football when manipulating players' space of interaction. PLoS ONE, 12(7).
Ric, A. Hristovski, R., Gonçalves, B., Torres-Ronda, L., Sampaio, J., & Torrents, C. (2016). Time scales for exploratory tactical behaviour in football small-sided games. Journal of Sports Sciences, 34(18), 1723-1730.
Ric, A., Torrents, C., Gonçalves, B., Sampaio, J., & Hristovski, R. (2016). Soft-Assembled Multilevel Dynamics of Tactical Behaviors in Soccer. Frontiers in Psychology, 7(1513).
Aguiar, M., Gonçalves, B., Botelho, G., Lemmink, K., & Sampaio, J. (2015). Footballers' movement behaviour during 2-, 3-, 4- and 5-a-side small-sided games. Journal of Sports Sciences, 33(12), 1259-1266.
Leite, N., Leser, R., Gonçalves, B., Calleja-Gonzalez, J., Baca, A., & Sampaio, J. (2014). Effect of defensive pressure on movement behaviour during an under-18 basketball game. International Journal of Sports Medicine, 35(9), 743-748.
Sampaio, J., Gonçalves, B., Rentero, L., Abrantes, C., & Leite, N. (2014). Exploring how basketball players’ tactical performances can be affected by increasing fatigue. Science, & Sports, 29(4), 23-30.
Sampaio, J., Lago, C., Gonçalves, B., Victor, M., & Leite, N. (2014). Effects of pacing, status and unbalance in time motion variables, heart rate and tactical behaviour when playing 5-a-side football small-sided games. Journal of Science and Medicine in Sport, 17(2), 229-233. Travassos, B., Gonçalves, B., Marcelino, R., Monteiro, R., & Sampaio, J. (2014). How perceiving
additional targets modifies teams’ tactical behaviour during football small-sided games. Human Movement Science, 38(0), 241-250.
List of abbreviations
AMA amateur players ApEn approximate entropy CL confidence limits CV coefficient of variation
DC distance from each player to the team centroid
DOP distance from each player to the opponent team centroid EPS effective playing space
ES effect size
GPS global positioning systems HGcoop high-cooperation HGinf high-inferiority LSG large-sided games LWcoop low-cooperation LWinf low-inferiority LWsup low-superiority MDcoop medium-cooperation
NearOP distance from each player to the nearest opponent PRO professional players
SD standard deviation SEI spatial exploration index SSG small-sided games
TRIMPMOD modified training impulse
Table of contents
Agradecimentos ... I Abstract ... III Resumo ... V List of publications and communications ... VII List of abbreviations ... XI Table of contents ... XIII Figures ... XV Tables ... XIX
1 General introduction ...1
1.1 Performance analysis in team sports ...3
1.1.1 Historical and contemporary theoretical approaches ...4
1.1.2 Advanced methods to collect positional data in team sports ...6
1.1.3 Data processing and visualising tools ...9
1.2 Aim of the thesis ...19
1.3 Structure and outline of the thesis ...21
2 Training environment ...23
2.1 Effects of emphasising opposition and cooperation on collective movement behaviour during football small-sided games ...25
2.1.1 Abstract ...25
2.1.2 Introduction ...26
2.1.3 Methods...28
2.1.4 Results ...31
2.1.5 Discussion ...37
2.2 Effects of pitch area-restrictions on tactical behaviour, physical and physiological performances in football large-sided games ...41
2.2.1 Abstract ...41
2.2.2 Introduction ...42
2.2.3 Methods...44
2.2.5 Discussion ...55
3 Match environment ...59
3.1 Exploring team passing networks and player movement dynamics in youth association football ...61 3.1.1 Abstract ...61 3.1.2 Introduction ...62 3.1.3 Methods...64 3.1.4 Results ...68 3.1.5 Discussion ...72
3.2 Effect of player position on movement behaviour, physical and physiological performances during an 11-a-side football match ...77
3.2.1 Abstract ...77
3.2.2 Introduction ...78
3.2.3 Methods...80
3.2.4 Results ...83
3.2.5 Discussion ...87
3.3 Changes in effective playing space when considering sub-groups of 3 to 10 players in professional football matches ...91
3.3.1 Abstract ...91 3.3.2 Introduction ...92 3.3.3 Methods...93 3.3.4 Results ...96 3.3.5 Discussion ...100 4 Final Remarks ...103
4.1 Conclusions and practical implications of the thesis’ studies ...105
4.1.1 Study 1 – SSG: unbalance scenarios in training environment ...105
4.1.2 Study 2 – LSG: pitch area-restrictions in training environment ...106
4.1.3 Study 3 – Teammate dyads positioning in match environment ...107
4.1.4 Study 4 – Team sectorial positioning in match environment ...108
4.1.5 Study 5 – Team structures positioning in match environment ...109
4.2 Summary of the thesis and future applications ...111
Figures
Figures were subsequently numbered following section number.
Figure 1.1.1. Depiction of the confrontations between Team A midfielders versus Team B midfielders. The upper panel (a) shows the centroid position density represented by a heat map. In (b), the light shading represents the Effective Playing Space (EPS) for team A midfielders (blue) and team B midfielders (red). The darker shading indicates the difference between the EPS of both teams. The percentage (66% higher to team A, blue) shows the amount of time that midfielders in one team present higher EPS than their opponents. The lower panel (c) shows in lighter shading the average speed (10 sec moving-average window) of the midfielders of each team (team A in blue and team B in red) and, in darker shading, the difference between both teams. The percentage (62% higher to team B, red) shows the amount of time that midfielders in one team were faster than their opponents. The panel was adapted from the work of Memmert et al. (2016). ...11 Figure 1.1.2. Voronoi diagrams of 6 match frames sequence for team A (blue) and team B (red). Each frame depicts the sectorial areas of each team as well as sectorial area difference between confronting teams. The Figure panels are intended to show the sequence of key game moments. ...13 Figure 1.1.3. Examples of linear and nonlinear measures of several time series with same time duration. Each panel displays the mean, standard deviation (SD), coefficient of variation (CV) and approximate entropy (ApEn). The panel was adapted from the work of Harbourne and Stergiou (2009). ...15 Figure 1.1.4. Visual representation of how regular/predictable is the dynamic distance from pairs of dyads among teammates. The nodes’ positions are represented by the player’s field position, while the size of each node represents the mean regularity of a player’s distance with nine other teammates. The edges represent the dynamic distance between teammates and the corresponding widths grow exponentially with the regularity. ...16 Figure 2.1.1. Data analysis for the SSG scenarios considering the variation in the number of opponents and teammates. ...29 Figure 2.1.2. Effective playing space outcome for the SSG scenarios. Upper panels: professional players, lower panels: amateur players. The represented shapes correspond to an example of mean values for each scenario. ...33
Figure 2.1.3. Standardized (Cohen) differences in positional variables according to the opponents (left panel; a, b, c) and cooperative (right panels; d, e, f) analysis. Error bars indicate uncertainty in the true mean changes with 95 % confidence intervals. Abbreviations: ApEn=approximate entropy; DC=distance to centroid; DOP=distance to opponent centroid; NearOP=distance to nearest opponent; PRO=professional players; AMA=amateur players; LWsup=low-superiority; LWinf=low-inferiority; HGinf=high-inferiority; LWcoop =low-cooperation; MDcoop=medium-cooperation; HGcoop=high-cooperation. ...36 Figure 2.2.1. Exemplar frame of the experimental task conditions for player movement possibilities. Upper panel represents the restricted-spacing, the pitch was divided into nine playing areas where players were assigned according to their specific playing position and not allowed to move out during the game, exception made to the two lateral defenders from the 10 player team (i); middle panel, represents contiguous-spacing, the pitch was divided into nine playing areas where any player (but only one for each team) was allowed to move to a neighbouring area (ii); and lower panel, represents free-spacing, where players had no restrictions in space occupation (iii). ...46 Figure 2.2.2. Spatial exploration index example for one bout of the LSG scenarios. The circumferences representations were created based on individual index values, used as radius. The letters represent players mean position across three conditions; mean±std index was reported for each player (inside of the circumferences) as well as team mean (presented on the left side of each pitch representation). ...50 Figure 2.2.3. Standardized (Cohen) differences in tactical and physical/physiological variables according to the 10 players’ team (left panel; a, b, c) and 9 players’ team (right panels; d, e, f) analysis. Error bars indicate uncertainty in the true mean changes with 90 % confidence intervals. Abbreviations: m=meters; CV=coefficient of variation; ApEn=approximate entropy; Long=longitudinal; Lat=lateral; synchro=synchronization. ...54 Figure 3.1.1. Between-teams’ differences for both age group analyses. Right side of the graph means higher values to the higher performance team in the match (U15 team A and U17 team A), left side more to lower performance team ...69 Figure 3.1.2. Visual representation from U15 match analysis. Upper panel, (a) passing network: nodes’ positions are represented by the player’s field position, sized according to the closeness centrality, and collared based on betweenness scores. The width of the edges grows exponentially with the number of passes successfully performed between two teammates and
the colour density increase. Lower panel, (b) positioning: presents the dyads’ regularity classification; the regularity relations are represented based on cluster analysis. The nodes are collared according individual area and sized according to the corresponding CV. ...70 Figure 3.1.3. Visual representation from U17 match analysis. Upper panel, (a) passing network: nodes’ positions are represented by the player’s field position, sized according to the closeness centrality, and collared based on betweenness scores. The width of the edges grows exponentially with the number of passes successfully performed between two teammates and the colour density increase. Lower panel, (b) positioning: presents the dyads’ regularity classification; the regularity relations are represented based on cluster analysis. The nodes are collared according individual area and sized according to the corresponding CV. ...71 Figure 3.1.4. Teams’ correlation coefficient (with 90 % confidence intervals) between the numbers of successfully passes performed and the positioning regularity values across dyads. Shaded area represents unclear correlation. ...72 Figure 3.2.1. The variation of distance covered at the considered speed zones. Statistical significant differences are between: (dm) defenders and midfielders; (df) defenders and forwards; (mf) midfielders and forwards. ...84 Figure 3.2.2. Representation of distances (m) and ApEn values from defenders (n=4), midfielders (n=3) and forwards (n=3) to each centroid (defender, midfielder and forwards). The arrows a, b and c represent the defenders’ relations to centroids; the arrows d, e and f represent the midfielders’ relations to centroids; the arrows g, h and i represent the forwards’ relations to centroids. ...86 Figure 3.2.3. Relative phase of couple position-specific centroids’ oscillating movements from both teams in lateral (upper panel; a, c and e represent relations between the different pairs of players) and longitudinal (lower panel; b, d and f represent relations between the different pairs of players) directions. ...86 Figure 3.3.1. Frame example of the smallest polygonal areas delimited by outfield players who were nearer to each other. The grey arrow means the team’s attack direction. Abbreviations: EPS=effective playing space. ...95 Figure 3.3.2. Graphical descriptive overview from each of the six-preseason matches variables. Abbreviations: EPS=effective playing space; ApEn=approximate entropy. ...99
Tables
Tables were subsequently numbered following section number.
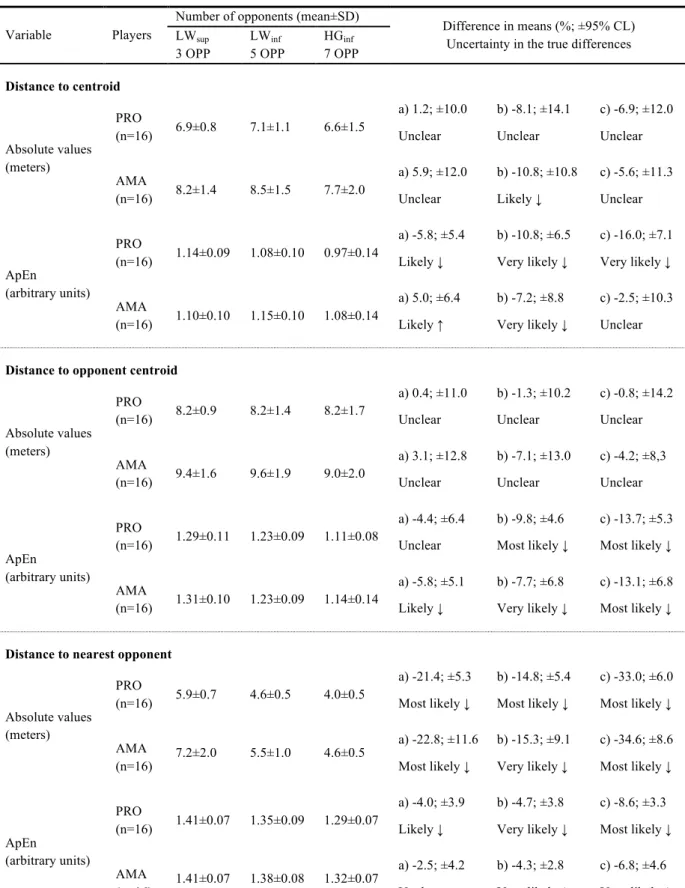
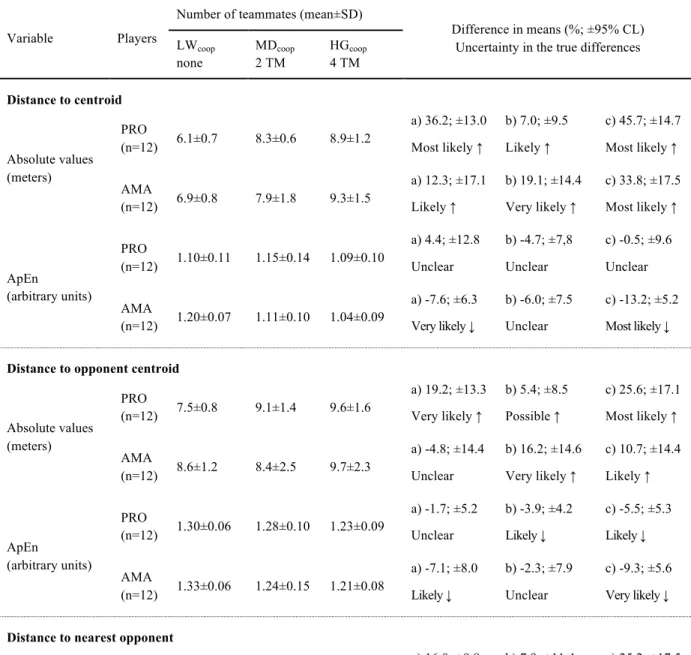
Table 2.1.1. Descriptive analysis for both professional and amateurs’ positional variables, when varying the number of opponents. ...34 Table 2.1.2. Descriptive analysis for both professional and amateurs’ positional variables, when varying the number of teammates. ...35 Table 2.2.1. Descriptive tactical analysis (mean±SD). Difference in means and uncertainty in the true differences comparisons among considered LSG scenarios to both teams. ...52 Table 2.2.2. Descriptive physical and physiological analysis (mean±SD). Difference in means and uncertainty in the true differences comparisons among considered LSG scenarios to both teams. ...53 Table 3.2.1. Comparison of TRIMPMOD and body load across playing positions. ...85 Table 3.3.1. Descriptive analysis for the sub-group comparisons. ...97 Table 3.3.2. Descriptive statistics for sub-group comparisons. ...98 Table 4.2.1. Overview of the current thesis’ studies. ...112
1.1 Performance analysis in team sports
One of the biggest challenges in sports science is to search for performance determinants that help to optimise the coaching process and ultimately, the competition outcome (McGarry, 2009). This role has been supported by the discipline of performance analysis. This is a topic in sport and exercise science focused on measuring the actual sports performance by gathering valid, accurate and reliable information during competitive environments, and using those information to improve individual or collective sports performance (O'Donoghue, 2014). It does not rely on activity measured under laboratory conditions or through questionnaires or interviews. Instead, basis to have an ecological and valid performance analysis should be the training and competition environments (O'Donoghue, 2010; O'Donoghue, 2014). Under this circumstance, the term “performance indicator” was objectively established to measure valid and important aspects of performance. An indicator could be either a single variable or combinations of variables that determine whether a performance has been successful or unsuccessful (Hughes & Franks, 2004).
As one of the traditional methods of performance analysis in team sports, notational analysis seeks to obtain indicators of discrete actions and/or events by using advanced statistical procedures (Carling, Reilly, & Williams, 2009; Hughes & Franks, 2004, 2007). This approach is used to provide answers about the static complexity (see the next section for a deep understanding of complexity in team sports) of performance and has been presented as a powerful framework to produce valid and reliable description and characterisation of teams’ performance (Liu, Gomez, Gonçalves, & Sampaio, 2016; Sampaio et al., 2015). More specifically, performance indicators such as the number of shots and successful passes have been used to explain why some teams are more successful than others in association football (Castellano, Casamichana, & Lago, 2012; Lago-Penas, Lago-Ballesteros, Dellal, & Gomez, 2010; Lago-Penas, Lago-Ballesteros, & Rey, 2011; Mike & Ian, 2005).
These static analyses permit the use of massive datasets and correlate a wide range of indicators. However, this process provides only a discrete description of players’ decisions, and therefore focuses more on performance outcomes rather than the underpinning behaviours that lead to them. In other words, the assessment method is based on consequences of performance (outcomes), and therefore, the information about their causes (behaviours) become somehow trivial because only a partial description of the team’s behaviour is evaluated. Thus, notational analysis provides insufficient information to explain why and how
players and teams dynamically regulate their actions under certain space and time to achieve a common goal (Travassos, Davids, Araújo, & Esteves, 2013b). In this sense, players’ positioning dynamics on the pitch recently emerged as one of the key determinants of football performance and may play an important role to complement the understanding of performance (Gudmundsson & Horton, 2017; Memmert, Lemmink, & Sampaio, 2016). This is linked to players’ spatiotemporal relationships in respect of the collective principles of play, the opponents’ behaviour and the contextual circumstances. Accordingly, new visuals, instruments, procedures and processing techniques may be incorporated into the performance analysis scope to raise new dimension of questions, mostly related to the dynamic complexity in complement of static complexity analysis. Therefore, the main goal of performance analysis should be the development of a more functional, holistic and complex understanding of teams’ sports performance.
1.1.1 Historical and contemporary theoretical approaches
In team sports, such as association football, the analysis of performance should be a multifactorial process requiring high accuracy in physiological, technical and tactical workload prescriptions that, ultimately, determines the players’ and teams’ performances. However, the physical and physiological demands of the players when involved in real practice scenarios have been investigated incessantly over the last years. For instance, the quantification of physical workload was always seen as a key to accurate programme conditioning plans and ensure optimal conditions for competition (Rebelo et al., 2012; Stagno, Thatcher, & Van Someren, 2007). In this sense, it is not surprising that most of the available research is focused on describing the movement patterns during training (Dellal et al., 2012; Hill-Haas, Dawson, Impellizzeri, & Coutts, 2011; Krustrup, Mohr, Ellingsgaard, & Bangsbo, 2005) and competition environments (Carling & Dupont, 2011; Di Salvo et al., 2007; Lago, Casais, Dominguez, & Sampaio, 2010). These studies allowed developing different performance profiles by describing, for example, distance covered in different speed ranges, and contribute to optimising short- and mid-term planning guidelines, aiming to minimise the effects of fatigue and potentiate players’ performance considered relevant for the match demands (Coutinho et al., 2015). Nevertheless, other research approaches consider that these demands might be dependent on team strategy and opponent behaviour (Sampaio, Lago, Gonçalves, Maçãs, & Leite, 2014; Travassos et al., 2013a), where different factors may
affect players’ physical responses during the competitive environments (McGarry, 2009). Consequently, the identification of informational constraints that players use to regulate their tactical decisions within the teams’ collaborative work principles, should be pointed out as a key factor to boost the understanding of players’ interpersonal coordination patterns and physical demands.
In summary of these previous considerations, it seems mandatory to redefine the understanding of player performance, by creating more holistically and contextually dependent methodologies that integrate different performance dimensions. To support these assumptions, players’ collective behaviours need to be analysed within dynamical systems principles (Grehaigne, Bouthier, & David, 1997; McGarry, Anderson, Wallace, Hughes, & Franks, 2002). The main idea is that the structures and configurations generated by the players’ interactions while playing should be considered as a whole – where systems with many dynamically interacting elements are capable of wide-ranging patterns of behaviour – rather than being examined by the individual parts (Grehaigne et al., 1997). The emergence of these complex behavioural structures appears as the result of change in space-time configurations of players’ interactions (McGarry, 2009; McGarry et al., 2002). Here, the application of complex system terminology appears to seek understanding on how system working parts are connected and how they constantly adapt over time (Hristovski, Balagué, & Schöllhorn, 2013; McGarry, 2009).
One important fundamental property shared by all complex dynamic systems, and applied in human movement variability, is that they are fundamentally characterised by being highly unpredictable and highly connected, resulting in non-linear relationships among the parts of the system (Stergiou, 2016). Thus, the determination of the state of the system in the future can be challenging since the context will always shape the upcoming behaviours. Accordingly, and over the last years, several investigations used these theoretical guidelines to understand the emergence of coordination patterns when considering players’ interaction with teammates and opponents during training and match environments. In training environments, these studies have mainly focused on exploring the effects of different boundary conditions on collective movement behaviour during small-sided game (SSG) tasks (Aguiar, Gonçalves, Botelho, Lemmink, & Sampaio, 2015; Davids, Araujo, Correia, & Vilar, 2013; Ric et al., 2016a; Sampaio et al., 2014; Sampaio & Maçãs, 2012; Silva et al., 2014a; Travassos, Gonçalves, Marcelino, Monteiro, & Sampaio, 2014a; Vilar et al., 2014). In match
environments, players’ and teams’ behaviours have been examined from the associations between configuration (states) of movements aiming to identify and describe the emergent tactical patterns underpinning performance, while preserving the sequential and situational characteristics of match events (Duarte et al., 2013a; Duarte et al., 2013b; Folgado, Duarte, Fernandes, & Sampaio, 2014a; Folgado, Duarte, Marques, & Sampaio, 2015; Ric, Torrents, Gonçalves, Sampaio, & Hristovski, 2016b; Vilar, Araujo, Davids, & Bar-Yam, 2013). In all the previously-mentioned studies, the tracking of players’ positioning dynamics on the pitch plays a common and crucial role in linking players’ positioning decisions with the principles defined for each planned team strategy. Therefore, this information may provide valuable clues for training optimisation and to design more transferable tasks to the competition (Travassos et al., 2013b; Travassos, Duarte, Vilar, Davids, & Araújo, 2012b).
1.1.2 Advanced methods to collect positional data in team sports
Historically, the processes used to collect data in team sports were based on observational sheets, filled manually during the training and game environments. With recent advancements in technology in sport, automated or semi-automated tracking systems have been developed, shifting the focus of these processes to the capture of players’ motion. Sports analysis has become more sophisticated. These data-gathering innovations that allow for the tracking of spatio-temporal movements of players, were already predicted to be a critical factor in the description of sports behaviours and the understanding of game dynamics (McGarry, 2009). However, it appears that practitioners of today still do not fully utilise the usefulness of such data in their decision-making processes. This results in vast, untapped potential in improving sports performances in a more substantial manner.
The main advances that have allowed the collection of players’ positioning, i.e. the in-field coordinates with high-fidelity stream, can be classified according to the nature of the technology: global positioning systems (GPS) (Cummins, Orr, O'Connor, & West, 2013); computer-vision technology systems (Di Salvo, Collins, McNeill, & Cardinale, 2006); and radio-frequency based local positioning systems (Leser, Baca, & Ogris, 2011).
GPS is a satellite-based navigational technology originally developed for military purposes, however it has been extensively used in team sports settings. From its technical operation, the system is able to trigonometrically determine the exact position of any GPS receiver on the earth by calculating the distances to at least four satellites (Larsson, 2003). In team sports, this tracking technology has been used in many studies to better understand players’ physical work rate activity during both training and match environments (Cummins et al., 2013). At the same time, extensive research about its validity and reliability have been carried out in different GPS devices, with different sample frequencies and applications across several team sports (Aughey, 2011; Castellano, Casamichana, Calleja-Gonzalez, San Roman, & Ostojic, 2011; Jennings, Cormack, Coutts, Boyd, & Aughey, 2010; Johnston et al., 2012; Varley, Fairweather, & Aughey, 2012; Waldron, Worsfold, Twist, & Lamb, 2011). For example, while the 5 Hz GPS units were presented as valid to measure the total distance covered (percentage typical error of measurement below 5%) and peak speed (percentage typical error of measurement from 5 to 10%) (Johnston et al., 2012), the 10 Hz GPS devices were revealed to have higher accuracy, regarding the criterion for ranges of velocities (coefficient of variation 3.1-11.3%) and for measuring instantaneous velocity (coefficient of variation 1.9-6.0%) (Varley et al., 2012). However, when the raw data from these system devices are exported, some issues may arise such as missing data in the time series. Consequently, specific procedures should be conducted before making further use of them (Folgado et al., 2014a). The main advantages of GPS tracking technologies are the portability and low-cost price, when compared to the radio-frequency based local positioning systems and the computer-vision technology systems. Besides, the FIFA® press release in 8 of July 2015 entitled “Approval of Electronic Performance and Tracking System (EPTS) devices” permits players to wear the devices during official matches. This opportunity may provide important insights to the study of demands transferability between training and match, since the technology may be used in both environments. As for disadvantages, the system operates only outdoors (with a clear view of the sky) and, until now, cannot track the ball position.
Computer-vision technology systems
It is noteworthy that manually tracking multiple players in team sports is a long, laborious and extensively time-consuming task (Fernandes, Folgado, Duarte, & Malta, 2010). Computer-vision methods can augment some of those procedures with the automatic/semiautomatic
tracking, annotating and indexing of ball and players (Magee & Pers, 2009). The introduction of the computer-vision technology was slow due to poor video and computational facilities and also the complexity of tracking arising from quick player movements, with sudden changes of direction and collisions with other players (Needham & Boyle, 2001). Other constraints include the violation of the smooth motion assumption, on which many algorithms are based, and the congestion of players, where occlusions are frequent (Barris & Button, 2008). However, nowadays, it is widely recognised as one of the most powerful systems of performing players-tracking with high results of accuracy (Di Salvo et al., 2006; Mandeljc, Kovacic, Kristan, & Pers, 2013). Technically, the computer-vision technology requires an elaborated system installed in the stadium to obtain accurate and reliable positional data based on high frequency, time-synchronized and calibrated multiple video cameras (Di Salvo et al., 2006; Magee & Pers, 2009; Mandeljc et al., 2013). The computer-vision cameras capture video, before several algorithms combine to extract the positioning data of all identified objects on the field. A big advantage of this system is that no wearable devices are needed, which allows using the technology in real-time during official competition. However, the system is not readily portable and is financially costly.
Radio-frequency based local positioning systems
The radio-frequency based local positioning systems operate on a frequency-modulated and continuous wave principle, measuring the distance between fixed base stations and mobile tags placed on the players (Leser et al., 2011; Ogris et al., 2012). This technology operates similarly to the GPS, and has an advantage of obtaining players’ positional data in outdoor and indoor field sports, providing periodic location updates (Ogris et al., 2012; Sathyan, Shuttleworth, Hedley, & Davids, 2012). It has been established as an accurate and valid tool to record the static and dynamic position changes of the players and can be considered acceptable for practical applications in sports analyses (Ogris et al., 2012). However, less reliable data were recorded when dealing with high dynamic movements and measuring instantaneous velocities (Ogris et al., 2012). Moreover, there are some constraints that must be considered, particularly when the playing field has larger dimensions. This could have impact on the necessary strength of the electronic signals that are transmitted from the players to the energy source (Mandeljc et al., 2013). Additionally, the main disadvantage of this
technology is the portable radio receivers and radio-emitting tags that the players need to wear, making it to be an intrusive system (Mandeljc et al., 2013).
1.1.3 Data processing and visualising tools
The previous section highlights the advances in position-tracking technologies that provide reliable data. However, the same systems operate with big data in both structured and unstructured way. As in most research topics, opportunities created by big data are followed by several problems in conceptualising efficient models, data processing and data visualisation (Sivarajah, Kamal, Irani, & Weerakkody, 2017). To overcome some of these issues, processing skills may present an important role in linking raw numbers to practice, aiming to optimise the decision-making process of coaches. This thesis’ section is intended to show how, by adopting positional data-driven approaches, there is a large potential to boost the understanding of collective movement behaviour. Also, it is intended to present several positioning-derived variables to create an association between the complex dynamical interactions among teammates, opponents and the environment, as well as with the in-match decision consequences. The main idea is to link all the previous sections with several application examples that support the following thesis structure.
Positional dynamics of confronting teams
It has been argued that the tactical behaviours approach needs to be accounted with the effect of pitch location on players’ and teams’ relations (Travassos et al., 2014a). Complementary information from a dynamic analysis of inter-team centroid (i.e. the mean position from all outfield players) was shown as a potential approach to describe events associated with different game moments (Frencken, Poel, Visscher, & Lemmink, 2012). Also, match pacing is suggested as an informational constraint to influence the emergence of behavioural dynamics (Folgado et al., 2014a; Sampaio et al., 2014). Thus, the following practical example intended to explore and identify the speed dominance of one team sector (midfielders) over the other from a dynamic perspective, i.e. maintaining the sequential events across the game. Also, it is intended to understand how players’ speed coordination are related with neighbouring teammates based on spatial dependence.
Figure 1.1.1 shows three different analyses of the same confrontation that can be processed and visualised by using players’ positional data from training tasks or matches contexts. In this specific example, players’ dynamic positional coordinates were used from team A midfielders versus team B midfielders in a 25 minute-duration of a friendly match (under 15 age group, unpublished data). The upper panel, Figure 1.1.1a, shows the midfielders’ centroid position density represented by a heat map (as measured by the midfielders’ average x and y dynamic position coordinates across match). From a processing and visualization perspective, the coloured scatterplot mimics a continuous 2D distribution. It is represented through a scatterplot with dots of sizes that correspond to their density in the swarm of points. The larger dots will also have a “hotter” colour in the dense particle region. The algorithm uses the x and y coordinates of the centroid as vectors of the same size, the parameter of local radii around each data point and parameter for the area of the weighted dots (for algorithm computation see Sundqvist (2010)). From a practical and functional perspective, this computation allows us to identify the pitch regions of higher time positioning density and explore the sectorial mobility across the match. It also allows observations of teams’ pitch-area dominance during play. For example, the heat map of team A midfielders’ centroid (blue) may suggest higher participation in offensive actions (higher time in offensive pitch half).
The middle panel, Figure 1.1.1b, shows the effective playing space (EPS) for both team A (blue) and team B (red) midfielders. From a processing perspective, the EPS is defined as the smallest polygonal area/region delimited by the peripheral outfield players that provides information about the surface area that is being effectively covered. The EPS area (measured in m2) may be easily computed (e.g. by convhull function provided by Matlab®) and contributes to an understanding of how teams utilise pitch space to gain superiority over their opponents. In the Figure visualization, the darker shading indicates the difference between the EPS of both teams. The results show that in 66% of match time, the midfielders of team A presented higher EPS than their opponents suggesting more spatial dominance over the pitch. In the lower panel, Figure 1.1.1c, shows the average speed of the midfielders’ displacements for both teams (calculated from the mean speed of each midfield player) and how these different speed dynamics are coupled across match time. The results demonstrate the increased amount of time that midfielders in team B run faster than their counterparts (62% higher of match duration).
Figure 1.1.1. Depiction of the confrontations between Team A midfielders versus Team B midfielders. The upper panel (a) shows the centroid position density represented by a heat map. In (b), the light shading represents the Effective Playing Space (EPS) for team A midfielders (blue) and team B midfielders (red). The darker shading indicates the difference between the EPS of both teams. The percentage (66% higher to team A, blue) shows the amount of time that midfielders in one team present higher EPS than their opponents. The lower panel (c) shows in lighter shading the average speed (10 sec moving-average window) of the midfielders of each team (team A in blue and team B in red) and, in darker shading, the difference between both teams. The percentage (62% higher to team B, red) shows the amount of time that midfielders in one team were faster than their opponents. The panel was adapted from the work of Memmert et al. (2016).
The overall results in Figure 1.1.1 show that midfielders of the team A spend more time in the offensive pitch half (shown by heat map), presented more spatial dominance over the pitch (shown by EPS confrontation) and run at lower speed (shown by speed displacements confrontation). In this example, the pitch dominance seems to be related with lower external workload demands. Generally, the EPS and speed displacements present opposite trends of interaction (when EPS increases the speed displacement decreases). However, in specific moments of the match (e.g. from ~8 to ~9 min of the game, for team B - red) the teams increase both EPS and speed displacement in the same direction. These teams’ configuration transitions demonstrate the non-linear attributes of the match and may help in characterising different behaviour dynamics and all critical events. Also, this approach may complement the conventional match statistical indicators (as goals, shots on target, player substitutions, etc.) to understand how these effects may influence the spatial pitch dominance. This information, processed based on players’ positioning dynamics, may contribute to a better ecological understanding of how behaviours flow between teams during dynamic analysis and to produce a more complex and holistic view from players and teams’ performance assessment.
Space control of confronting teams
Another example of the practical application of players’ positioning dynamics is the Voronoi cell computation (Fonseca, Milho, Travassos, & Araujo, 2012). This approach allows the measuring of spatial dominance by partitioning the pitch area into zones closest to each of the players according to their dynamic positions. This definition can be functionally understood in Figure 1.1.2 where a 6-frame sequence in a match is presented in a Voronoi diagram (the data are from professional elite teams, unpublished data). In the figure’s panel, from 1.1.2a (midfielder observes moment) to 1.1.2f (goal moment) a decrease in defensive sectorial area can be observed in the blue team (team that conceded the goal), from (a) 1309 m2 > (b) 1194 m2 > (c) 1020 m2 > (d) 797 m2 > (e) 682 m2 > (f) 435 m2. At the same time, the offensive sectorial area of the red team (team who scored) increased their spatial dominance from (a) 126 m2 < (b) 180 m2 < (c) 202 m2 < (d) 391 m2 < (e) 665 m2 < (f) 762 m2. Despite being a small example, this approach contributes to a better understanding of the game’s dynamic events by providing complementary information about players’ decisions and also the emergence of collective patterns of behaviour.
Figure 1.1.2. Voronoi diagrams of 6 match frames sequence for team A (blue) and team B (red). Each frame depicts the sectorial areas of each team as well as sectorial area difference between confronting teams. The Figure panels are intended to show the sequence of key game moments.
Accordingly, different studies have used this method and integrating novel algorithms: for instance, measuring spatial interaction behaviour using superimposed Voronoi diagrams (Fonseca, Milho, Travassos, Araujo, & Lopes, 2013) or assessing passing effectiveness by evaluating their effects on space control (Rein, Raabe, & Memmert, 2017). Thus, future investigation and practical procedures would benefit from incorporating these algorithms into
more complex approaches aiming to complement the understanding of collective space creation and control. For instance: this approach may help to understand how different tactical structures (1-4-3-3; 1-4-4-2; 1-3-5-2; etc.) modify the space controlled by each specific positional role, such as, how a fullback’s spatial dominance is modified by different tactical configurations; or, how facing teams with different tactical structures modifies the space controlled by each specific sector, providing important information for coaches to design training tasks that are representative of the space used by the defensive sector according to the opposition.
Measuring performance variability through linear and nonlinear processing techniques One of the most important concerns about how the data has been used in team sports to analyse variability is related to the linearity of the measurements. As stated in the historical and contemporary theoretical approaches section, one of the fundamental characteristics of a dynamical complex system (as football) is the principle of high unpredictability and high connectedness. However, the traditional linear processing techniques fail to provide reliable information regarding this aspect. To illustrate this issue, the Figure 1.1.3 exemplifies different time series processed with traditional linear measures of range (mean, standard deviations (SD), coefficient of variation (CV)) and nonlinear measures (Approximate entropy (ApEn)). ApEn computation technique has been used to quantify the structure of the variability from a specific time-series. The output ranges between 0 and 2 (arbitrary units); lower values represented more repeatable, regular, predictable and less chaotic sequences of data points (Pincus, 1991; Stergiou, Buzzi, Kurz, & Heidel, 2004; Yentes et al., 2013). From a processing approach, ApEn expresses the probability that the configuration of one segment of data in a time series will allow the prediction of the configuration of another segment of the time series a certain distance apart (Harbourne & Stergiou, 2009). In practice, this technique may be used, for example, to identify if players’ positioning dynamics express a regular and predictable pattern which may, in turn, provide information regarding their tactical behaviour (Duarte et al., 2013b; Sampaio et al., 2014; Silva, Duarte, Esteves, Travassos, & Vilar, 2016). The upper panel, Figure 1.1.3a shows a real example from 25 minutes of match duration of the distance between central defender and defensive central midfield (under-17 age group, unpublished data). Both middle panel (Figure 1.1.3b, a random time series from normal distribution) and lower panel (Figure 1.1.3c, a generated sine wave) were computed with
specific mean and variance. From visual inspection, the middle panel shows a signal that looks irregular/unpredictable, completely random. The lower panel shows a signal very regular/predictable. However, analysing the time series by quantification of the mean, SD and CV, all examples resulted in the same values (mean=19.5, SD=8.5, CV=0.44). Bringing this case to the area of performance analysis, and using the considered measures, it may lead to misinterpretations since different dyads of players might display the same final results. Yet, despite the fact that time series may present the same variability amplitude, the structure should vary because the players’ positioning dynamics is completely different. Thus, it seems mandatory to include complementary processing techniques that may overcome the limitations of the linear measures. Here, the ApEn (nonlinear) may play an important role in measuring the variability of time series. As can be seen in the Figure, and notwithstanding that the amount of variability is the same in three panels, the corresponding structure is different. This assumption is supported by the ApEn with 0.12 in distance between players, 2.12 in random numbers and 0.04 in generated sine wave.
Figure 1.1.3. Examples of linear and nonlinear measures of several time series with same time duration. Each panel displays the mean, standard deviation (SD), coefficient of variation (CV) and approximate entropy (ApEn). The panel was adapted from the work of Harbourne and Stergiou (2009).
The Figure 1.1.4 depicts the level of regularity/predictability in the distance between players, expressed by the ApEn function, during a friendly match of 25 minutes’ duration (under-17 age group, unpublished data). Taking into consideration the all-possible intra-team pairing/dyads formed by the outfield teammates, 45 dyads were considered for the analysis. The results were illustrated based on network approaches where the edges that link the players were weighted according to the regularity of the corresponding dynamic distance (the width of the edges grow exponentially with the decrease of ApEn values between dyads). The players were ranked based on ApEn average values to identify, for example, which player may be considered as a solid communication-teammate within team structure organization. For instance, the dyad formed by LCD and RCD presents the most regular positioning pattern, while RCM and CF shows the most unpredictable (less regular). Also, this approach may afford novel information about players’ specific position roles. In this sense, the DCM presented an unpredictable positioning behaviour within sectorial players (i.e. LCM and RCM), while the RCD and LCD showed a more predictable positioning.
Figure 1.1.4. Visual representation of how regular/predictable is the dynamic distance from pairs of dyads among teammates. The nodes’ positions are represented by the player’s field position, while the size of each node represents the mean regularity of a player’s distance with nine other teammates. The edges represent the dynamic distance between teammates and the corresponding widths grow exponentially with the regularity.
This may provide a different paradigm to understand actual behaviour of players’ roles in team strategy (e.g. identifying players that act as an informational link between positioning sectors) and enables us to identify which intra-team sub-groups structures could present more stability across the game. Further information may be postulated based on absolute distances to understand how players share their space within teammates and how they interact to achieve common goals over the match.
1.2 Aim of the thesis
The general aim of this study was to explore the determinants of collective movement behaviour in association football by using positioning-derived variables during both training and match environments. To fulfil this purpose, the data were collected from both training tasks and competitive scenarios and the participants were players from the age groups of under-15, under-17, under-19, professionals and amateur. Social network approaches, linear and non-linear processing techniques, time-motion, physiological and notational analysis were applied to explore the effects of several training conditions and match scenarios on collective engagement in adaptive movement behaviour.
1.3 Structure and outline of the thesis
The present thesis encompasses a set of five original research studies, published in peer-reviewed international journal with Thompson ISI Impact Factor©. The studies emerged from several research problems, both from training and match environments, where players’ positioning dynamics, technical, physical and physiological variables were empirically addressed to better understand the collective movement behaviour.
Section 1 – General introduction
The first section addresses the historic and contemporary theoretical approaches that form the foundations of collective movement behaviour, as well as an up-to-date insight about advanced processes used to collect positional data in team sports. The section ends with some examples of processing and visualizing tools.
Section 2 – Training environment
Study one aimed to compare the player positioning dynamics’ when manipulating the number of opponents and teammates during football SSG, played by professional and amateur players. The manipulation effects were tested using several positioning-derived variables such as effective playing space, distances from each player to the team centroid, distances from each player to the opponent team centroid, and the distance from each player to the nearest opponent.
Study two aimed to identify how manipulation of pitch area-restrictions affects the collective tactical behaviour and players’ physical and physiological performances during football large-sided games. Players’ positioning dynamics were used to compute several pitch-positioning variables and players’ physical performances. The outcomes were interpreted according to interactions within the physical and physiological performances, and consequently enabling a more holistic, complex and ecological evaluation.
Section 3 – Match environment
Study three aimed to explore how passing networks and positioning variables can be linked to the match outcome in youth elite association football. Here the strengths from both network
approach and positioning-derived variables were coupled to create an association between the dynamical tactical relations established among teammates and the environment, as well as with the in-game decision’ consequences. Understanding how youth football players base their game interactions may constitute a solid criterion for fine-tuning the training process and, ultimately, achieve better individual and team performances during competition. This approach incorporates a wide range of complex individual behaviours and explores how these may affect and be affected by the group structures.
Study four aimed to identify the differences in time-motion, TRIMPMOD, body load and movement behaviour between defenders, midfielders and forwards, during an 11-a-side friendly football match. Here it was hypothesised that non-linear dynamical analysis can help to identify different inter-player coordination behaviours. Although important advances have been developed to help analyse performance in football match conditions, there are still difficulties in describing and integrating performance indicators from different dimensions (e.g. tactical and physiological). In this sense, this insight may provide additional information about movement behaviour of the players’ specific positions within well-described physiological demands.
Study five aimed to identify the changes in EPS when considering sub-groups of 3-10 players. More specifically, the EPS of different sub-groups was calculated, measured in absolute values (m2), considering a progressively larger number of nearby players. The CV and regularity level of the EPS, as well as mean speed displacement and corresponding CV, were compared among various sized sub-groups. Although prior expectations suggest that a higher number of players will result in higher EPS values, the magnitude of changes in EPS and the optimal number of players in proximal interaction are unknown and remain to be explored. Thus, collectively considering how player displacements are coupled with those of neighbouring teammates, based on spatiotemporal dependence, and different levels of interaction may improve understanding of its effect on varying numbers of interacting players within team behaviours.
Final remarks
A general conclusions and practical implications of the thesis’ studies, as well as a summary future applications, were addressed in this section.
2.1 Effects of emphasising opposition and cooperation on collective
movement behaviour during football small-sided games
12.1.1 Abstract
Optimizing collective behaviour helps to increase performance in mutual tasks. In team sports settings, the (SSG) have been used as key context tools to stress out the players’ awareness about their in-game required behaviours. Research has mostly described these behaviours when confronting teams have the same number of players, disregarding the frequent situations of low and high inequality. This study compared the players’ positioning dynamics when manipulating the number of opponents and teammates during professional and amateur football SSG. The participants played 4v3, 4v5 and 4v7 games, where one team was confronted with low-superiority, low- and high-inferiority situations, and their opponents with low-, medium- and high-cooperation situations. Positional data were used to calculate effective playing space and distances from each player to: team centroid, opponent team centroid and nearest opponent. Outcomes suggested that increasing the number of opponents in professional teams resulted in moderate/large decrease in approximate entropy (ApEn) values to both distance to team and opponent team centroid (i.e. the variables presents higher regularity/predictability pattern). In low-cooperation game scenarios, the ApEn in amateurs’ tactical variables presented a moderate/large increase. The professional teams presented an increase in the distance to nearest opponent with the increase of the cooperation level. Increasing the number of opponents was effective to over-emphasise the need to use local information in the positioning decision-making process from professionals. Conversely, amateur’ still rely on external informational feedback. Increasing the cooperation promoted more regularity in spatial organisation in amateurs and emphasise their players’ local perceptions.
Keyword: behavioural dynamics; inequality games; playing positioning.
1 Gonçalves, B., Marcelino, R., Torres-Ronda, L., Torrents, C. & Sampaio, J. (2016). Effects of emphasising opposition and cooperation on collective movement behaviour during football small-sided games. Journal of Sports Sciences, 34(14), 1346-1354.