Article
0103 - 5053 $6.00+0.00
*e-mail: [email protected]
Cadmium and Lead Cloud Point Preconcentration and Determination in Tobacco Samples
by Thermospray Flame Furnace Atomic Absorption Spectrometry
Frank P. Andrade, Clésia C. Nascentes and Letícia M. Costa*
Departamento de Química, Universidade Federal de Minas Gerais, 31270-901 Belo Horizonte-MG, Brazil
A espectrometria de absorção atômica com forno tubular na chama (TS-FF-AAS) foi empregada para a determinação de Cd e Pb em diferentes tipos de amostras brasileiras de tabacos após a pré-concentração no ponto nuvem (CP) otimizada por planejamento Doehlert. Para a separação das fases no procedimento por ponto nuvem, Triton® X-114 e 2-(bromo-2-piridilazo)-5-dietilaminofenol (Br-PADAP) foram utilizados como surfactante não iônico e agente complexante, respectivamente. Cádmio e chumbo foram determinados após digestão ácida e pré-concentração por ponto nuvem, sendo que as variáveis otimizadas por planejamento Doehlert foram: volume do agente complexante, volume de Triton® X-114 e pH. Um ponto de máximo foi obtido nas superfícies de resposta para Cd e Pb. Para as determinações dos elementos por TS-FF-AAS, um volume de amostra de 50 µL foi introduzido no tubo de Ni posicionado sobre a chama, usando ar como carregador na vazão de 0,4 mL min-1. Os limites de detecção e os desvios padrão relativos após a combinação de CP e TS-FF-AAS foram de 4,0 e 13 µg kg-1 e 3,1 e 0,7% para Cd e Pb, respectivamente. A exatidão do método proposto foi avaliada realizando-se testes de adição-recuperação e empregando-se material de referência certiicado (folhas de chá e folhas de pessegueiro). As recuperações variaram de 93 a 103 e 93 a 107% para Cd e Pb, respectivamente. Todos os resultados obtidos para as amostras dos materiais de referência estão em concordância com os valores certiicados a um nível de coniança de 95 ou 99% aplicando-se o teste t-Student.
A thermospray lame furnace atomic absorption spectrometer (TS-FF-AAS) was employed to determine Cd and Pb in different Brazilian tobacco samples. Sample pretreatment consisted of acid decomposition and cloud point (CP) preconcentration optimized by Doehlert design. To promote phase separation in the cloud point procedure, polyoxyethylene(8) isooctylphenyl ether (Triton® X-114) and 2-(bromo-2-pyridylazo)-5-diethyl-amino-phenol (Br-PADAP) were used as a nonionic surfactant and a complexing agent, respectively. The variables of the cloud point preconcentration procedure optimized by Doehlert design were: complexing agent volume, Triton X-114 volume, and pH.A response surface maximum point was obtained for Cd and Pb. For TS-FF-AAS, a sample volume of 50 µL was introduced into the hot Ni tube using air carrier at a low rate of 0.4 mL min-1. The limits of detection and relative standard deviations obtained for Cd and Pb when CP and TS-FF-AAS were associated were 4.0 and 13 µg kg-1, and 3.1 and 0.7%, respectively. Accuracy was checked by addition-recovery experiments, as well as by using two certiied reference materials (tea and peach leaves). Cadmium and lead recoveries ranged from 93 to 103 and 93 to 107%, respectively. All results obtained for reference materials were in agreement with certiied values at 95 or 99% conidence levels by t-Student test.
Keywords: tobacco, acid digestion, cloud point preconcentration, Doehlert design, TS-FF-AAS
Introduction
The relevance of trace metals in biological samples derives from their essentiality, as well as from their potentially toxic effects in living organisms. An example of a toxic trace metal in biological systems that has
no biological function in humans is lead, a cumulative metabolic poison with physiological and neurological effects.1 Lead has carcinogenic properties and interferes
with the resistance to infectious diseases.2 Another metal
and gonads.2 This metal can gradually accumulate in the
human body, producing a number of adverse health effects, such as nephrotoxicity and osteotoxicity.1 The toxicity of
Pb and Cd in biological luids has been reported, especially concerning the determination of safe concentration intervals and overexposure effects. Acceptable concentrations of Pb and Cd in human blood are below 100 and 10 µg L-1,
respectively, depending on the subject’s age and gender; however, individual sensitivity to biological exposure varies.2
Cadmium and lead are present in tobacco samples. Cadmium is the best-studied metal in cigarette smoke and smoking is the main source of Cd intake by humans.3
In contrast, smoking is not the main source of Pb intake by humans, but its contribution has become increasingly relevant. The ability of plants like Nicotiana tabacum to accumulate metalsis utilized by modern biotechnology to decontaminate soils. However, with respect to tobacco farming for cigarette production, this ability poses a health threat. In fact, toxic metals, such as Al, Cd, Cr, Cu, Pb, Hg, Ni, and Zn, are found in tobacco, cigarette paper and ilter, and cigarette smoke. The role of these metals in the pathophysiology of diseases caused by cigarette smoking is poorly understood. Emerging data suggest that the alteration of metal homeostasis in the human body by cigarette smoking plays a crucial role in the genesis of a number of diseases.3
Modern analytical chemistry is characterized by hyphenated analytical techniques that involve the combination of sensitive components to improve detection, as recently proposed by Wu et al.4 Sometimes, a
preconcentration step helps to solve sensitivity problems, such as low analyte concentrations in actual samples or high concentration of matrix interferents present in complex samples, especially in biological ones.5
Cloud point extraction (CPE) is a separation and preconcentration procedure that has been extensively applied in the determination of trace metal ions in several matrices.6,7 Its main advantages are its low cost, simple
experimental procedure, high preconcentration factors, and environmental and personal safety.8 Cloud PE is based
on the property of most nonionic surfactants in aqueous solutions to form micelles and become turbid when heated to cloud point temperature, above which the micellar solution separates into a small volume surfactant-rich phase and a diluted aqueous phase with surfactant concentration close to the critical micellar concentration (CMC).9 Its
main limitation is the relatively low partition coeficients of several metal species with determined chelates. However, this can be circumvented with the use of highly hydrophobic ligands.10
Several analytical techniques, such as molecular absorption spectrophotometry, lame atomic absorption spectrometry (FAAS), inductively coupled plasma mass spectrometry (ICP-MS), graphite furnace atomic absorption spectrometry (GF AAS), and inductively coupled plasma optical emission spectrometry (ICP OES), have been used to determine metals in micellar phase with sensitivity in most applications. Although previous results have shown that the FAAS detection limits are incompatible with determination at sub µg L-1 levels, depending on the matrix,
the detection limits can be improved.11 With this point in
view, since Gáspár and Berndt11 proposed thermospray
lame furnace atomic absorption spectrometry (TS-FF-AAS), its sensitivity to trace levels for different elements has been improved.12 The association of CPE procedures
and TS-FF-AAS has been used in the last years in the direct determination of some metals in liquid samples.13-16
TS-FF-AAS achieves complete sample introduction and increases the concentration of the atoms in the optical path. This technique is based on the atomization of the species through the formation of a thermospray at the end of a ceramic capillary inserted into a hot Ni tube located on the FAAS burner.17,18 The tip of the ceramic capillary penetrates the
sampling hole, resulting in a very high temperature gradient. The sensitivity for different elements is increased up to two orders of magnitude.11,16,17 Slurry sample introduction,1,18
direct sample introduction,14,19,20 preconcentration methods
using CPE,12,21 and solid sorbents6,22 are some strategies that
are applied with TS-FF-AAS.
The aim of this work was to develop an analytical procedure employing Cd and Pb separation and preconcentration by cloud point methodology for their determination in Brazilian tobaccos by thermospray lame furnace atomic absorption spectrometry (TS-FF-AAS).
Experimental
Instruments
A Perkin Elmer Model AAnalyst 200 lame atomic absorption spectrometer (Norwalk, USA) equipped with a deuterium lamp background correction system was used. Electrodeless discharge lamps were used in the determination of Cd and Pb. The wavelength and spectral band pass were set at 283.3 and 0.7 nm for Pb and 228.8 and 0.7 nm for Cd. An acetylene low rate of 2.5 L min-1
was used with an air low rate of 10.0 L min-1. The FAAS
instrumental parameters were adjusted according to the manufacturer’s recommendations.
Labortechnik Analytik, Glattbrugg-Zürich, Switzerland) furnished with Tygon tubes, a lab-made commuting injector, and a thermospray lame furnace unit, which included the ceramic capillary (0.5 mm i.d., 2.0 mm 0.d., and 100 mm in length) and a Ni tube (10 cm). The tube was located on the burner, laid on four ceramic ixed pins of a lab-made stainless steel support and could be moved in and out of the lame. To reach the proper atomization temperature for Cd and Pb inside the tube, six 2-mm diameter holes were drilled on the bottom of the tube. Another hole was drilled at 90° to the bottom holes for inserting the thermospray capillary. The capillary tip was set about 1 mm inside the tube furnace. The manifold was assembled with 0.5-mm i.d. PTFE tubing.13
The samples were prepared using a mufle furnace (Quimis, Q318M, Diadema, SP, Brazil), a hot plate (Tecnal, 1E085 Piracicaba, SP, Brazil), a centrifuge (Janetzki T32, Berlin, Germany), a domestic microwave oven (Panasonic, São Paulo, SP, Brazil), and a pHmeter (Digimed DM20 São Paulo, SP, Brazil).
Reagents and solutions
All solutions were prepared using analytical grade reagents (Merck, Darmstadt, Germany) and distilled and deionized water (Druckfester Mischbett-Wasservollentsalzer, DI800, Munich, Germany). The laboratory glassware was kept overnight in 10% v/v nitric acid solution, rinsed with deionized water, and dried in a dust-free environment before use.
Reference solutions of Cd and Pb were prepared daily by diluting 1000 mg L−1 stock solution with 1% v/v HNO
3
solution. A 1.0 mmol L-1 solution of Br-PADAP in 5.0%
(m/v) Triton® X-114 (Sigma-Aldrich, St. Louis, MO, USA)
solution was prepared by dissolving 36.0 mg of 2-(bromo-2-pyridylazo)-5-diethyl-amino-phenol (Br-PADAP) in water and adding 5.0 g of nonionic surfactant. The volume was completed to 100.0 mL with distilled-deionized water. A buffer solution with pH 9 was prepared by mixing 50.0 mL of 0.1 mol L−1 H
3BO3/KCl and 21.5 mL of
0.1 mol L−1 NaOH. The pH was adjusted using 0.5 mol L−1
NaOH and the volume was completed to 100.0 mL with distilled-deionized water. The viscosity of the micellar phase was reduced using a 0.1 mol L-1 HNO
3 in ethanol
90% (v/v) diluent solution.
Samples
Different Brazilian tobacco samples (regular cigarettes, tobacco rolls, and straw cigarettes) manufactured by different companies bought at a local market in Belo
Horizonte, Minas Gerais, Brazil were analyzed using TS-FF-AAS.
The accuracy of the proposed method was checked with standard reference materials, tea leaves (GBW 08505) and peach leaves (GBW 08501), produced by the Research Center for Eco-Environmental Sciences (Beijing, China).
Ash and wet digestion procedure
A mass of 500 mg of tobacco samples was mineralized at 450 °C for 6 h, until a white ash was obtained. The residue was treated with 2.0 mL of concentrated nitric acid and evaporated to dryness before heating at 450 °C for 30 min. The cooled residue was moistened with water and dissolved in 1.0 mL of concentrated hydrochloric acid and water. After cooling, the colorless solution was made up to 25.0 mL with water.23
As previously mentioned, all solutions were prepared using analytical grade reagents and distilled and deionized water.
Cloud point extraction procedure for the determination of Cd and Pb by TS-FF-AAS
The preconcentration procedure addition sequence for Cd and Pb was as follows: 10.0 mL of sample, 1.0 mL buffer solution pH 9.0, Br-PADAP solution (1.0 mmol L-1), and
Triton® X-114 solution 5.0% (m/v). The solution was placed
in a domestic microwave oven at 10% of the maximum power to accelerate the formation of micelles in the cloud point preconcentration procedure and to prevent sample loss, as discussed by Bezerra et al.10
The separation of the micellar phase from the aqueous phase was accelerated by centrifuging the solution for 10 min at 2500 rpm. The solution was cooled in an ice bath and kept in it for 15 min. The micellar phase became viscous and the aqueous phase was removed by inverting the container. In the last step, 0.5 mL of diluent was added to the separated micellar phase. After the addition of the nitric acid/ethanol solution, 50 µL of the micellar phase was introduced into the spectrometer through the sampling system and the analytical signals were recorded in integrated absorbance.
Optimization procedure for Cd and Pb cloud point extraction applying Doehlert design
Based on previously reported data,8,24 some experiments
procedure. In TS-FF-AAS, the best atomic absorbance signals were obtained employing Br-PADAP. Thus, the optimization study was performed with Br-PADAP.
The preconcentration cloud point procedure was optimized using a Doehlert design in association with response surface methodology (RSM). A Doehlert matrix is a second-order design that can be drawn with two, three, or more variables or factors.25,26 It allows identifying critical
points (maximum, minimum, and saddle points) at each step of the optimization process and consists of an experimental design in which a set of points is uniformly distributed in a spherical lattice (in a case of three variables). The whole experimental domain is assayed with a minimum number of experiments following a sequential approach. For a k number of factors, (k2 + k + 1) experiments are required.27
According to the Doehlert design for three variables, the factors pH and inal concentration of the Br-PADAP solution were studied at ive levels. The inal concentration of the Triton® X-114 5.0% (m/v) solution was studied
at three levels. Table 1 shows the design matrix for the optimization experiments of these variables with laboratory values, along with coded values in parentheses. The pH was studied in the 7.0-11.0 range. The inal concentration of Br-PADAP was studied using volumes ranging from 50 to 450 µL, whereas the inal concentration of the Triton®
X-114 5.0% (m/v) solutionwas studied using volumes from 50 to 1050 µL.
The experimental data were processed using the Statistica® software.28
Results and Discussion
CP preconcentration optimization of the experimental conditions using Doehlert design
The CP preconcentration conditions were optimized using 50.0 µg L−1 Cd and Pb reference solutions. Air
was used as a carrier to avoid the pronounced dispersion observed at the solution-carrier interface.19,20 The low
rate used to introduce 50 µL of the micellar solution into the hot Ni tube was 0.4 mL min-1. Flow rates higher than
0.65 mL min-1 may reduce the sensitivity, because the
residence time of the liquid in the heated capillary tip is too short for evaporation to occur.9
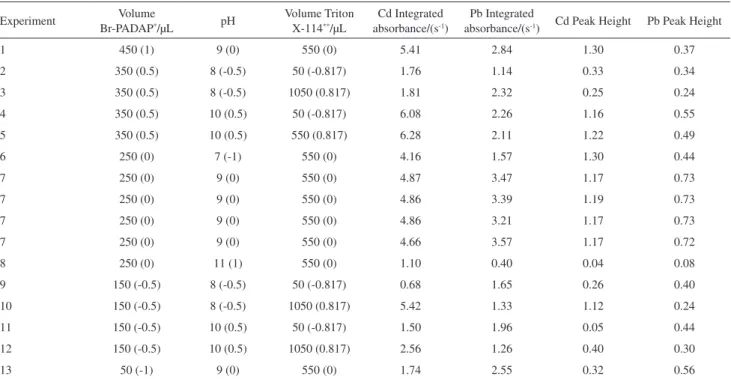
In the Doehlert design, variables pH, complexing agent, and surfactant volumes were optimized according to the coded and real values described in Table 1. This table also presents the integrated absorbance and peak height values for Cd and Pb metal ions. Figures 1 and 2 present the Cd and Pb surface responses, respectively, and the relationship between the pH and the Triton®
X-114 volume. The statistical program allowed plotting two-dimensional graphs. Maximum points were obtained for all surface responses, including those obtained with
Table 1. Doehlert design and integrated absorbance for Cd and Pb after CPE + TS-FF-AAS optimization procedure
Experiment Volume
Br-PADAP*/µL pH
Volume Triton X-114**/µL
Cd Integrated absorbance/(s-1)
Pb Integrated
absorbance/(s-1) Cd Peak Height Pb Peak Height
1 450 (1) 9 (0) 550 (0) 5.41 2.84 1.30 0.37
2 350 (0.5) 8 (-0.5) 50 (-0.817) 1.76 1.14 0.33 0.34
3 350 (0.5) 8 (-0.5) 1050 (0.817) 1.81 2.32 0.25 0.24
4 350 (0.5) 10 (0.5) 50 (-0.817) 6.08 2.26 1.16 0.55
5 350 (0.5) 10 (0.5) 550 (0.817) 6.28 2.11 1.22 0.49
6 250 (0) 7 (-1) 550 (0) 4.16 1.57 1.30 0.44
7 250 (0) 9 (0) 550 (0) 4.87 3.47 1.17 0.73
7 250 (0) 9 (0) 550 (0) 4.86 3.39 1.19 0.73
7 250 (0) 9 (0) 550 (0) 4.86 3.21 1.17 0.73
7 250 (0) 9 (0) 550 (0) 4.66 3.57 1.17 0.72
8 250 (0) 11 (1) 550 (0) 1.10 0.40 0.04 0.08
9 150 (-0.5) 8 (-0.5) 50 (-0.817) 0.68 1.65 0.26 0.40
10 150 (-0.5) 8 (-0.5) 1050 (0.817) 5.42 1.33 1.12 0.24
11 150 (-0.5) 10 (0.5) 50 (-0.817) 1.50 1.96 0.05 0.44
12 150 (-0.5) 10 (0.5) 1050 (0.817) 2.56 1.26 0.40 0.30
13 50 (-1) 9 (0) 550 (0) 1.74 2.55 0.32 0.56
Br-PADAD. Thus, the relationship between the pH and the Triton X-114 solution was chosen to demonstrate the results. Figures 1 and 2 illustrate the maximum points. The application of Lagrange’s criterion27 to each equation
gave the Cd and Pb critical values. For the optimized cloud point extraction procedure, it was used a volume of 245 µL of complexing agent solution (Br-PADAP), 765 µL of Triton® X-114 solution, and pH 9 for Cd, while
for Pb, 295 µL of Br-PADAP, 580 µL of Triton® X-114,
and pH 9 were used. These values were used considering the interactions of the three variables. These experimental conditions were applied in further experiments for determination of Cd and Pb in tobacco samples. The inal concentrations of the Br-PADAP solution were 1.8 × 10⁻² and 2.1 × 10⁻² mmol L-1, and for the Triton®
X-114 solution, 0.36 and 0.31% m/v, for Cd and Pb, respectively.
Analytical characteristics
Figures of merit for Cd and Pb measurements were obtained by TS-FF-AAS using the optimized experimental conditions. The results are presented in Table 2. The limits of detection (3 standard deviations of the blank/slope) and quantiication (10 standard deviations of the blank/slope) were determined from 10 blank readings. The Cd and Pb LOD´s found using CP preconcentration and TS-FF-AAS were 4.0 and 13 µg kg-1, respectively. The detectability
improvement factors for Cd and Pb were 62 and 158, respectively, when comparing the proposed method (CPE + TS-FF-AAS) with conventional FAAS. The
repeatability for Cd and Pb, 3.1 and 0.7%, respectively, was determined by successive measurements of the standard solutions (25 µg L-1). The linear dynamic range
varied from 0.08 to 25 µg L-1 for Cd, and from 0.26 to
250 µg L-1 for Pb.
Accuracy and recovery studies
To evaluate the accuracy of the developed procedure, Cd and Pb were determined in the two standard reference materials (Peach GBW08501 and Tea leaves-GBW08505). The results are presented in Table 3. No difference was observed for Cd and Pb in either sample by t-Student test at 95% conidence level, except for the Pb content in tea leaves, which was in agreement at 99% conidence level.
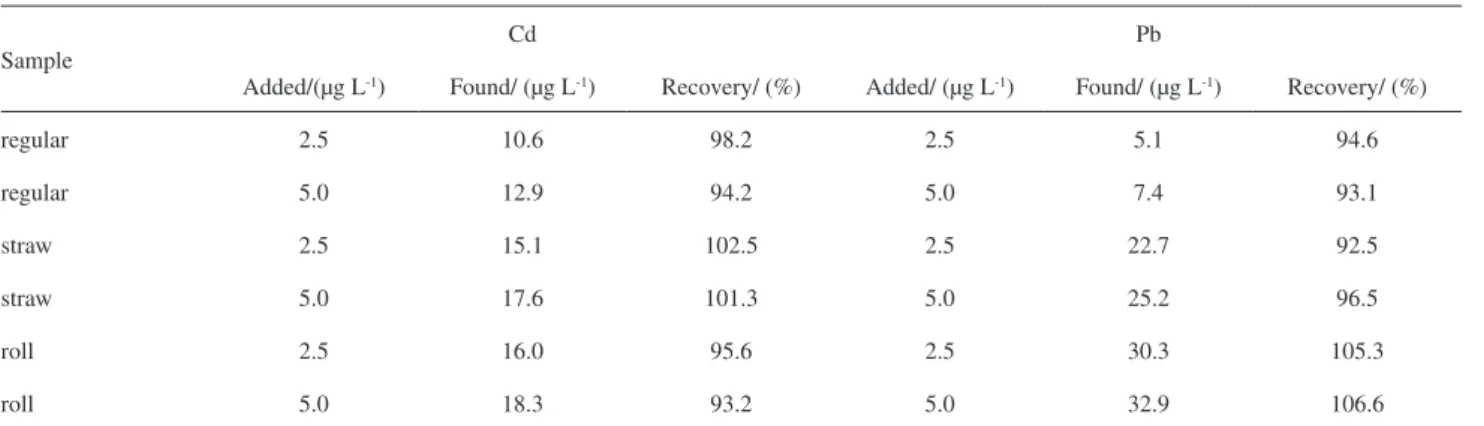
Recovery of Cd and Pb in different tobacco samples was evaluated in triplicate at two levels by adding 2.5 and 5.0 µg L-1 of both elements to commercial samples. The
results are given in Table 4. Recovery ranged from 93 to
Figure 1. Surface response for peak area integrated absorbance of Cd [pH vs. Vol TX (Triton® X-114)].
Figure 2. Surface response for peak area integrated absorbance of Pb [pH vs. Vol TX (Triton® X-114)].
Table 2. Analytical characteristics of the Cd and Pb measurements by TS-FF-AAS
Cd Pb
Linear dynamic range/(µg L-1) 0.08-25 0.26-250
Linear correlation coeficient 0.9985 0.9979
R.S.D./(%) 3.1 0.7
LOD/(µg kg-1) 4.0 13.0
LOQ/(µg kg-1) 14.0 41.0
107% for both analytes. No matrix effects were observed in the optimized procedure for the regular tobacco samples.
Determination of Cd and Pb in tobacco samples
After conventional acid digestion combining ash and wet digestion and optimized cloud point extraction using Br-PADAP as a complexing agent, commercial tobacco samples were analyzed using TS-FF-AAS. Cadmium and lead were not directly detected in tobacco acid digests by FAAS. Results are shown in Table 5. The samples named regular are common pack cigarettes bought at local shops, as previously mentioned. The found concentrations ranged from 0.148 to 0.380 µg g−1 for Cd, and from 0.568 to
3.51 µg g−1 for Pb. Regular HR cigarette presented the lowest
Cd value, while CPC straw cigarette gave the highest Pb value. The standard deviations obtained are suitable, taking into account the various steps of the proposed procedure. It can be seen in Table 5 that the standard deviations were higher for Cd and Pb at lower concentrations than those obtained for tobacco samples with the highest analyte concentrations. The Cd and Pb LOD’s obtained in this study were similar to literature values.17,21 Tarley et al.6
found a lower value for Cd employing TS-FF-AAS in combination with a minicolumn preconcentration system using multiwall carbon nanotubes. However, the method proposed here gave satisfactory results with good accuracy for the investigated samples.
Table 3. Cadmium and lead determinations in two standard reference materials by TS-FF-AAS (mean ± standard deviation, n = 4, P = 0.05)
Certiied values/(µg g-1) Obtained values/(µg g-1)
Cd Pb Cd Pb
Tea leaves- GBW08505 0.032 ± 0.005 1.06 ± 0.10 0.029 ± 0.002 1.45 ± 0.22*
Peach leaves- GBW08501 0.018 ± 0.008 0.99 ± 0.08 0.019 ± 0.009 1.23 ± 0.39
*P = 0.01.
Table 4. Recovery experiments for Cd and Pb in different tobacco samples (n = 3)
Sample
Cd Pb
Added/(µg L-1) Found/ (µg L-1) Recovery/ (%) Added/ (µg L-1) Found/ (µg L-1) Recovery/ (%)
regular 2.5 10.6 98.2 2.5 5.1 94.6
regular 5.0 12.9 94.2 5.0 7.4 93.1
straw 2.5 15.1 102.5 2.5 22.7 92.5
straw 5.0 17.6 101.3 5.0 25.2 96.5
roll 2.5 16.0 95.6 2.5 30.3 105.3
roll 5.0 18.3 93.2 5.0 32.9 106.6
Table 5. Determination of Cd and Pb in tobacco samples by TS-FF-AAS (mean ± standard deviation, n = 3)
Tobacco samples Cd/(µg g-1) Pb/(µg g-1)
DR regular 0.227 ± 0.060 0.740 ± 0.077
DG regular 0.313 ± 0.097 3.00 ± 0.04
HR regular 0.148 ± 0.036 3.00 ± 0.02
C regular 0.228 ± 0.012 3.07 ± 0.05
T regular 0.213 ± 0.028 2.99 ± 0.04
CPP straw 0.349 ± 0.005 0.568 ± 0.040
CPC straw 0.345 ± 0.069 3.51 ± 0.03
CPVJ straw 0.221 ± 0.009 3.11 ± 0.05
CPD straw 0.242 ± 0.063 3.08 ± 0.05
FRF roll 0.380 ± 0.020 0.769 ± 0.040
FRM roll 0.213 ± 0.032 3.06 ± 0.14
FRf roll 0.235 ± 0.027 3.14 ± 0.05
FRG roll 0.189 ± 0.022 2.94 ± 0.05
Conclusions
volumes. The association of TS-FF-AAS with cloud point preconcentration led to a gainabout 62-158-fold higher than that obtained by FAAS. The proposed procedure may be applicable to other elements present in low concentrations in tobacco samples and to quality control.
Acknowledgments
The authors are grateful to Pró-Reitoria de Pesquisa da Universidade Federal de Minas Gerais (PRPQ-UFMG) for the inancial support. F.P.A. is thankful for the fellowship provided by Coordenação de Aperfeiçoamento de Pessoal de Nível Superior (CAPES).
References
1. Petrucelli, G. A.; Poppi, R. J.; Mincato, R. L.; Pereira-Filho, E. R.; Talanta2007, 71, 620.
2. Borges, D. L. G.; Veiga, M. A. M. S.; Frescura, V. L. A.; Welz, B.; Curtis, A. J.; J. Anal. At. Spectrom.2003, 18, 501. 3. Bernhard, D.; Rossmann, A.; Wick, G.; IUBMB Life2005, 57,
805.
4. Wu, P.; Liu, R.; Berndt, H.; Lv, Y.; Hou, X.; J. Anal. At. Spectrom.2008, 23, 37.
5. Silva, M. F.; Cerutti, E. S.; Martinez, L. D.; Microchim. Acta 2006, 155, 349.
6. Tarley, C. R. T.; Barbosa, A. F.; Segatelli, M. G.; Figueiredo, E. C.; Luccas, P. O.; J. Anal. At. Spectrom.2006, 21, 1305. 7. Coelho, L. M.; Arruda, M. A. Z.; Spectrochim. Acta, Part B
2005, 60, 743.
8. Bezerra, M. A.; Arruda, M. A. Z.; Ferreira, S. L. C.; Appl. Spectrosc.Rev.2005, 40, 269.
9. Manzoori, J. L.; Abdolmohammad-Zadeh, H.; Amjadi, M.; Talanta2007, 71, 582.
10. Bezerra, M. A.; Bruns, R. E.; Ferreira, S. L. C.; Anal. Chim. Acta2006, 580, 251.
11. Gáspár, A.; Berndt, H.; Spectrochim. Acta Part B2000, 55, 587. 12. Wu, P.; Zhang, Y.; Lv, Y.; Hou, X.; Spectrochim. Acta, Part B
2006, 61, 1310.
13. Nascentes, C. C.; Arruda, M. A. Z.; Nogueira, A. R.; Nóbrega, J. A.; Talanta2004, 64, 912.
14. Davies, J.; Berndt, H.; Anal. Chim. Acta2003, 479, 215. 15. Gáspár, A.; Széles, E.; Berndt, H.; Anal. Bioanal. Chem.2002,
372, 136.
16. González, E.; Ahumada, R.; Medina, V.; Neira, J.; González, U.; Quim. Nova2004, 27, 873.
17. Rosini, F.; Nascentes, C. C.; Neira, J. Y.; Nóbrega, J. A.; Talanta 2007, 73, 845.
18. Pereira-Filho, E. R.; Berndt, H.; Arruda, M. A. Z.; J. Anal. At. Spectrom.2002, 17, 1308.
19. Nascentes, C. C.; Kamogawa, M. Y.; Fernandes, K. G.; Arruda, M. A. Z.; Nogueira, A. R. A.; Nóbrega, J. A.; Spectrochim. Acta, Part B 2005, 60, 749.
20. Donati, G. L.; Nascentes, C. C.; Nogueira, A. R. A.; Arruda, M. A. Z.; Nóbrega, J. A.; Microchem. J.2006, 82, 189. 21. Amorim, F. A. C.; Bezerra, M. A.; Microchim. Acta2007, 159,
183.
22. Ivanova, E.; Berndt, H.; Pulvermacher, E.; J. Anal. At. Spectrom. 2004, 19, 1507.
23. Manickum, C. K.; Verbeek, A. A.; J. Anal. At. Spectrom.1994, 19, 227.
24. Manzoori, J. L.; Karim-Nezhad, G.; Anal. Chim. Acta2004, 521, 173.
25. Teóilo, R. F.; Ferreira, M. M. C.; Quim. Nova2006, 29, 338. 26. Ferreira, S. L. C.; Santos, W. N. L.; Quintella, C. M.; Neto, B.
B.; Bosque-Sendra, J. M.; Talanta2004, 63, 1061.
27. Ferreira, S. L. C.; Santos, H. C.; Fernandes, M. S.; Carvalho, M. S.; J. Anal. At. Spectrom.2002, 17, 115.
28. Statistica for Windows, Statsoft: Tulsa, OK, 1999.
Received: September 28, 2008
![Figure 1. Surface response for peak area integrated absorbance of Cd [pH vs. Vol TX (Triton ® X-114)].](https://thumb-eu.123doks.com/thumbv2/123dok_br/18993079.461336/5.892.458.800.114.434/figure-surface-response-peak-area-integrated-absorbance-triton.webp)