Article
Printed in Brazil - ©2017 Sociedade Brasileira de Química0103 - 5053 $6.00+0.00*e-mail: [email protected]
An Automated Multicommuted Flow Analysis Procedure for Photometric
Determination of Reducing Sugars in Wine Employing a Directly Heated
Flow-Batch Device
Marcos A. S. Brasil and Boaventura F. Reis*
Centro de Energia Nuclear na Agricultura, Universidade de São Paulo, Av. Centenário, 303, São Dimas, 13400-970 Piracicaba-SP, Brazil
This work presents an automated analytical procedure for the photometric determination of reducing sugars in wines. The procedure is based on the reaction of reducing sugars with potassium hexacyanoferrate(III) in an alkaline medium, and was implemented employing a multicommuted flow analysis (MCFA) approach. Sample heating to promote the reaction was accomplished using a flow-batch device, which was heated to 50 °C without the use of a fluid for heat exchange. The ability of the MCFA approach to handle small solution volumes was exploited in order to develop an analytical procedure that meets green analytical chemistry guidelines. After optimizing the operational variables, the analytical procedure afforded a linear response ranging from 0.75 to 6.00% (m/v) fructose (R2 = 0.999), a limit of detection of 0.14% fructose (n = 11),
a 3.5% relative standard deviation, reagent consumption and waste generation of 112 mg and 2.2 mL per determination, respectively, and an analytical throughput of 75 determinations per hour.
Keywords: reducing sugar, multicommuted flow system, directly heated flow-batch device, green chemistry
Introduction
Determination of reducing sugars is common practice in wine production, where it is used to follow fermentation processes and verify wine conformity requirements.1,2
Determination of reducing sugar content prior to bottling can prevent re-fermentation, which negatively affects wine quality.3,4 Furthermore, the reducing sugar content is
also used to classify wines as dry, semi-sweet, or sweet.3,5
Reducing sugars are also determined in a number of other foods and beverages in order to ascertain product quality.6-9
Determination of reducing sugars in a variety of matrices is of great interest and has been accomplished by employing analytical procedures based on UV-Vis spectrophotometry,2,3,5-7,9,10 infrared spectroscopy,4 atomic
absorption spectrometry,8 potentiometry with ion-selective
electrodes,1 and biamperometry.11
UV-Vis spectrophotometry is by far the most commonly used technique for the determination of reducing sugars as it allows the implementation of analytical procedures using relatively simple equipment. Most reported spectrophotometric methods for determination of reducing
sugars are based on their reactions with copper(II)2,5,6 or with
hexacyanoferrate(III).10,12,13 According to Friedemann et al.,14
spectrophotometric methodologies for reducing sugar determination based on oxidizing reactions with copper(II) or hexacyanoferrate(III) were first proposed in 1849 and 1859, respectively. A survey of scientific literature shows that analytical procedures based on both methodologies have been published in the last two decades.2,5,6,10,12,13 This longevity
can be considered an indication of these methods having allowed the development of reliable analytical procedures.
In the first case, copper(II) is reduced to copper(I) by reducing sugars, allowing it to react with 2,9-dimethyl-1,10-phenanthroline (neocuproine), generating a colored complex.2,5,6 The neocuproine method was proposed at first
time by Brown and Boston15 in 1960 for the determination
of blood sugar and since has been used for the determination of reducing sugars in different matrices.
In the second case, the hexacyanoferrate(III) is reduced to hexacyanoferrate(II), and photometric detection may be performed based on its reaction with 1,10-phenanthroline to form a compound that may be monitored at 512 nm,12 its
reaction with ferric nitrate to produce Prussian Blue that can be detected at 590 nm,13 or by monitoring the decrease in the
It is worth mentioning that the neocuproine method was first proposed by M.E. Brown in 1960 and has since been used for the determination of reducing sugars in different matrices.
There are many reports of analytical procedures employing the flow analysis injection process,2,6-13 which
show as a common feature the requirement of a heated alkaline medium for the promotion of the oxidizing reaction. In these reports, the temperature range varied from 605,6,16 to 98 °C,11,12,17 except one extreme case in which
the temperature of the water bath was set at 110 °C.13 In
this case, the flow system manifold included long reaction coils (150 and 450 cm), followed by a cooling water bath (40 °C) and a debubbling device, considerably increasing the complexity of the flow system hardware.
After reaction with reducing sugars, the remaining hexacyanoferrate(III) in the reacting medium presents absorption at 420 nm, thus allowing its detection by spectrophotometry without the use of additional reagent solutions.10 This feature demonstrates an interesting
advantage, which is exploited in the current work for the development of an automated photometric method for the determination of reducing sugars in wine samples.
A number of reported analytical procedures have employed water baths at temperatures higher than 60 °C, leading to gas bubbles being delivered from the solution stream. When gas bubbles are pushed through a flow cell by the carrier stream, disturbances in the analytical signal can occur, thus impairing the precision of measurements. A number of methods have been adopted to overcome this problem, e.g., boiling all solutions in a water bath prior to use,2 cooling by coupling an ice bath to the flow system,7
the use of bubble-removing devices,11,12,16,17 and the use of
a closed vessel coupled to a tap water stream.10 In order
to assure analytical signal integrity, these devices were positioned into the flow system network before the input of the flow cell, thus decreasing the flexibility of the flow system.
Since heating the reaction medium is essential for the derivatization reaction to occur, the formation and delivery of gas bubbles is inevitable, presenting a drawback that must be overcome. The current analytical procedure has been developed to mitigate this drawback by employing a flow analysis system tolerant of gas bubbles. A multicommuted flow analysis module was designed based on the flow-batch approach.18-20 The flow-batch device was machined from a
stainless steel block, as described elsewhere.21 A heating
resistor, temperature sensor, and fiberglass waveguide cable were tightly embedded in the body of the flow-batch device in order to achieve a compact unit.
The photometric procedure for reducing sugar determination in wines presented here is performed using a
photometer constituted by a light emitting diode (LED) and a photodiode, which was coupled to the flow-bath device through fiberglass cables, allowing detection to be carried out without a solution cooling step.
Currently, there are concerns regarding the environmental sustainability of analytical procedures. Consequently, they should adhere to the requisites for clean methods as set out in the green analytical chemistry (GAC) guidelines.22,23
Considering that reagent consumption and waste generation are parameters that could unfavorably impact the sustainability of the proposed analytical procedure, the instrumental setup and the flow analysis manifold were designed to overcome these drawbacks.
Experimental
Reagents and solutions
All solutions were prepared with analytical grade reagents. Purified water with an electrical conductivity lower than 0.1 µS cm-1 was used throughout.
Fehling’s solution A was prepared by dissolving 34.6 g of copper sulfate pentahydrate (CuSO4.5H2O) (Merck, Germany)
in 500 mL water. Fehling’s solution B was prepared by dissolving 173.0 g of potassium sodium tartrate tetrahydrate (C4H4KNaO6.4H2O) (Merck, Germany) and 50.0 g of
sodium hydroxide (Merck, Germany) in 500 mL water. A 0.50% (m/v) glucose (C6H12O6) solution used for
Fehling’s solution standardization was prepared in water. Before use, an amount of glucose (Sigma, USA) was dried at 70 °C for 1 h. After cooling to 25 °C, the required mass was dissolved in 100 mL water.
A 1.8 mmol L-1 oxidizing reagent solution was prepared
by dissolving 296.4 mg of potassium hexacyanoferrate(III) (Mallinckrodt, USA) in 50 mL water. After dissolution, 50 mL of a 10 mol L-1 sodium hydroxide solution was
added, and the volume was made up to 500 mL with water. Fructose (C6H12O6) working standard solutions were
prepared by dissolving 0.37, 0.75, 1.50, 3.00, 4.50, and 6.00 g of the solid (Mallinckrodt, USA) in water. To these solutions were added 1.0 mL glycerol (C3H8O3)
and 12.0 mL ethanol (C2H6O) (Merck, Germany), and
the volumes were made up to 100 mL with water. These solutions were stored frozen and used for one week. Wine samples were purchased from a local market. The sparkling wines were sonicated prior to use.
Apparatus and accessories
temperature was assembled as described elsewhere.21 A
microcomputer was used to run the control software, which was written in the Visual Basic 6.0 programming language. A homemade peristaltic pump was fitted with facilities to be controlled by a computer, including sampling rate, pumping direction, and pulse synchronization,21 and furnished with
Tygon pumping tubes. A homemade LED-based photometer comprising a blue LED with maximum emission at 420 nm, an OPT301 photodiode (Texas Instruments), a LM35 temperature sensor (National Semiconductor), an OP07 operational amplifier, BC547 transistors, 78L08 and 79L08 electric potential regulators, capacitors, and resistors as shown in the diagram depicted in the Description of the setups section. A power supply (+12 V, −12 V) and a 0.5 A current intensity was used to power the photometer. A stabilized power supply (12 V) and a 2.0 A current intensity was used to power the solenoid valves. Three 161T031 three-way solenoid valves (NResearch), an aquarium pump, and four-way flow lines connecting the device machined in acrylic were used. An instrument controller device based on a PIC 18F4553 microcontroller (Microchip Technology Inc.) was assembled as described elsewhere.20 This device
coupled to a microcomputer through a serial interface was used to control the flow analysis module, perform data acquisition, and monitor the temperature of the flow-batch device. Flow lines and a mixing coil were of Teflon tubing (0.8 mm i.d.).
Description of the setups
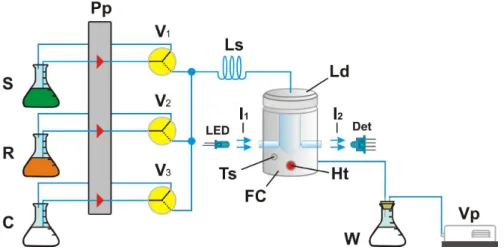
The flow system module designed based on the multicommuted approach in the standby condition (i.e., all solutions being pumped toward their storing vessels) is shown in Figure 1.
The photometer designed to be coupled with the flow-batch device is shown in Figure 2. When the control software is started, the microcomputer asks if a photometer calibration step is to be performed. If it is, the microcomputer sends control signals through the serial interface to run the peristaltic pump and to switch on the solenoid valve (V3) for 16 s, thus inserting 960 µL
of carrier fluid into the cavity of the flow-batch device. Then, the user is instructed to turn off the LED to perform the dark measurement (Dk). The signal generated by the photometer is converted to a digital signal by the microcontroller and sent to the microcomputer through the serial interface. After this step, the LED is activated by turning the variable resistor wired to the base of the transistor (Tr). The photometer readout (signal) has a linear relationship with the intensity of the radiation beam coming from the LED, and its value is adjusted to 2000 mV, which is denoted here as full scale measurement (Fs). The calibration step is performed 20 min after powering the photometer. The dark (Dk) and full scale (Fs) measurements are saved and used for absorbance calculations.
After the photometer calibration step has been completed, the flow system module is set to standby conditions by the microcontroller, as shown in Figure 1. The values of the control variables used in the last run are displayed on the screen of the microcomputer. These variables include the pumping flow rate, time intervals for switching on/off the solenoid valves used to load the sampling loop with sample and reagent solution aliquots, the number of replicates, flow-batch device temperature, and the time interval for the reaction development. The user can change the values of the variables at this time.
Figure 1. Diagram of the flow system. Pp = peristaltic pump; S, R and C = sample, oxidizing reagent solution and carrier fluid (NaOH), respectively; V1, V2 and V3 = three-way solenoid valves; Ls = sampling loop, 50 cm long and 0.8 mm inner diameter; FC = flow-batch device; LED = light emitting diode (λ = 420 nm); I1 = radiation beam emitted by the LED; I2 = radiation beam coming from the flow-batch devices ; Det = photometer; Ts = temperature
Procedure
The setup performs the analytical run following the sequence depicted in Table 1. The heating of the flow-batch device is the first step. The temperature sensor embed in the flow-batch device generates an electric potential difference that increases with temperature, presenting a linear relationship of 10 mV °C, which is stored in the control software running on the microcontroller device. The output of the temperature sensor (Ts) is coupled to the analog input of the microcontroller, thus the temperature of the flow-batch device can be continuously monitored. When the control software is started, a control signal is sent to power the heating resistor. The signal generated by the temperature sensor is converted to a digital by the microcontroller and sent to the microcomputer, which compares it with the preset value, and if it is equal, the software proceeds to step 2 and so on up to step 7. When the flow-batch device cavity is empty, the time interval required to attain a temperature of 50 °C is ca. 15 min.
The sampling step comprises a sequential on/off switching of solenoid valves V1 and V2 to insert slugs of
sample and reagent solutions into the sampling loop (L). This valve-switching sequence, denoted here as a sampling cycle, can be repeated several times to fill the sampling loop with a string of sample slugs in tandem with slugs of reducing reagent solution. Then, solenoid valve V3 is
switched on so that the carrier fluid (Cs) is diverted through the sampling loop, thus displacing the sample bolus from loop toward the flow-batch device (see Figure 1). The mixing of sample and reducing reagent solution aliquots occurs while the displacement proceeds.
While the reaction proceeds, the signal generated by the photometer is converted to a digital signal by the microcontroller and sent to the microcomputer. A plot of the signal is displayed on the computer screen as a function of time, thus allowing its visualization in real-time. When the time interval preset for the reaction is complete, the microcomputer performs the flow-batch device emptying step. If the preset number of replicates
Figure 2. Electronic diagram of the photometer. Tr1 = transistor BC547; LED = light emitting diode, λ = 420 nm; Fg = fiberglass cables, 50 cm long and 1.5 mm; Gc = glass cylinder, 20 mm long and 1.5 mm diameter; Cn = holder with Viton O-ring; Dn = cavity emptying channel; Det = OPT301 photodetector; OA = OP07 operational amplifier; Si = signal in mV.
Table 1. Analytical run sequence
Step Definition Pp / (µL s-1) V
1 V2 V3 FC / °C Vp time / s
1 heating device − 0 0 0 50 0 −
2 washing device 100 0 0 1 50 0 10
3 emptying device 0 0 0 0 50 1 4
4 sampling cyclea 30 1 0 0 50 0 0.1
30 0 1 0 50 0 2.2
5 displacing sample zone 80 0 0 1 50 0 10
6 reaction development/signal reading 0 0 0 0 50 0 15
7 emptying device 0 0 0 0 50 1 4
aSampling cycles define how many times valves V
has not yet been carried out, the process is returned to step 2 (Table 1).
To optimize the operational conditions for the analytical procedure, the following experimental variables were evaluated: volume of sample aliquot, reagent concentration, time required for reaction development, and temperature of the flow-batch device.
Results and Discussion
General comments
According to the literature, the reacting medium must be heated to promote the reaction of hexacyanoferrate(III) with reducing sugars, and for this purpose a wide temperature range (60 to 100 °C) has been employed. In the current work, a directly heated flow-batch device was employed for sample heating, as shown in Figure 1, which was machined from a stainless steel block. Its efficiency for heat transfer to the solution into the cavity of the flow-batch device was evaluated in a previous work,21 which reported that
1.0 mL of water inserted into the cavity attains equilibrium temperature in 30 s. Considering this information, no assay concerning its evaluation was performed.
As shown in Figure 1, a LED and photometer are coupled to the flow-batch device through fiberglass cables, and the device cavity works as a measurement cell, thus the cavity diameter is the optical path in which radiation absorption occurs. The sampling loop dimensions are maintained as depicted in the caption of Figure 1, while the volumes of the sample and hexacyanoferrate(III) solution slugs per sampling cycle are preset to 3 and 66 µL, respectively. This sampling pattern is used throughout.
Selection of radiation source
According to the literature,10 hexacyanoferrate(III)
absorbs light with a maximum wavelength at 420 nm. Therefore, the LED used as the light source in the homemade photometer must have a radiation emitting band with a maximum close to 420 nm. In order to select an appropriate radiation source, the absorbance spectrum of hexacyanoferrate(III) and the emission spectrum of the LED were compared, and are shown in Figure 3.
The hexacyanoferrate(III) absorbance spectrum overlaps the LED emission spectrum, and the emission and absorption maxima are similar. Based on these results, this LED was selected as the radiation source for the photometer.
During the photometer calibration, dark and full scale measurements are performed and used for absorbance
calculation. The data acquisition software was designed to calculate the absorption using the equation 1:
Absorbance = (Fs − Dk)/(Si − Dk) (1)
where Fs is the full-scale measurement, Dk is the dark measurement and Si is the actual signal generated by the photometer.
While the reducing reaction proceeds, the signal generated by the photometer (mV) is converted to a digital signal by the microcontroller and sent to the microcomputer, which calculates the absorbance and is saved as an ASCII file to allow further analysis.
Evaluation of the reagent concentration and volume of the sample zone
In order to optimize the concentration of the oxidizing reagent solution, a set of assays were performed using hexacyanoferrate(III) solutions with concentrations of 0.3, 0.9, and 1.8 mmol L-1 prepared in a 0.5 mol L-1 sodium
hydroxide solution and standard fructose solutions with concentrations of 0.0, 0.75, 1.50, 3.00, 4.50, and 6.00% (m/v). The temperature of the flow-batch device was set to 50 °C, and the sampling loop was loaded with sample and reagent solution slugs by applying the sampling cycles as defined in the Experimental section.
The linear regression curves derived from the maximum absorbance values of the fructose standard solutions and their parameters are summarized in Table 2. The measurements were based on the remaining hexacyanoferrate(III) contents in the cavity of the flow-batch device after reaction with reducing sugar, whereby its remaining concentration decreases with increasing analyte concentration. Consequently, the slopes of the analytical curves displayed in Table 1 are negative.
Analyzing the data in Table 2, the slope exhibits a 3-fold increase, indicating that the concentration of the hexacyanoferrate(III) solution exerts a significant effect on the sensitivity of the analytical procedure. However, there is no significant difference in the linearities of the curves. Based on these results, the 1.8 mmol L-1
hexacyanoferrate(III) solution was selected.
The assays used to evaluate the effect of the sample zone volume were performed using the same set of standard fructose solutions presented above. The number of sampling cycles was varied from three to seven, so the volume of the sample aliquot inserted into the cavity of the flow-batch device varied from 9.0 to 21.0 µL. An increase in signal magnitude of 50% is observed, while linearity is maintained. The determination of reducing sugars in wine samples usually requires sample dilution prior to analysis.10
Therefore, high sensitivity is not an essential requirement for this type of sample, which can be analyzed without a dilution step. A sample aliquot volume of 15.0 µL was selected, as the slope of the analytical curve is 30% higher than that achieved using a sample volume of 9.0 µL.
Evaluation of the effect of hydroxide concentration
According to the literature, the reaction of hexacyanoferrate(III) with reducing sugars occurs in alkaline medium,10,12,13 so the previous assays were
performed using a 0.5 mol L-1 hydroxide solution. In
order to evaluate the effect of alkalinity, a set of assays was performed using hexacyanoferrate(III) solutions (1.8 mmol L-1) prepared in 0.3, 0.5, and 1.0 mol L-1 sodium
hydroxide. The results show that the reaction rate increases with alkalinity, but the linearity of the results are similar, so the 0.5 mol L-1 sodium hydroxide solution was selected.
Evaluation of the effect of temperature
The results presented in the previous sections were achieved maintaining the temperature of the flow-batch device at 50 °C. Since temperature exerts an important role on the kinetics of hexacyanoferrate(III) reduction by reducing sugars, a set of assays was performed in order to
evaluate its effect. The temperature of the flow-batch device was set to 30, 40, 50, and 60 °C. The time interval for the signal reading step (Table 1) was set to 15 s. The assays were performed using standard fructose solutions with concentrations of 0.0, 0.75, 1.50, 3.00, 4.50, and 6.00% (m/v). The analytical curves derived using linear regression methodology present similar linearity (r ca. 0.999), while the slopes present values of −0.0267, −0.0381, −0.0530, and −0.0531 at 30, 40, 50, and 60 °C, respectively. Taking in account the fact that the slope is related to sensitivity, these results show that the temperature of the flow-batch device affects sensitivity up to 50 °C. This temperature is lower than those reported in the literature, i.e., between 60 and 98 °C.5,6,11,12,15,17 In the current work, sample aliquots are
inserted into the cavity of the flow-bath chamber device, so the heat transfer is direct from the metallic surface to the solution. Previous studies employed water baths, and the sample aliquots flowed through reaction coils immersed in hot water, thus the heat transfer to the sample bulk was less efficient than that in the current work. Based on these results, the temperature of 50 °C was selected.
Evaluation of potentials interfering
Ethanol and glycerol are found in wine samples at high concentration,24,25 so a set of assays was performed
to evaluate if these compounds cause interference in the proposed procedure for reducing sugar determination. Three sets of standard fructose solutions with concentrations of 0.75, 1.5, 3.0, 4.50, and 6.0% (m/v) were prepared; the first set without interfering components, the second in a medium containing 12% (v/v) ethanol, and the third in a medium containing 12% ethanol and 1% (v/v) glycerol.
The data shown in Table 3 indicate that there is no significant difference between the parameters for the curves for fructose alone and fructose with ethanol.
However, comparing the curve for fructose alone with that obtained with the mixture of fructose, ethanol, and glycerol, reveals a decrease in the slope of 14%, which could be considered as interference. Considering this result, fructose standard solutions were prepared in a medium containing ethanol (12%) and glycerol (1%) for the subsequent assays. The complete optimized operational conditions are summarized in Table 4.
Wine sample analysis and performance comparison
Once the experimental parameters had been optimized, the effectiveness of the proposed analytical procedure was evaluated by analyzing a set of wine samples using the experimental conditions summarized in Table 4. From the
Table 2. Evaluation of the hexacyanoferrate(III) concentration effect
Parameter Concentration / (mmol L
-1)
0.3 0.8 1.8
Slope −0.0122 −0.0239 −0.0401
Intercept 0.1281 0.1959 0.2878
measurement of a set of standard fructose solutions with concentrations of 0.37, 0.75, 1.50, 3.00, 4.50, and 6.00% (m/v), the following linear equation was derived:
Absorbance = −0.0400[C] + 0.2946 (R2 = 0.9991) (2)
where C = fructose concentration (%, m/v). This equation was used to calculate the reducing sugar concentration in the wine samples, which were analyzed employing the
current analytical procedure, yielding the results displayed in Table 5.
In order to assess the accuracy of the method, samples were also analyzed employing the Fehling method26 as a reference. Applying the paired t-test to
results for 95% confidence level and seven degrees of freedom, we obtained the value 0.17. The critical value for this condition is 2.36, thus the results of the proposed procedure present acceptable agreement with those of the reference method. The slope of this linear equation (−0.0400) is practically equal to those shown in Tables 2 and 3 achieved on different days, so the equipment designed and the proposed analytical procedure generate similar results over time. This feature could be considered as proof of the method robustness.
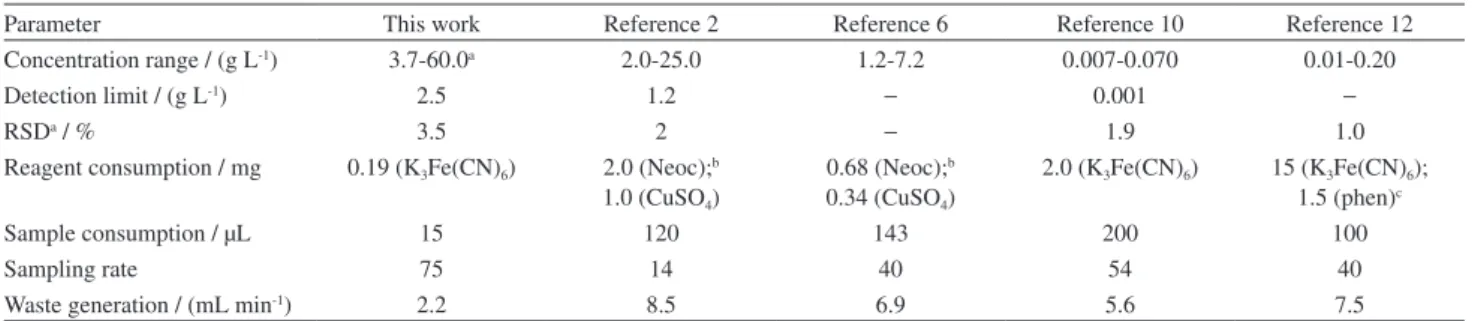
In order to compare the analytical performance of the proposed procedure for reducing sugar determination with that of other existing spectrophotometric procedures, the parameters usually employed for this purpose are presented in Table 6.
Table 4. Selected variables
Variable assayedRange Selected
Hexacyanoferrate(III) / (mmol L-1) 0.3-1.8 1.8
Sodium hydroxide / (mol L-1) 0.3-1.0 0.5
Temperature of flow-batch device / °C 30-60 50
Sample volume / µL 9-21 15
Reagent solution volume / µL 198-462 330
Table 3. Results of interference assays
Chemical specie Intercept Slope Linear coefficient (r2)
Fructose 0.298 −0.042 0.9978
Fructose + glycerol 0.283 −0.043 0.9997
Fructose + glycerol + ethanol 0.283 −0.037 0.9980
Table 5. Results comparison
Sample Proposed procedure / % (m/v) Reference method / % (m/v) Wine color
1 1.61 ± 0.04 1.58 ± 0.09 white
2 2.57 ± 0.05 2.56 ± 0.06 white
3 3.84 ± 0.11 3.69 ± 0.25 white
4 0.49 ± 0.04 0.49 ± 0.06 white
5 2.38 ± 0.04 2.36 ± 0.17 rose
6 2.92 ± 0.04 2.87 ± 0.29 rose
7 0.44 ± 0.07 0.43 ± 0.07 red
8 4.13 ± 0.05 4.35 ± 0.13 red
Table 6. Performance comparison with existing flow injection analysis procedures
Parameter This work Reference 2 Reference 6 Reference 10 Reference 12
Concentration range / (g L-1) 3.7-60.0a 2.0-25.0 1.2-7.2 0.007-0.070 0.01-0.20
Detection limit / (g L-1) 2.5 1.2 − 0.001 −
RSDa / % 3.5 2 − 1.9 1.0
Reagent consumption / mg 0.19 (K3Fe(CN)6) 2.0 (Neoc);b 1.0 (CuSO4)
0.68 (Neoc);b 0.34 (CuSO4)
2.0 (K3Fe(CN)6) 15 (K3Fe(CN)6); 1.5 (phen)c
Sample consumption / µL 15 120 143 200 100
Sampling rate 75 14 40 54 40
Waste generation / (mL min-1) 2.2 8.5 6.9 5.6 7.5
The standard solutions related to references ten and eleven are, respectively, 520 and 37 times more diluted than those of the proposed procedure. However, in the literature methods, the samples were diluted 50010 and 5011 times,
respectively, prior to analysis. The other two procedures also exploited sample diluting strategies, employing a dialysis unit coupled to the flow system manifold.
The current work was designed to be able to perform analysis of wine samples without prior dilution. The reagent consumption, sampling rate, and waste generation are favorable for the proposed procedure. These parameters play an important role in the effectiveness of the analytical procedure, since they impact the analysis cost and the environmental sustainability of the method.
Conclusions
The efficient heat exchange from the flow-batch device to the sample solution inside the cavity promoted the reaction development, thus allowing an analytical throughput higher than those of existing photometric procedures.2,6,10,12 The low reagent consumption and
reduced volume of generated waste allow us to conclude that the current analytical procedure meets green analytical chemistry guidelines.22,23
Acknowledgments
The authors acknowledge financial support from CNPq, CAPES, FAPESP, and INCTAA.
References
1. Lopes, T. I. M. S.; Rangel, A. O. S. S.; Lima, J. L. F. C.; Montenegro, M. C. B. S. M.; Anal. Chim. Acta 1995, 308, 122. 2. Araújo, A. N.; Lima, J. L. F. C.; Rangel, A. O. S. S.; Segundo,
M. A.; Talanta 2000, 52, 59.
3. Negrulescu, A.; Patrulea, V.; Mincea, M. M.; Ionascu, C.; Vlad-Oros, B. A.; Ostafe, V.; J. Braz. Chem. Soc. 2012, 23, 2176. 4. Novales, J. F.; López, M. I.; Sánchez, M. T.; Morales, J.;
Caballero, V. G.; Food Res. Int. 2009, 42, 285.
5. Baskan, K. S.; Tütem, E.; Akyüz, E.; Özen, S.; Apak, R.; Talanta
2016, 147, 162.
6. Tortajada, M. P.; Puchades, R.; Maquieira, A.; Food Chem.
1992, 43, 65.
7. Hartmann, P.; Haswell, S. J.; Grasserbauer, M.; Anal. Chim. Acta 1994, 285, 1.
8. Yebra, M. C.; Gallego, M.; Valcárcel, M.; Anal. Chim. Acta
1993, 276, 385.
9. Leotério, D. M. S.; Silva, P. A. B.; Souza, G. C. S.; Alves, A. A.; Belian, M. F.; Galembeck, A.; Lavorante, A. F.; Food Control
2015, 57, 225.
10. Oliveira, A. F.; Fatibello, O. F.; Nóbrega, J. A.; Talanta 2001, 55, 677.
11. Michalowski, J.; Kojlo, A.; Trojanowicz, M.; Szostek, B.; Zagatto, E. A. G.; Anal. Chim. Acta1993, 271, 239.
12. Mattos, I. L.; Zagatto, E. A. G.; Jacintho, A. O.; Anal. Chim. Acta 1988, 214, 247.
13. Liu, J. F.; Jiang, G. B.; Anal. Lett. 2001, 34:11, 1923. 14. Friedemann, T. E.; Weber, C. W.; Witt, N. F.; Anal. Biochem.
1962, 4, 358.
15. Brown, M. E.; Boston, M. S.; Diabetes 1961, 10, 60. 16. Tumang, C. A.; Tomazzini, M. C.; Reis, B. F.; Anal. Sci. 2003,
19, 1683.
17. Alves, E. R.; Fortes, P. R.; Borges, E. P.; Zagatto, E. A. G.; Anal. Chim. Acta 2006, 564, 231.
18. Freitas, S. K. B.; Silva, V. L.; Araújo, A. N.; Montenegro, M. C. B. S. M.; Reis, B. F.; Paim, A. P.; J. Braz. Chem. Soc. 2011, 22, 279.
19. Andrade, R. A. N.; Andrade, S. I. E.; Martins, V. L.; Moreira, P. N. T.; Costa, D. J. E.; Lyra, W. S.; Araújo, M. C. U.; Microchem. J. 2013, 108, 151.
20. Barreto, I. S.; Andrade, S. I. E.; Lima, M. B.; Silva, E. C.; Araújo, M. C. U.; Almeida, L. F.; Talanta 2012, 94, 111. 21. Brasil, M. A. S.; Reis, B. F.; Sens. Actuators, B 2016, 226, 570. 22. Armenta, S.; Garrigues, S.; de la Guardia, M.; Trends Anal.
Chem. 2008, 27, 497.
23. Melchert, W. R.; Reis, B. F.; Rocha, F. R. P.; Anal. Chim. Acta
2012, 714, 8.
24. h t t p : / / o p a c . i e f p . p t : 8 0 8 0 / i m a g e s / w i n l i b i m g . exe?key=&doc=42438&img=562, accessed in January 2017. 25. http://www.spq.pt/magazines/BSPQ/589/article/3000791/pdf,
accessed in January 2017.
26. Quisumbing, F. A.; Thomas, A. W.; J. Am. Chem. Soc. 1921, 43, 1503.
Submitted: January 18, 2017