Article
J. Braz. Chem. Soc., Vol. 22, No. 7, 1299-1306, 2011. Printed in Brazil - ©2011 Sociedade Brasileira de Química
0103 - 5053 $6.00+0.00
A
*e-mail: [email protected]
Electrochemical Degradation of the Dye Reactive Orange 16
using Electrochemical Flow-Cell
Luciano Gomes,a Douglas W. Miwa,a Geoffroy R. P. Malpassb and Artur J. Motheo*,a
aInstituto de Química de São Carlos, Universidade de São Paulo, CP 780,
13560-970 São Carlos-SP, Brazil
bCentro de Ciências Naturais e Humanas (CCNH), Universidade Federal do ABC,
09210-170 Santo André-SP, Brazil
As remoções eletroquímicas de cor e do conteúdo orgânico de soluções do corante laranja reativo16 (RO16) foram efetuadas usando uma célula em luxo e um eletrodo de trabalho de Pt. As inluências das variáveis do sistema, tais como luxo, concentração de NaCl, potencial aplicado e pH da solução, foram estudadas. A melhor remoção de cor foi de 93% (λ = 493 nm) após 60 min de eletrólise potentiostática a 2,2 V vs. ERH, usando 1,00 g L-1 NaCl como eletrólito
suporte. Os aumentos na concentração de NaCl e do potencial aumentam a velocidade de remoção de cor. A melhor remoção de carbono orgânico total (57%) foi obtida com a aplicação de 1,8 V, sem membrana de separação, indicando que as melhores condições para remoção de cor não são necessariamente as melhores para remover conteúdo orgânico. A eiciência de degradação diminui com a diminuição do pH da solução.
Electrochemical removals of color and organic load from solutions containing the dye reactive orange 16 (RO16) were performed in an electrochemical low-cell, using a platinum working electrode. The inluence of the process variables low-rate, such as NaCl concentration, applied potential and solution pH, were studied. The best color removal achieved was 93% (λ = 493 nm)
after 60 min at 2.2 V vs. RHE electrolysis, using 1.00 g L-1 NaCl as supporting electrolyte. The rises
in the concentration of NaCl and applied potential increased the color removal rate. The best total organic carbon removal (57%) was obtained at 1.8 V, without the separating membrane, indicating that the ideal conditions for the color removal are not necessarily the same as those to remove the total organic carbon. The degradation eficiency decreased with the solution pH decrease.
Keywords: decolorization, textile effluent, electrochemical degradation, reactive dye, Pt electrode
Introduction
When untreated textile efluents are discharged into receiving water bodies many environmental problems can occur. The principal problems are that the presence of dyes (even at concentrations of < 1 ppm) that can cause considerable coloration in water courses, affect transparency to natural light (reducing photosynthesis), reduce gas solubility and may also present carcinogenic and mutagenic properties.1,2
Wide varieties of dyes are used in the textile industry and can be classiied according to the manner in which
they are ixed to the textile iber (e.g., direct, reactive) or by their chemical structure (e.g., azo,anthraquinone). In the textile industry, reactive dyes are widely used due to their relatively easy application in the dyeing process and stability during wear. As a result of this stability, reactive dyes may require more complicated systems to achieve their removal from efluent lows. A number of methods presented in the literature are traditionally used to treat textile efluent and they are generally based on physical, chemical and biological treatments.3-5 Physical treatment
UV radiation,7 hydrogen peroxide,8 hypochlorite,9 Fenton’s
reagent10 and activated sludge11 amongst others.
Recently, there has been growing interest in the use of electrochemical techniques in the treatment of pollutants12
including textile dyes.13 Compared to the methods presented
above, electrochemical degradation processes present attractive advantages. These include the possibility that oxidizing agents (e.g., hydroxyl radicals, active chlorine) are electrochemically produced at the anode without the need, in many cases, to add further reagents.14,15 Additionally, the
unselective nature of the produced oxidizing agents makes the method applicable for a large range of pollutants.
In order to the electrochemical reaction occur at an acceptable rate, sometimes it is necessary to add salts, such as NaCl and Na2SO4 (so-called supporting electrolytes),
to the reaction mixture to increase conductivity. In the case of NaCl, the presence of Cl− in addition to increasing
conductivity also permits the electrochemical formation of free chlorine species, which can enhance the rate of pollutant removal.16 In addition, the physical space required
for an electrochemical system is less than that from other methods and in some cases, considering the pollutant, it can be used in tandem with traditional biological treatment processes or even replacing them.17 Another advantage of
the electrochemical process is that membranes can be used to separate the anodic and cathodic compartments of the electrochemical cell, enhancing the low of ions toward the electrodes, but restricting the reverse low minimizing the possibility of intermediate chemical reactions taking place. The aim of the present paper is to study the electrochemical color removal of the azo dye reactive orange 16 (RO16) that has two sulfonate groups with negative charges in aqueous solution Figure 1.18,19
This dye has attractive dying properties, especially for silk and cotton materials. However, it is highly resistant to conventional waste treatment methods.18,20 The present
study was performed in an electrochemical flow-cell, using as the working electrode pure platinum (Pt) plate. The influence of variables such as flow-rate, NaCl concentration, applied potential, membrane separation and pH were studied.
Experimental
Electrochemical reactor
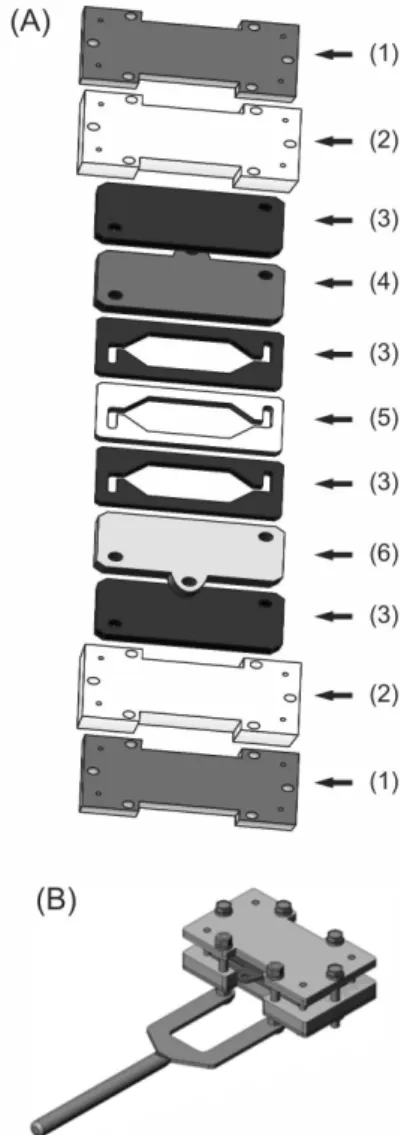
The color removal assays were performed in an electrochemical flow-cell, using the experimental set up illustrated in Figure 2 and previously described in the literature.21,22 The working electrode (WE) was a Pt
plate, (geometric area of 2 cm2) exposed to the solution.
A stainless steel plate of the same area was used as the counter electrode (CE). All potentials are referred to the reversible hydrogen electrode (RHE). An IONAC membrane23 (opened in the center) was introduced through
the cell, to promote the electrical contact between the electrolyte solution and the reference electrode,21 but did
not separate the electrodes. This membrane was immersed in a solution of 0.5 mol L-1 H
2SO4 in which the reference
electrode was placed. The distance between the CE and
Figure 1. Molecular structure of reactive orange 16 (RO16), which has the molecular formula C20H17N3O11S32Na and molecular weight of 617.53.
WE was controlled using Viton® and Telon® spacers. The
electrolyte low through the cell was 1.24 L h-1 and the dye
solution was pumped from the electrolyte reservoir through the cell using a peristaltic pump.
Electrochemical characterization
The voltammetric profiles of the electrodes were investigated to characterize the electrochemical processes that occur at the electrode/surface interface. Solutions of RO16 (35 mg L-1) were prepared by dissolving the dye in
aqueous solutions of 0.5 mol L-1 H
2SO4 and 0.25 to 1.00 g L -1
NaCl. Electrolyses were performed in solutions of 50 cm3 and
at two potentials, 1.8 and 2.2 V, and electrolyte samples were collected at different times during electrolysis (0, 15, 30, 45 and 60 min). All measurements were performed at 25 ± 2 °C.
UV-Vis spectroscopy
The extent of color removal was determined using UV-Vis spectroscopy (path length 1 cm, apparatus: Shimadzu Multispec 1501) by monitoring the band corresponding to the RO16 chromophore (λ = 493 nm). Total organic carbon
(TOC) was monitored using a TOC analyzer (TOC-VCPH,
Shimadzu). Proiles of these parameters were obtained by sampling solutions at predetermined time intervals during the degradation process.
Results and Discussion
Initially, the dye RO16 sample was characterized by UV-Visible spectroscopy (UV-Vis), as this technique can be applied to conjugated systems, where the molecular absorption in the ultraviolet and visible regions is dependent on the molecular electronic structure.24 Figure 3 presents
the UV-Vis spectrum of the dye RO16.
The dye presents four characteristic bands, which agree with values found in the literature.25,26 The band at 254 nm
is indicative of aromatic rings.27 A second band at 295 nm
can be attributed to the structure of gamma acetylated acid,27 that is a precursor for the synthesis of RO16. The
band 386 nm is probably related to the azo group. Finally, the band at 493 nm due to the chromophore7,27 is observed
and used to monitor the removal of color.
Cyclic voltammetry experiments
In order to understand the system from an electrochemical point of view, initial cyclic voltammetry (CV) experiments were performed. CV is a useful technique for probing the processes that occur at the electrode/solution interface.28
The measurement of the current that result as the potential is varied can provide valuable insight into the reactions that occur at the electrode surface. As mentioned in the experimental section, the material chosen as the working electrode for this study was platinum (Pt) as it represents a well characterized electrochemical system, which can be used as a comparison. Figure 4(A) presents the voltammetric proiles of the Pt electrode in H2SO4 (0.5 mol L
-1).
In the presence of H2SO4 (0.5 mol L
-1) it can be seen
that the voltammetric proile is comparable to the proile of Pt widely presented in the literature.29-31 The hydrogen
adsorption and desorption occurs between 0.05 and 0.4 V, the double layer area between 0.4 and 0.8 V, formation of PtOx, between 0.8 and 1.55 V and reduction 1.55 and 0.4 V
on the reverse sweep, respectively. 29-31
When NaCl is added to the electrolyte (see Figure 4(B)) a distinct modiication of the CV proile occurs. This is manifested by the suppression of the formation of PtOx,
PtOx reduction and H-adsorption/desorption, probably due
to the speciic adsorption of Cl− ions at the Pt surface.32 In
the presence of NaCl it is possible to observe an anodic process, which corresponds to the onset of Cl2 formation
and the cathodic reduction of adsorbed chloride species, on the reverse sweep.33
Figure 3. UV-Vis spectrum of RO16, as received, obtained between 220 and 600 nm.
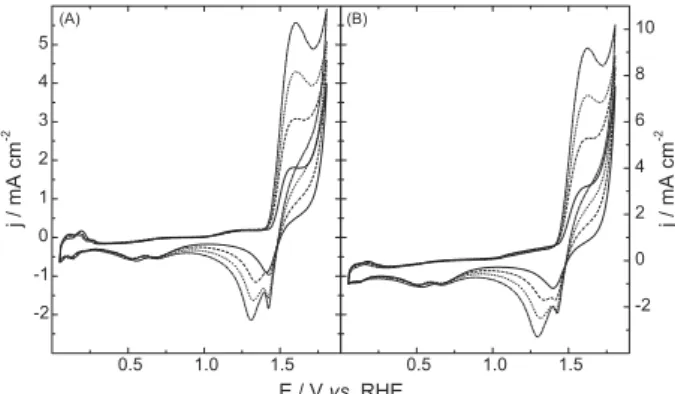
When the potential limits are extended to 1.8 V (Figure 5), in the presence of H2SO4 (0.5 mol L
-1)
no additional redox processes are observed up to approximately 1.6 V, where the oxygen evolution reaction commences. With the addition of NaCl, a distinct redox process can be observed at ca. 1.65 V (positive sweep) with an associated reduction peak (reverse sweep) at 1.37 V, attributable to the oxidation of Cl− to form Cl
2 (ca. 1.65 V)
and the subsequent reduction of Cl2 on the reverse sweep
(1.37 V). After this process, competition between the oxygen evolution and chlorine evolution occurs. When RO16 (solid line) is added, minimal variation in the voltammetric proile is observed, indicating that oxidation, if it occurs, takes place principally by the indirect action of species in solution, generated electrochemically at the electrode surface.
Electrolysis
As stated in the previous section, an anodic process was observed in the voltammogram at a potential of ca. 1.3 V. In order to investigate if it is possible to degrade the RO16 at this potential, constant potential (potentiostatic) electrolysis was performed in H2SO4 (0.5 mol L
-1). This would be
interesting as it would enable “selective” degradation of the dye at low potentials. However, it was observed that a maximum of only 7.8% of color was removed after 1 h of electrolysis and that corresponding TOC removal was insigniicant. Similar results were obtained in the presence of NaCl. This indicates that higher potentials (energy) that enter the region of O2 and Cl2 evolution are in fact
required to break down the dye molecule. In this light, it was decided to apply potentials of 1.8 and 2.2 V during electrolysis, with variation of parameters as low-rate, NaCl concentration and pH.
Effect of electrolyte low-rate
Firstly, it was decided to investigate the effect of low-rate. The low-rate is extremely important as careful tuning of the electrolyte transfer rate to the electrode surface can result in an improvement in the degradation performance. It is also interesting from a practical point of view as it indicates if the reactions occurring are either controlled by mass-transfer or by electron transfer.
In the present study, the low-rate was varied from 2.3 to 25 cm3 min-1 (Figure 6), using a ixed potential of 2.2 V
and 1.00 g L-1 NaCl in an undivided cell. This potential
was chosen as it enters the region of extensive O2 and Cl2
evolution. It was observed that the rate of color removal increases proportionally with increasing low-rate until a maximum of ca. 95% that is reached at 25 cm3 min-1
(inset Figure 6). Based on these results, the low-rate used in all experiments was 25 cm3 min-1.
Inluence of NaCl concentration and applied potential
Previous studies21,34 investigated the effect of varying the
NaCl concentration (0.25-1.00 g L-1) and have shown that the
NaCl concentration strongly inluences the rate of color and organic removal. In the present study, two different potentials were applied: 1.8 and 2.2 V in order to understand the effect of this variable on the rate of Cl2 production and subsequent
dye removal. In an electrochemical process, the pollutants can be destroyed by direct or indirect oxidation process.12 In the
direct process, the dye is adsorbed onto platinum electrode surface and is destroyed by direct electron transfer.35 In the
indirect process, the degradation occurs by the formation (at the electrode or in solution) of oxidizing species in situ, which then react with the organic species in solution.23
According to reactions 1-5 in the presence of NaCl both Cl2
and hypochlorite (ClO−) can be formed and subsequently result
in the degradation of the dye in solution:21,34,36
Figure 5. (A) Voltammetric proile of Pt in 0.5 mol L-1 H
2SO4 solution with different concentrations of NaCl: (---) 0.25, (....) 0.50, (-.-.-) 0.75 and (___) 1.00 g L-1 and (B) under the same conditions with addition of 35 mg L-1 of dye RO16, ν = 100 mV s-1.
Anode: 2Cl−→ Cl 2 + 2e
− (1)
Cathode: 2H2O + 2e−→ H2 + 2OH− (2)
Solution: Cl2 + 2OH−→ H
2O + ClO
− + Cl− (3)
HOCl → H+ + OCl− (4) Dye + OCl−→ intermediates → CO
2 + Cl − + H
2O (5)
Additionally, as discussed by previous authors,37,38
there is also the possibility that intermediates of oxygen evolution form oxychloro species that can mediate organic destruction (reactions 6 and 7):
MOx(OH) + Cl
−→ MO
x(HOCl) + e
− (6)
Dye + MOx(HOCl) → intermediates → MO x + CO2 +
Cl− + H
2O + H+ (7)
Indeed, it is probable that both the degradation paths (1-5) and (6-7) play simultaneous roles in the removal of the dye.37,38 The role of Cl− in producing an anodic shift
in (decreasing the activity towards) the oxygen evolution reaction may also be important.
The greater the concentration of NaCl, greater is the formation rate of Cl2/ClO−. The effect of NaCl concentration
on the level of color removal is presented in Figure 7. It can be seen that distinct behavior exists at the different potentials applied. At 1.8 V, there is limited color removal at NaCl concentrations of 0.25, 0.50 and 0.75 g L-1 and
signiicant levels (ca. 62%) are only obtained at 1.00 g L-1.
On the other hand, when the potential is increased to 2.2 V color removals up to 93% are obtained in less than 1 h of treatment.
Thus, in the absence of a separating membrane, it is observed that the best color removal was obtained using 1.00 g L-1 NaCl at 2.2 V, with 93% of color being removed.
At 1.8 V, the best removal was 61% using the same NaCl concentration. The color was removed obeying pseudo irst order kinetics and the values of the rate-constants (k) obtained are presented in Table 1.
In any energy-intensive process, a measure of the energy consumption is of vital importance. According to IUPAC guidelines, the eficiency of an electrically driven oxidation process can be expressed according to the kinetic model
that corresponds to the system under investigation.39 In this
study, as the color is removed obeying irst order kinetics, the energy per order (EEO) can be applied as the appropriate
igure of merit.39 The E
EO (kWh m
3 order-1) is deined as
the electrical energy (in kW h) required to bring about the degradation of a contaminant C by one order of magnitude in 1 m3 of contaminated water or air and is given by the
following equation:39
(1)
where P is the rated power (kW), t the time (h), V the treated volume (L) and Ci and Ct represent the initial concentration
and the concentration after a given time, t, respectively. The results of EEO for electrochemical degradation of RO16 are
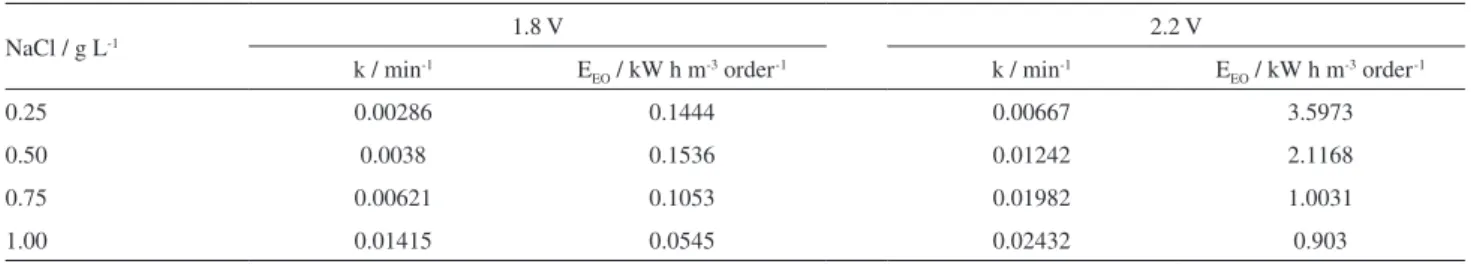
presented in Table 1 for degradation in an undivided cell. It is observed that with the increase of NaCl concentration, the operating cell potential is reduced and the energy consumption is lower, as described previously.21
However, the EEO values at 2.2 V are much greater than at
1.8 V, due to the greater applied potential and competition between O2 and Cl2 formation at the higher potential. It
should be noted that the EEO values presented in Table 1
are much lower than those previously obtained in this laboratory for real textile effluent,21,40 indicating the
complex nature of the treatment required when change is made from simulated to real efluents.
Figure 7. Effect of NaCl concentration on the color removal using potential of (A) 1.8 and (B) 2.2 V with NaCl concentrations of (q) 0.25, () 0.50, () 0.75 and () 1.00 g L-1, without membrane.
Table 1. Values of irst order rate constant (k) and energy per order (EEO) at 1.8 and 2.2 V for an undivided cell
NaCl / g L-1 1.8 V 2.2 V
k / min-1 E
EO / kW h m-3 order-1 k / min-1 EEO / kW h m-3 order-1
0.25 0.00286 0.1444 0.00667 3.5973
0.50 0.0038 0.1536 0.01242 2.1168
0.75 0.00621 0.1053 0.01982 1.0031
After establishing that up to 93% of color can be removed at 2.2 V, it was decided to investigate the effect of separating the cell with a membrane. The objective of using the membrane to separate the low-cell was to verify the inluence in the formation of hypochlorite (ClO−),
which is formed after the reaction of anodically formed Cl2 and cathodically formed HO− (reactions 1-4). With cell
separation, the formation of OCl− should decrease as the
crossover of the species will be limited and this may affect the degradation process.
Figure 8 presents the extent of color removal using a separating membrane. Comparing with the obtained results without the membrane it can be seen that there is a decrease of 17.6% in the color removal at 1.8 V and 13% at 2.2 V. Again, it is observed that the best color removal was obtained at 2.2 V. These results indicate that the use of a membrane is capable of reducing the formation of ClO− as
seen in previous papers.41 The E
EO values with and without
the membrane are given in Figure 9.
Total organic carbon (TOC) is a very important parameter applied to wastewater pollution analyses.42 For
the degradation of RO16 TOC removal was analyzed as function of potential applied, NaCl concentrations and use of a membrane. The results are presented in Figure 10.
It is observed that the best TOC removal (57%) was obtained at the potential of 1.8 V, without the separating membrane. If only the color removal is analyzed, the best parameter for RO16 degradation will be 2.2 V without the separating membrane. But with TOC results, it is clearly observed that when a greater potential is applied, the color removal is faster, however the totaldegradation of RO16 was reduced. It was also observed that at 1.8 V, with and without membrane, the EEO was lower, compared to 2.2 V.
According to other authors,37,38 the presence of Cl− in
solution can shift the oxygen evolution (OER) reaction to more positive potentials, which basically can be interpreted as an inhibition of the process. Thus, at 1.8 V, the degradation of the dye is probably due to the combination of reactions 1-7. On the other hand, at 2.2 V there is probably greater completion between the OER and dye removal through reactions 1-7.
pH effect
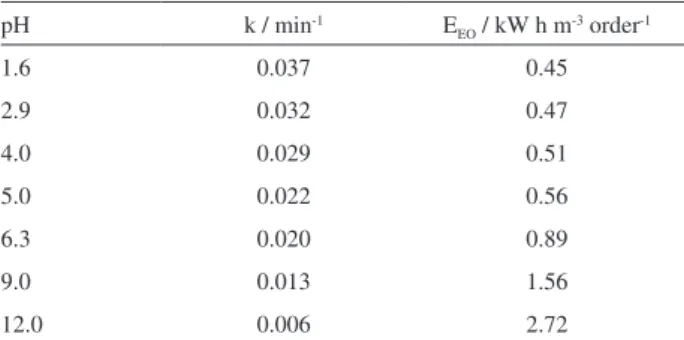
After studying the cell parameters (low-rate, NaCl concentration, applied potential and cell separation), the inluence of pH on the color removal, energy per order and kinetics was analyzed. From Figure 11, it can be observed that the color removal decreases as the pH decreases. The best color removal occurs at a pH of 1.6, being approximately 94%. However when the pH value was changed to pH 6.3, the color removal decreased to 63%. At pH > 7, color removal is lower, reaching only 27% at pH 12. Consequently, the rate constants and energy per order are also observed to be less favorable at higher pH values. Table 2 gives the values of the rate-constants and EEO for different pHs.
Figure 8. Color removal using 1.00 g L-1 NaCl added to a 0.5 mol L-1 H2SO4 solution with 35 mg L-1 f RO16, at 1.8 V () with and () without membrane and second at 2.2 V (q) with and (r) without membrane.
Figure 9. Energy per order of degradation of RO16 using different NaCl concentrations in H2SO4 medium (0.5 mol L-1) at 1.8 V () without and () with membrane and at 2.2 V (q) without and (r) with membrane.
Figure 10. TOC removal using different NaCl concentrations in 0.5 mol L-1 H
It is observed that with the increase of NaCl concentration, the operating cell potential is reduced and the energy consumption is lower, as described in the work of Malpass et al.21 The E
EO values at 2.2 V are much greater
than at 1.8 V, because it presents a higher degree of oxygen and chlorine evolution, which increase the current and consequently increase the EEO values.
In the present study the formation of organochlorine by-products was not performed. However, previous studies indicate that during electrochemical degradation such intermediates are also removed during the degradation process.43-45
Conclusions
The present study demonstrates that is possible to degrade a commercial dye using a Pt electrode. The addition of NaCl is very important due to the in situ
formation of active chlorine species, which are strong oxidizing agents. The color removal is considered an important parameter in textile dye degradation, however in this work TOC results indicate that the best conditions for color removal are not the best for total degradation. It is our hope that this study can be used as a reference for future studies of new electrodes, comparing the
parameters of eficiencies between electrodes of different metals, such as DSA®,45 boron-doped diamond (BDD),
amongst others.
Acknowledgements
The authors gratefully acknowledge the financial support from FAPESP (Fundação de Amparo à Pesquisa do Estado de São Paulo) and CNPq (Conselho Nacional de Desenvolvimento Cientíico e Tecnológico), Brazil.
References
1. Carneiro, P. A.; Osugi, M. E.; Fugivara, C. S.; Boralle, N.; Furlan, M.; Zanoni, M. V. B.; Chemosphere 2005, 59, 431. 2. Meric, S.; Kaptan, D.; Olmez, T.; Chemosphere 2004, 54, 435. 3. Isik, M.; Enzyme Microb. Technol. 2004, 35, 399.
4. Libra, J. A.; Borchert, M.; Vigelahn, L.; Storm, T.; Chemosphere
2004, 56, 167.
5. Ong, S. A.; Toorisaka, E.; Hirata, M.; Hano, T.; Sep. Purif. Technol. 2005, 42, 297.
6. Gutowska, A.; Kaluzna-Czaplinska, J.; Jozwiak, W. K.; Dyes Pigm. 2007, 74, 41.
7. Bilgi, S.; Demir, C.; Dyes Pigm. 2005, 66, 69.
8. Baldrian, P.; Merhautova, V.; Gabriel, J.; Nerud, F.; Stopka, P.; Hruby, M.; Benes, M. J.; Appl. Catal., B 2006, 66, 258. 9. Bredereck, K.; Schumacher, C.; Dyes Pigm. 1993, 21, 45. 10. Kusic, H.; Koprivanac, N.; Srsan, L.; J. Photochem. Photobiol., A
2006, 181, 195.
11. Arslan-Alaton, W.; Eremektar, G.; Babuna, F. G.; Selcuk, H.; Orhon, D.; Fresenius Environ. Bull. 2004, 13, 1040.
12. Martinez-Huitle, C. A.; Ferro, S.; Chem. Soc. Rev. 2006, 35, 1324.
13. Martínez-Huitle, C. A.; Brillas, E.; Appl. Catal., B 2009, 87, 105.
14. Troster, I.; Fryda, M.; Herrmann, D.; Schafer, L.; Hanni, W.; Perret, A.; Blaschke, M.; Kraft, A.; Stadelmann, M.; Diamond Relat. Mater. 2002, 11, 640.
15. Kraft, A.; Stadelmann, M.; Blaschke, M.; J. Hazard. Mater.
2003, 103, 247.
16. Chen, G. H.; Sep. Purif. Technol. 2004, 38, 11.
17. Juttner, K.; Galla, U.; Schmieder, H.; Electrochim. Acta 2000, 45, 2575.
18. Andrade, L. S.; Tasso, T. T.; da Silva, D. L.; Rocha-Filho, R. C.; Bocchi, N.; Biaggio, S. R.; Electrochim. Acta 2009, 54, 2024. 19. Won, S. W.; Choi, S. B.; Yun, Y. S.; Biochem. Eng. J. 2006, 28,
208.
20. Carneiro, P. A.; Osugi, M. E.; Sene, J. J.; Anderson, M. A.; Zanoni, M. V. B.; Electrochim. Acta 2004, 49, 3807.
21. Malpass, G. R. P.; Miwa, D. W.; Mortari, D. A.; Machado, S. A. S.; Motheo, A. J.; Water Res. 2007, 41, 2969.
Figure 11. Color removal from a 1.00 g L-1 NaCl solution as function of pH at () 1.8 and () 2.2 V for an undivided cell.
Table 2. Values of irst order rate constant (k) and energy per order (EEO) as a function of pH
pH k / min-1 E
EO / kW h m-3 order-1
1.6 0.037 0.45
2.9 0.032 0.47
4.0 0.029 0.51
5.0 0.022 0.56
6.3 0.020 0.89
9.0 0.013 1.56
22. Malpass, G. R. P.; Motheo, A. J.; J. Appl. Electrochem. 2001, 31, 1351.
23. Motheo, A. J.; Gonzalez, E. R.; Tremiliosi, G.; Olivi, P.; de Andrade, A. R.; Kokoh, B.; Leger, J. M.; Belgsir, E. M.; Lamy, C.; J. Braz. Chem. Soc. 2000, 11, 16.
24. Silverstein, R. M.; Bassler, G. C.; Morril, T. C.; Spectrometric Identiication of Organic Compounds, John Wiley & Sons: New
York, 1991.
25. Catanho, M.; Malpass, G. R. P.; Motheo, A. J.; Appl. Catal., B
2006, 62, 193.
26. Gomes, L.; Freitas, R. G.; Malpass, G. R. P.; Pereira, E. C.; J. Appl. Electrochem. 2009, 39, 117.
27. Catanho, M.; Malpass, G. R. P.; Motheo, A. J.; Quim. Nova.
2006, 29, 983.
28. Mabbott, G. A.; J. Chem. Educ. 1983, 60, 697.
29. Jerkiewicz, G.; Vatankhah, G.; Lessard, J.; Soriaga, M. P.; Park, Y. S.; Electrochim. Acta 2004, 49, 1451.
30. Bard, A. J.; Faulkner, L. R.; Electrochemical Methods: Fundamentals and Applications, 2nd ed.; John Wiley & Sons,
Inc.: New York, 2001.
31. Conway, B. E.; Prog. Surf. Sci. 1995, 49, 331.
32. Arikado, T.; Iwakura, C.; Tamura, H.; Electrochim. Acta 1977, 22, 229.
33. Kodera, F.; Umeda, M.; Yamada, A.; Anal. Chim. Acta 2005, 537, 293.
34. Miwa, D. W.; Malpass, G. R. P.; Machado, S. A. S.; Motheo, A. J.; Water Res. 2006, 40, 3281.
35. Rajkumar, D.; Palanivelu, K.; J. Hazard. Mater. 2004, 113, 123.
36. Mohan, N.; Balasubramanian, N.; Subramanian, V.; Chem. Eng. Technol. 2001, 24, 749.
37. Martinez-Huitle, C. A.; Ferro, S.; De Battisti, A.; Electrochem. Solid-State Lett. 2005, 8, D35.
38. Scialdone, O.; Randazzo, S.; Galia, A.; Silvestri, G.; Water Res.
2009, 43, 2260.
39. Bolton, J. R.; Bircher, K. G.; Tumas, W.; Tolman, C. A.; Pure Appl. Chem. 2001, 73, 627.
40. Malpass, G. R. P.; Miwa, D. W.; Machado, S. A. S.; Motheo, A. J.; J. Hazard. Mater. 2008, 156, 170.
41. Barbosa, C. P.; Malpass, G. R. P.; Miwa, D. W.; Gomes, L.; Bertazzoli, R.; Motheo, A. J.; J. Braz. Chem. Soc. 2010, 21, 651.
42. Thomas, O.; El Khorassani, H.; Touraud, E.; Bitar, H.; Talanta
1999, 50, 743.
43. Rajkumar, D.; Kim, J. G.; Palanivelu, K.; Chem. Eng. Technol.
2005, 28, 98.
44. Kokoh, K. B.; Hahn, F.; Belgsir, E. M.; Lamy, C.; de Andrade, A. R.; Olivi, P.; Motheo, A. J.; Tremiliosi-Filho, G.; Electrochim. Acta 2004, 49, 2077.
45. Malpass, G. R. P.; Neves, R. S.; Motheo, A. J.; Electrochim. Acta 2006, 52, 936.
Submitted: December 15, 2010
Published online: March 15, 2011