Longitudinal study of mandibular behavior in Class I subjects
with vertical and horizontal growth
Dirceu Barnabé Raveli1, Savana Maia2, Luana Paz Sampaio3, Denise Rocha Goes Landázuri4, Taísa Boamorte Raveli5
Objective: To evaluate possible differences in mandibular behavior in Class I individuals with vertical and horizontal growth patterns. Methods: The sample consisted of 20 untreated Class I individuals divided into: Group 1 comprising 10 individuals with vertical growth pattern and Group 2 comprising 10 individuals with horizontal growth pattern, all of them belonging to the Burlington Growth Center files, University of Toronto-Canada, radiographically followed-up at ages 9, 12 and 21. Cephalometric radiographs, determined mean values for a long-term evaluation of mandibular behavior using the
following measurements: SNB, Co-GN, SN.GoMe, anterior facial height and posterior facial height. Results: SNB and
Co-Gn values were higher in horizontal growth group at all of the ages studied; SN.GoMe measure was significantly lower in horizontal growth group; anterior facial height (AFH) showed lower values in individuals with horizontal growth pattern; and posterior facial height (PFH) showed lower values in individuals with vertical growth pattern. Conclusion: Long-term comparisons of Class I individuals’ growth tendencies indicate that there are significant differences between both groups. Mandible showed a trend to clockwise rotation in Group 1. Group 2 showed a trend to brachycephalic facial form, due to the deficit in vertical development with regard to anterior facial height.
Keywords: Growth and development. Angle Class I malocclusion. Mandible.
How to cite this article: Raveli DB, Maia S, Sampaio LP, Landázuri DRG, Raveli TB. A longitudinal study of mandible behavior in Class I individual with vertical and hori-zontal growth. Dental Press J Orthod. 2012 Nov-Dec;17(6):25.e1-7.
Submitted: October 15, 2008 - Revised and accepted: August 30, 2012
Contact address: Dirceu Barnabé Raveli
Rua: Humaitá, 1680 - Centro - Cep: 14801-903 - Araraquara/SP – Brazil E-mail: [email protected]
1 Associate Professor of Orthodontics, FOAr/UNESP. 2 Professor, Amazonas State University.
3 PhD in Orthodontics, UNESP/Araraquara. Professor, Specialization Course in
Orthodontics, FAMOSP/GESTOS - Araraquara.
4 PhD Student, FOAr/UNESP.
5 MSc in Orthodontics, UNESP/Araraquara. Professor, Specialization Course in
Orthodontics, FAMOSP/GESTOS - Araraquara.
» The author reports no commercial, proprietary or financial interest in the products or companies described in this article.
Objetivo: avaliar as possíveis diferenças no comportamento mandibular em indivíduos Classe I com crescimento vertical e horizontal. Métodos: a amostra desse estudo consistiu de 20 indivíduos Classe I não tratados, sendo o grupo 1 composto por 10 indivíduos com padrão de crescimento vertical e o grupo 2 por 10 indivíduos com padrão de crescimento horizontal, perten-centes aos arquivos do Burlington Growth Center, University of Toronto, no Canadá, acompanhados radiograficamente nas idade de 9, 12 e 21 anos. Determinou-se, por meio de telerradiografias cefalométricas, em norma lateral, os valores médios para a avaliação longitudinal do comportamento da mandíbula utilizando as medidas SNB, Co-Gn, SN.GoMe, altura facial anterior e altura facial posterior. Resultados: o valor de SNB e Co-Gn foram maiores no grupo com crescimento horizontal em todas as idades. A medida Sn.GoMe foi significativamente menor no grupo com crescimento horizontal, a altura facial anterior (AFH) apresentou valores menores nos indivíduos com padrão de crescimento horizontal, e a altura facial posterior (PFH) apresen-tou valores menores nos indivíduos com crescimento vertical. Conclusão: as comparações longitudinais das tendências de crescimento de indivíduos Classe I indicam que existe diferenças significativas entre os dois grupos. A mandíbula apresentou tendência à rotação horária no grupo 1. O grupo 2 exibiu tendência à característica de indivíduos braquicefálicos, na forma facial, devido ao déficit no desenvolvimento vertical na altura facial anterior.
INTRODUCTION AND LITERATURE REVIEW Aiming a safe and correct orientation of the treatment plan for correction of malocclusions, it is necessary to know the pathological and physiologi-cal development pattern, on other words, to know the morphological characteristics of Angle’s Class I, II and III malocclusions. Sagittal and vertical devel-opment of the mandible can be analyzed in longitu-dinal growth study in samples of untreated Class I individuals.
The craniofacial growth studies of subjects with malocclusion, orthodonticatlly untreated, are im-portant for the assessment of the effects induced by mechanotherapy, since the growth of these in-dividuals is extremely variable, difficult to predict and different when compared to the growth of in-dividuals with normal occlusion, thus complicating the interpretation of the effects of mechanotherapy
during growth.28
Ngan et al21 conducted a comparative
longitudi-nal study of skeletal changes of subjects with Class I and Class II malocclusion Division 1. It was used a sample of 40 individuals (20 Class I and 20 Class II) ranging from 7 to 14 years. The changes observed in Class II individuals, compared to Class I, are de-scribed as follows: The mandible (SNB and SNPog) was significantly more retruded, measures such as (Ar-NG) and (Go-Gn) were found reduced, the Y axis and mandibular plane angle increased, in order to contribute to the retruded position of the man-dible in these individuals.
Buschang and Martins7 observed the
anterior-posterior and vertical skeletal development relation-ship of mandible of Class I and II individuals from 6 to 15 years. The results showed that the vertical and anterior-posterior relationship are not stable during growth and vary according to age, gender and type of malocclusion.
Chung et al9 analyzed the skeletal and dental
morphology of 85 Class II untreated patients, from 9 to 18 years , from the records of Bolton-Brush and Burlington Growth Center. It was investigated the craniofacial growth of those individuals. It was ob-served a decrease in the mandibular plane angle in all groups and counterclockwise rotation of the dible, however individuals who had decreased man-dibular angle had a greater rotation.
Thilander et al27 conducted a longitudinal study
with subjects from 5 to 31 year-old in Swedish popu-lation. The sample was composed of cephalometric radiographs of 469 subjects with normal occlusion orthodontically treated. The results showed that the mandibular length increased in male subjects ; mandibular growth spurt occurred between 13 and 16 years of age. They observed continuous decrease of goniac angle and, consequently, mandibular coun-terclockwise rotation and the SNB angle increased continuously during the observation period (77 to 81 degrees) in these individuals.
Previous studies shown that sagittal facial growth consists of vertical growth (base) and horizontal growth (front). If the vertical growth of facial sutures and alveolar process is greater than the growth of the condyle, the mandible turns back (clockwise direc-tion), resulting in greater anterior facial height. On the other hand, if vertical growth of the condyle is larger than the sum of the components of vertical growth of facial sutures and alveolar process, the mandible turns to front (counterclockwise). The final growth vector is the result of the competition between horizontal and vertical growth. Longitudinal studies on growth may help answer some clinical questions: What changes might occur in the mandible during growth? Can the clinician detect during growth different directions of mandibular growth in Class I individuals?5,15,18
In the literature, studies concerning the de-velopment of Class II malocclusion are more fre-quent.1,2,4,6,7,8,11,16,17 However, the literature shows that the morphological characteristics of malocclusions are still controversial and debated. Longitudinal stud-ies of growth evaluating the development of Class
I,4,12,27 in horizontal and vertical patterns are scarce.
MATERIAL AND METHODS
The sample comprised of 60 radiographs from the
Burlington Growth Centre, University of Toronto,
Canada,based on longitudinal records of 20 Class I individuals orthodontically untreated followed up at ages 9, 12 and 21 years, being 10 individuals with ver-tical growth pattern and 10 horizontal .
In this longitudinal study, Group 1 with Class I malocclusion, vertical growth pattern (n = 10; 5 male and 5 female) was compared with Group 2, comprised of Class I malocclusion with horizontal growth pattern (n = 10; 5 male and 5 female). The sample was divided into 2 groups (vertical and
hori-zontal), based on cephalometric measures in T1: SNA,
SNB, ANB, SN.GoMe, NAP.25,26 Normal values of these
measures for initial age of 9 years were described
by Riedel,23 SNA = 80.79, SNB = 78.02, ANB = 2.77,
SN.GoMe = 32.27, NAP = 4.22, values above or below the standard deviation of each measure characterize individuals with vertical or sagittal growth tendency, allowing the formation of two groups in this study.
The individuals were included according to the following criteria: 1) present cephalometric radiogra-phy from 9 to 21 years of age, 2) Class I malocclusion (ANB ≤ 4° and >0° determined in T1 at 9 years 23 3) Be healthy and without history of orthodontic treatment.
The sample belonging to the files of University of Toronto, Burlington Growth Centre Department was
documented in the period 1952 to 1971. This material is the most extensive longitudinal study of craniofa-cial growth held up today. All the radiographs were made in the same X-ray machine with magnification of 9.84%, with a constant focus / object distance and fixed in 152.4 cm and the chassis was positioned at a distance of 15 cm in the midsagittal plane of the
indi-viduals.22 In this study, 60 cephalometric tracings of
the profile were conducted by the same operator, us-ing 0.3 mm mechanical pencil with Ultraphan paper in negatoscope, in a dark room, framed with black cardboard, exposing the corresponding areas to ana-tomical drawing.
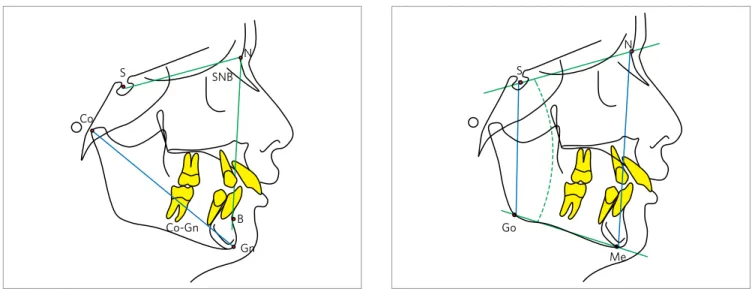
The points were then entered into a Numonics AccuGrid digitizing table and evaluated in computer by means of Dentofacial Planner Plus 2.01 software. Cephalometric analysis was composed by angular and linear measures (Figs 1 and 2), obtained through the program of computerized cephalometrics DFPlus. The mandibular behavior was examined at intervals of ages with reference to the lateral cephalograms.
To differentiate horizontal or vertical mandibular development component, the following linear and an-gular measures were used: SNB and Co-Gn, for analy-sis of horizontal position of the mandible (Fig 1). The vertical position was analyzed by means of the follow-ing measures (Fig 2): SN.GoMe angle, N-Me (anterior facial height) and S-Go (posterior facial height).
Figure 1 - Analysis of sagittal development was based on the following
measures: SNB, Co-Gn. Reference points used: Sella turcica (S), Na-sion (N), Point-B (B), Gnathion (NG), Condilio (Co).
Figure 2 - Analysis of vertical development was based on the following
measures: SN.GoMe; N-Me (AFH); S-Go (PFH). Reference points used: Sella turcica (S), Nasion (N), Gonion (Go), Menton (Me).
S SNB S
Co
N N
B
Gn
Go
RESULTS
The comparison of the mean of each of the mea-sures in the two groups in each time was carried out using the Student’s t test for equality of two indepen-dent populations. Results show that the means of the measures SNB, SN.GoMe and AFH were different in the two groups, in all ages considered. The SN.GoMe value was greater in the group with horizontal growth at all ages. The SN.GoMe means were significantly higher in the group with horizontal growth and the AFH means were significantly higher in the group with vertical growth.
While there were significant differences in the means of Co-Gn and PFH variables, it was observed that the means of the measure Co-Gn and PFH were always higher in the group with horizontal growth pattern (Table 1).
To evaluate possible differences in the growth pattern of the two groups, the change that occurred in each individual, in two distinct ages, (between 9 and 12 years, between 12 and 21 years and between 9 and 21 years) was calculated, for each variable. The results presented in Table 2 show that, except for changes in SN.GoMe variable occurred between 9 and 21 years of age, there is no statistically signifi-cant difference in the mean of all other measures in
any period considered. Despite the variation among the age groups have undergone changes in mean that can be clinically considered, when statistically mea-sured, only SN.GoMe presented significant changes between 9 and 21 years of age.
DISCUSSION
In this longitudinal study, the sagittal and vertical mandible development on sample of Class I individu-als with horizontal and vertical pattern were studied longitudinally in a period of clinical growth signifi-cance: Between 9, 12 and 21 years of age.
Sagittal development
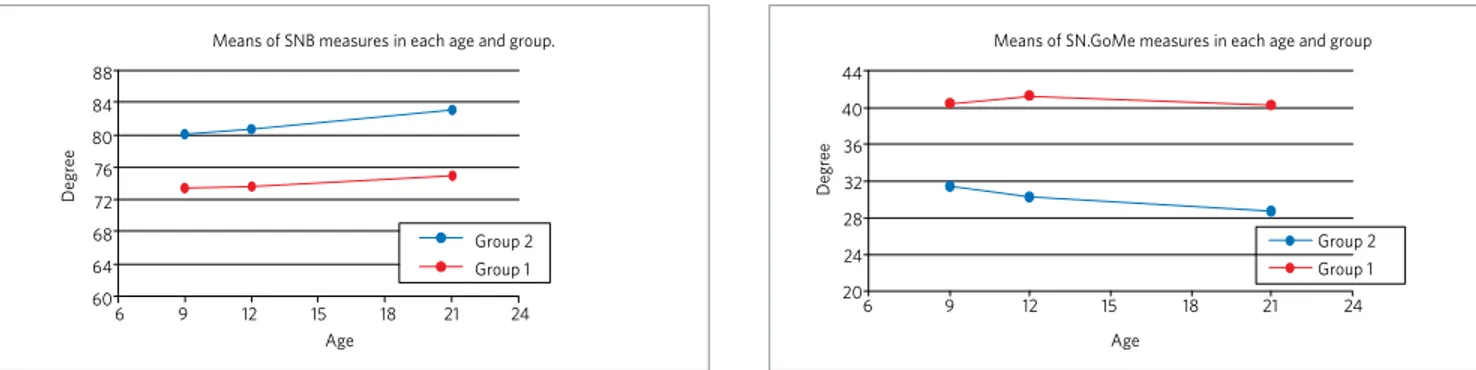
In respect to the sagittal positioning of man-dible among individuals with vertical and horizon-tal growth pattern a statistically different position between the two groups was observed. The angu-lar (SNB) and linear (Co-Gn) measures indicated a mandibular retrognathism in individuals with Class I with vertical growth showing statistically signifi-cant differences between groups in SNB measures (Fig 3; Tables 1 and 2). The value of SNB and Co-Gn was higher in the group with horizontal growth in all
ages. Thilander et al27 observed that the SNB angle
increased continuously during the observation
pe-Horizontal growth Vertical growth
Age mean SD mean SD t gl p
SNB
9 80.1 3.13 73.4 1.90 5.80 18 0.000
12 80.7 3.03 73.7 3.24 4.95 18 0.000
21 83.0 2.99 75.0 2.80 6.16 18 0.000
SN.GoMe
9 31.4 3.40 40.4 3.35 -5.94 18 0.000
12 30.2 2.74 41.3 3.31 -8.17 18 0.000
21 28.6 4.02 40.3 3.17 -7.21 18 0.000
Co-Gn
9 106.7 4.58 105.8 2.36 0.56 18 0.583
12 113.8 4.61 112.6 4.06 0.58 18 0.568
21 126.0 9.30 124.1 7.48 0.51 18 0.619
AFH
9 104.7 4.65 111.8 3.28 -3.95 18 0.001
12 110.2 5.25 119.8 6.58 -3.58 18 0.002
21 120.2 9.23 130.3 7.73 -2.66 18 0.016
PFH
9 69.2 3.38 66.3 2.94 2.01 18 0.060
12 74.0 4.52 71.4 3.93 1.34 18 0.197
21 82.5 8.14 79.3 5.55 1.01 18 0.324
Table 1 - Means and standard deviations of the measures by age and group, and results of Student’s t test for the equality of means (independent
riod, from 3 to 21 years in Class I individuals. Bishara
et al4 longitudinally assessed Class II and normal
individuals. In normal individuals the SNB angle in-creased during the period, not showing a significant Class II difference.
Vertical development
The vertical position was evaluated on the basis of an-gular and linear measures, SN.GoMe angle anterior facial height and posterior facial height (Fig 2; Tables 1 and 2).
The measure Sn.GoMe in individuals with hori-zontal growth pattern was significantly lower than in individuals with vertical growth. This angle shows a tendency to decrease with aging in subjects with
hori-Horizontal Growth Vertical Growth
Period mean SD mean SD t gl p
SNB
Between 9 and 12 years old 0.56 1.24 0.33 2.05 0.30 18 0.765
Between 12 and 21 years old 2.30 1.54 1.25 3.51 0.87 18 0.398
Between 9 and 21 years old 2.86 1.62 1.58 2.19 1.49 18 0.155
SN.GoMe
Between 9 and 12 years old -1.27 2.04 0.86 2.72 -1.98 18 0.063
Between 12 and 21 years old -1.54 2.32 -0.98 2.78 -0.49 18 0.630
Between 9 and 21 years old -2.81 2.60 -0.12 1.91 -2.64 18 0.017
Co-Gn
Between 9 and 12 years old 7.08 1.59 6.86 3.66 0.17 18 0.863
Between 12 and 21 years old 12.21 6.35 11.43 6.28 0.28 18 0.786
Between 9 and 21 years old 19.29 5.69 18.29 5.65 0.39 18 0.698
AFH
Between 9 and 12 years old 5.55 1.62 7.98 5.40 -1.36 10.6 0.201
Between 12 and 21 years old 9.98 5.43 10.57 7.23 -0.21 18 0.839
Between 9 and 21 years old 15.53 6.07 18.55 4.74 -1.24 18 0.231
PFH
Between 9 and 12 years old 4.81 2.41 5.11 2.74 -0.26 18 0.798
Between 12 and 21 years old 8.47 5.45 7.85 5.48 0.25 18 0.803
Between 9 and 21 years old 13.28 5.78 12.96 4.46 0.14 18 0.891
Table 2 - Means and standard deviations of the changes in the measures, by group and period, and results of the Student’s t test for the equality of
aver-ages (independent populations).
(1) student’s t test for two population means with unequal variances.
Means of SNB measures in each age and group.
Age
Group 2 Group 1
Degr
ee
6 9 12 15 18 88
84 80 76 72 68 64 60
21 24
Figure 3 - Means of SNB measures in each age and group.
Means of SN.GoMe measures in each age and group
Age
Group 2 Group 1
Degr
ee
6 9 12 15 18 44
40 36 32 28 24 20
21 24
Figure 4 - Means of SN.GoMe measures in each age and group.
zontal growth. On the other hand, in individuals with vertical growth, this angle remains virtually the same between 9 and 21 years of age (Figure 3, Table 1 and 2).
Thilander et al27 observed a tendency for mandibular
counterclockwise rotation in Class I individuals. Class II individuals presented opposite behavior to Class I
individuals with increased mandibular plane angle.21
The posterior facial height (PFH) presented lower values in all age groups in individuals with vertical growth when compared to individuals with horizon-tal growth, although not statistically significant. The posterior facial height also influences other measures. Class I individuals with vertical growth presenting increased Sn.GoMe values, for example, show a ten-dency to a clockwise rotation of the mandible (Fig 7, Tables 1 and 2).
Means of Co-Gn in every age and group
Age
Group 2 Group 1
Degr
ee
6 9 12 15 18 128
124 120 116 112 108 104 100
21 24
Figure 5 - Means of Co-Gn measures in every age and group.
Means of N-Me (AFH) in every age and group
Age
Group 2 Group 1
Degr
ee
6 9 12 15 18 134
130 126 122 118 114 110 106 102 98 94 90
21 24
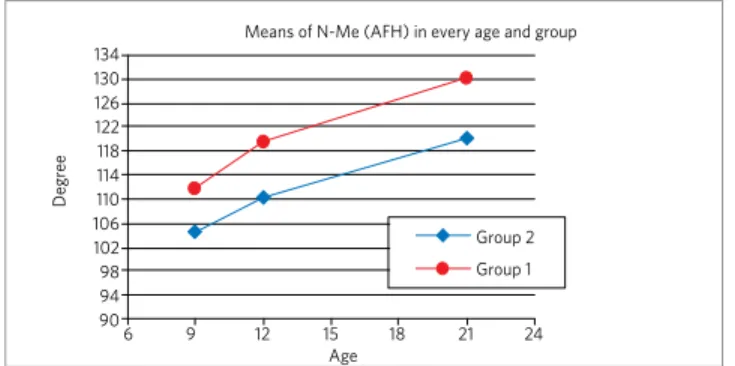
Figure 6 - Means of N-Me (AFH) measures in every age and group.
Means of S-Go (PFH)in every age and group
Figure 7 - Means of S-Go (PFH) measures in every age and group.
Age
Group 2 Group 1
Degr
ee
6 9 12 15 18 84
80 76 72 68 64 60
21 24
Facial morphology
The anterior facial height showed significant in-crease in Group 1 (vertical) when compared with Group 2. Changes were noted in this measure among the ages in Group 2, as the increase of anterior facial height is significantly lower in this group.
CONCLUSIONS
1. Sagittal development
In the sample of individuals with vertical growth pattern, a greater retrognathism was noted when com-pared with the other group. The retrognathic position of the mandible, in the vertical group, was present at 9 years of age, and the growth increment was similar in both groups studied.
In the group with horizontal growth pattern the position of the mandible varied, presenting more or-thognathic position.
2. Vertical development
In the group with horizontal growth pattern, there was a deficit in terms of anterior facial height. This deficit was not found in the vertical facial develop-ment group. In addition, increases in developdevelop-ment of anterior facial height at the time between 9 and 21 years of age were significantly lower in Class I hori-zontal pattern.
3. Facial shape
1. Altemus LA. Horizontal and vertical dentofacial relationships in normal and Class II division 1 in girls 11-15 years. Angle Orthod. 1955; 25:120-37.
2. Baccetti T, Franchi L, McNamara JA Jr, Tollaro I. Early dentofacial features of Class II malocclusion: a longitudinal study from the deciduous through the mixed dentition. Am J Orthod Dentofacial Orthop. 1997;111(5):502-9.
3. Baumrind S, Miller D, Molthen R. The reliability of head film measurements. 3. Tracing superimposition. Am J Orthod. 1976;70(6):617-44.
4. Bishara SE, Jakobsen JR, Vorhies B, Bayati P. Changes in dentofacial structures in untreated Class II division 1 and normal subjects: a longitudinal study. Angle Orthod. 1997;67(1):55-66.
5. Broadbent B, Holly S, Broadbent BH, Golden WY. Bolton standards of dentofacial developmental growth. St. Louis: C.V. Mosby; 1975.
6. Buschang PH, Tanguay R, Turkewicz J, Demirjian A, La Palme L. A polynomial approach to craniofacial growth: description and comparison of adolescent males with normal occlusion and those with untreated Class II malocclusion. Am J Orthod Dentofacial Orthop. 1986;90(5):437-42.
7. Buschang PH, Martins J. Childhood and adolescent changes of skeletal relationships. Angle Orthod. 1998;68(3):199-206.
8. Carter NE. Dentofacial changes in untreated Class II Division 1 subjects. Br J Orthod. 1987;14:225-34.
9. Chung C, Wong WW. Craniofacial growth in untreated skeletal Class II subjects: a longitudinal study. Am J Orthod Dentofacial Orthop. 2002;122(6):619-26. 10. Gallagher RW, Miranda F, Buschang PH. Maxillary protraction: treatment and
posttreatment effects. Am J Orthod Dentofacial Orthop. 1998;113(6):612-9. 11. Godiawala RN, Joshi MR. A cephalometric comparison between Class II, Division 2
malocclusion and normal occlusion. Angle Orthod. 1974;44(3):262-7.
12. Iseri H, Solow B. Growth displacement of the maxilla in girls studied by the implant method. Eur J Ortod Soc. 1990;12:389-98.
13. Kalra V, Burstone CJ, Nanda R. Effects of a fixed magnetic appliance on the dentofacial complex. Am J Orthod Dentofacial Orthop. 1989;95(6):467-78. 14. Kolodziej RP, Southard TE, Southard KA, Casko JS, Jakobsen JR. Evaluation of
antegonial notch depth for growth prediction. Am J Orthod Dentofacial Orthop. 2002;121(4):357-63.
15. Love RJ, Murray JM, Mamandras AH. Facial growth in males 16 to 20 years of age. Am J Orthod Dentofacial Orthop. 1990;97(3):200-6.
REFERENCES
16. Lux CJ, Conradt C, Burden D, Komposch G. Dental arch widths and mandibular-maxillary base widths in Class II malocclusions between early mixed and permanent dentitions. Angle Orthod. 2003;73(6):674-85.
17. Lux CJ, Raeth O, Burden D, Conradt C, Komposch G. Sagittal and vertical growth of the Jaws in Class II, Division 1 and Class II, Division 2 malocclusions during prepubertal and pubertal development. J Orofac Orthop. 2004;65(4):290-311. 18. McNamara JA. Components of Class II malocclusion in children 8-10 years of age.
Angle Orthod. 1981;51(3):177-202.
19. Mobarak KA, Krogstad O, Espeland L, Lyberg T. Factors influencing the predictability of soft tissue profile changes following mandibular setback surgery. Angle Orthod. 2001;71(3):216-27.
20. Mogavero FJ, Buschang PH, Wolford LM. Orthognathic surgery effects on maxillary growth in patients with vertical maxillary excess. Am J Orthod Dentofacial Orthop. 1997;111:288-96.
21. Ngan PW, Byczek E, Scheick J. Longitudinal evaluation of growth changes in Class II Division 1 subjects. Semin Orthod. 1997;3(4):222-31.
22. Requirements and limitations of roentgenographic cephalometry. Burlington Growth Center. Toronto: University of Toronto; 1962.
23. Riedel RA. The relation of maxillary structures to cranium in malocclusion and normal occlusion. Angle Orthod. 1952;22(3):142-5.
24. Riolo ML, Moyers RE, McNamara JA Jr, et al. An atlas of craniofacial growth. Monograph No. 2; Craniofacial Growth Series. Center for Human Growth and Development. Ann Arbor, MI: Center for Human Growth and Development, The University of Michigan; 1974.
25. Schudy FF. Vertical growth versus anteroposterior growth as related to function and treatment. Angle Orthod. 1964;34(2):75-93.
26. Schudy FF. The rotation of the mandible resulting from growth: its implications in orthodontic treatment. Angle Orthod. 1965;35:36-50.
27. Thilander B, Persson M, Adolfsson U. Roentgen-cephalometric standards for a Swedish population. A longitudinal study between the ages of 5 and 31 years. Eur J Orthod. 2005;27(4):370-89.