Q. Y. Wang1, R.-J. Huang1,2,3, J. J. Cao1,5, X. X. Tie1, H. Y. Ni1, Y. Q. Zhou1, Y. M. Han1, T. F. Hu1, C. S. Zhu1, T. Feng4,5, N. Li6, and J. D. Li1
1Key Laboratory of Aerosol Chemistry and Physics, Institute of Earth Environment, Chinese Academy of Sciences,
Xi’an 710061, China
2Laboratory of Atmospheric Chemistry, Paul Scherrer Institute (PSI), 5232 Villigen, Switzerland
3Centre for Climate and Air Pollution Studies, Ryan Institute, National University of Ireland Galway, University Road,
Galway, Ireland
4School of Human Settlements and Civil Engineering, Xi’an Jiaotong University, Xi’an 710054, China 5Institute of Global Environmental Change, Xi’an Jiaotong University, Xi’an 710049, China
6National Taiwan University, Department of Atmospheric Sciences, Taipei 10617, Taiwan
Correspondence to:R.-J. Huang (rujin.huang@ieecas.cn) and J. J. Cao (cao@loess.llqg.ac.cn)
Received: 25 March 2015 – Published in Atmos. Chem. Phys. Discuss.: 19 May 2015 Revised: 12 October 2015 – Accepted: 10 November 2015 – Published: 25 November 2015
Abstract. Black carbon (BC) aerosol at high altitudes of the Qinghai–Tibetan Plateau has potential effects on the re-gional climate and hydrological cycle. An intensive measure-ment campaign was conducted at Qinghai Lake (∼3200 m above sea level) at the edge of the northeastern Qinghai– Tibetan Plateau during winter using a ground-based single particle soot photometer (SP2) and a photoacoustic extinc-tiometer (PAX). The average concentration of refractory BC (rBC) and number fraction of coated rBC were found to be 160±190 ng m−3 and 59 % for the entire campaign, re-spectively. Significant enhancements of rBC loadings and number fraction of coated rBC were observed during a pol-lution episode, with an average value of 390 ng m−3 and 65 %, respectively. The mass size distribution of rBC par-ticles showed log-normal distribution, with a peak diame-ter of ∼187 nm regardless of the pollution level. Five-day backward trajectory analysis suggests that the air masses from north India contributed to the increased rBC load-ings during the campaign. The potential source contribu-tion funccontribu-tion (PSCF) model combined with the fire counts map further proves that biomass burning from north India is an important potential source influencing the northeastern Qinghai–Tibetan Plateau during the pollution episode. The rBC mass absorption cross section (MACrBC)atλ=532 nm was slightly larger in clean days (14.9 m2g−1)than during
the pollution episode (9.3 m2g−1), likely due to the effects of brown carbon and the uncertainty of the MACrBC
calcu-lation. The MACrBCwas positively correlated with number
fraction of coated rBC during the pollution episode with an increasing rate of 0.18 (m2g−1)%−1. The number fraction of coated rBC particles showed positive correlation with light absorption, suggesting that the increase of coated rBC par-ticles will enhance the light absorption. Compared to rBC mass concentration, rBC mixing sate is more important in de-termining absorption during the pollution episode, estimated from the same percentage-wise increment of either rBC mass concentration or the number fraction of coated rBC. The es-timated BC direct radiative forcing was+0.93 W m−2for the pollution episode, which is 2 times larger than that in clean days. Our study provides insight into the potential climatic impacts of rBC aerosol transported to the Qinghai–Tibetan Plateau from south Asian regions, and is also useful for fu-ture modeling studies.
1 Introduction
effect by either absorbing incoming solar radiation in the at-mosphere or by reducing the albedo of surface (i.e., snow and ice) (Jacobson, 2001; Ramanathan and Carmichael, 2008; Kühn et al., 2014). A total climate forcing of BC particles is estimated to be+1.1 W m−2, which is ranked as the second largest contributor to anthropogenic radiative forcing after carbon dioxide in the present-day atmosphere (Bond et al., 2013). BC particles, derived from incomplete combustion of fossil fuels or biomass, are mainly hydrophobic when emit-ted, but become hygroscopic over time due to atmospheric aging processes (Cheng et al., 2006, 2012). When BC parti-cles are mixed with water-soluble aerosol composition, they can serve as cloud condensation nuclei and therefore affect microphysical properties of clouds, leading to indirect ef-fect on climate (Lohmann and Feichter, 2005; Riemer et al., 2010; Rose et al., 2011). BC also shows semi-direct effects through interaction with cloud processes (Koch and Del Ge-nio, 2010). Moreover, the impacts of BC aerosols on the ra-diative balance may lead to far-reaching consequences, such as global dimming (Wild et al., 2007), lower crop yields (Tollefsen et al., 2009), and negative impacts on terrestrial and aquatic ecosystems (Forbes et al., 2006).
The Qinghai–Tibetan Plateau is known as the “Third Pole” of the Earth because of its immense area and high elevation. It covers the area of 27–45◦N, 70–105◦E with an average elevation>4000 m a.s.l. (above sea level). Due to its special landform, ecosystem, and monsoon circulation, the Qinghai– Tibetan Plateau exerts profound effects on the regional and global radiative budget and climate (Kopacz et al., 2011; Su et al., 2013; Yang et al., 2014). The Qinghai–Tibetan Plateau is surrounded by many important anthropogenic BC aerosol source areas (Zhang et al., 2009), such as south Asia (e.g., In-dia) and east Asia (e.g., China). An inventory study suggests that the BC emissions in China and India have increased by 40 and 54 % from 2000 to 2008, respectively (Kurokawa et al., 2013). Due to general circulation patterns, the Qinghai– Tibetan Plateau has become a strong receptor of these high-BC source areas (Cao et al., 2010; Xia et al., 2011; Cong et al., 2013; Zhao et al., 2013). Lu et al. (2012) show that south Asia and east Asia are the main source regions, ac-counting for 67 and 17 % of BC transported to the Himalayas and Qinghai–Tibetan Plateau on an annual basis, followed by the former USSR (∼8 %), Middle East (∼4 %), Europe (∼2 %), and northern Africa (∼1 %). Deposition of BC on snow and ice at the Qinghai–Tibetan Plateau has decreased the snow surface albedo (Xu et al., 2012; Ming et al., 2013). The Qinghai–Tibetan Plateau glaciers, which are the largest glaciers outside of the polar regions, have shown signs of retreat (Xu et al., 2009). The snowmelt from the Qinghai– Tibetan Plateau vitally affects the sustaining seasonal water availability, leading to agricultural insecurity in south, east, and southeast Asia (Immerzeel et al., 2010).
The effect of BC transported from surroundings of Qinghai–Tibet’s environment and climate is of great sig-nificance. However, BC studies are still very scarce in the
Qinghai–Tibetan Plateau to date (e.g., Cao et al., 2010; Zhao et al., 2013; Wang et al., 2014a). In these limited studies, on-line and offon-line filter-based techniques are often used. Due to inherent systematic limitations, direct examination of BC size distribution and mixing state with filter-based measure-ments is not feasible (Watson et al., 2005; Slowik et al., 2007; Collaud Coen et al., 2010; Bond et al., 2013). The BC opti-cal properties are dependent on its physiopti-cal (e.g., size and shape) and chemical (e.g., mixing with other materials) fea-tures. For example, the degree of enhancement in the mass absorption cross section from the internal mixture of BC with other aerosol components can lead to large difference in the prediction of global radiative budget (Bond et al., 2006; Chung et al., 2012; Zhuang et al., 2013). Consequently, accu-rate characterization of BC particles is crucial for a precise estimate of the impacts of BC on the atmospheric radiative forcing, human health, and air quality. In this study, a single particle soot photometer (SP2) and a photoacoustic extinc-tiometer (PAX) were used to investigate the refractory black carbon (rBC) mass concentrations, size distribution, mixing state, and aerosol light absorption properties in the north-eastern Qinghai–Tibetan Plateau. The primary objectives of this study were (1) to investigate the important potential rBC source regions responsible for the high wintertime rBC con-centration in the northeastern Qinghai–Tibetan Plateau, (2) to study the effect of rBC mixing state on light absorption prop-erties, (3) to estimate the direct radiative forcing during an rBC pollution episode.
2 Methodology 2.1 Measurement site
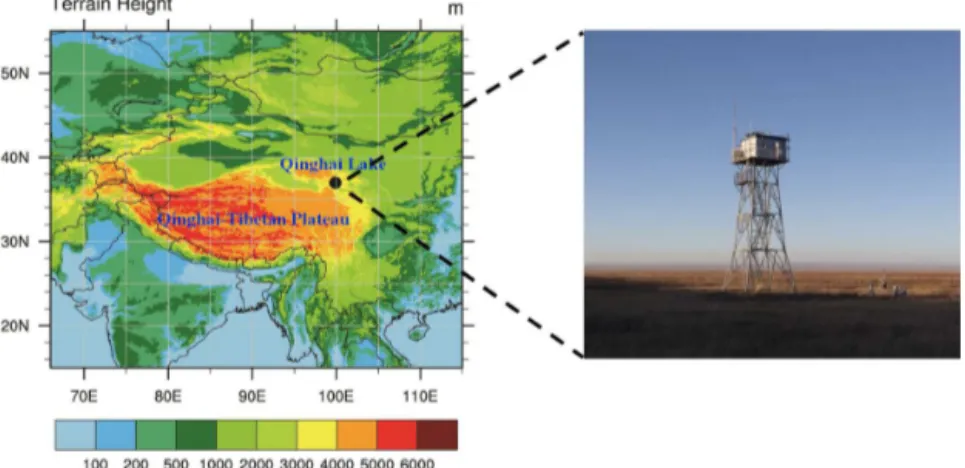
Qinghai Lake (36.53–37.25◦N and 99.6–100.78◦E), the largest saline lake in China, is located ∼3200 m a.s.l. in a closed-drainage intermountain basin on the north-east Qinghai–Tibetan Plateau, with an area of∼4400 km2 (Fig. 1). This region is highly sensitive to global climate change, because it is situated in the sensitive semi-arid zone between the Asian monsoon-controlled area and the westerly jet-stream-influenced area (An et al., 2012). Intensive mea-surements were taken from 16 to 27 November, 2012, from the rooftop (∼15 m above ground level) of a sampling tower at the “Bird Island” peninsula (36.98◦N, 99.88◦E), which is located at the northwest section of the Qinghai Lake shore as shown in Fig. 1.
2.2 rBC mass and mixing-state measurements
Figure 1.Left: geographical location of the Qinghai–Tibetan Plateau and surrounding areas. The color code represents topographical features
(unit: m). Right: observation tower at the “Bird Island” peninsula in Qinghai Lake, China.
2006). Briefly, the SP2 relies on laser-induced incandescence to quantify the rBC mass of individual particles. Continu-ous intracavity Nd:YAG laser light at 1064 nm is used to heat rBC-containing particles to their vaporization point. The peak incandescence signal is linearly related to the rBC mass in the particle irrespective of the particle morphology or mix-ing state; this holds true over most of the rBC mass range typically observed in the accumulation mode (Slowik et al., 2007). In this work, the rBC mass in the range of ∼0.4– 1000 fg, equivalent to ∼70–1000 nm volume-equivalent di-ameter (VED), is quantified, assuming a void-free density of 2.0 g cm−3(Schwarz et al., 2008). This range covers>90 % of the rBC mass in the accumulation mode. The incandes-cence signal was calibrated using a standard fullerene soot sample (Lot F12S011, Alfa Aesar, Inc., Ward Hill, Mas-sachusetts). The total uncertainty in the rBC mass determi-nation was ∼25 %. More details about the SP2 calibration and uncertainty can be found in our previous work (Wang et al., 2014a). Note that the SP2 only quantifies the most refractory and most efficient light-absorbing component of combustion aerosol. The rBC concentration is adjusted to standard temperature and pressure (Tstandard=273.15 K, and Pstandard=1013.25 hPa).
The SP2 is capable of determining the rBC mixing state. The time delay between the peaks from the scattered light and incandescence signals is an indicator of the amount of non-rBC material mixed internally with individual rBC par-ticles (Schwarz et al., 2006; McMeeking et al., 2011; Perring et al., 2011; Wang et al., 2014a). This method is sensitive to optically significant amounts of non-rBC material. The time delay occurs because the coatings must be removed from the rBC particle before the onset of incandescence. Because the scattering measurement is rather noisy for small parti-cles and becomes saturated for large partiparti-cles, the mixing state was studied for rBC core between∼70 and∼275 nm VED, which constitute the majority of rBC particle numbers (Wang et al., 2014a). The limitation of the SP2 instrument is
discussed in Taylor et al. (2015) when considering leading-edge scattering. The number fraction of coated rBC parti-cles, which is calculated from the distribution of time delay, is an indicator of the degree to which the rBC particles are coated with other substances. This number fraction is higher for more aged rBC particles due to the formation of coating from atmospheric physical and chemical processes including coagulation, condensation, and heterogeneous reactions (Liu et al., 2013; Browne et al., 2015).
2.3 Particle light absorption measurements
The PAX (Droplet Measurement Technology, Boulder, CO, USA) measures light absorption and scattering coefficients simultaneously using a modulated diode laser. The light absorption coefficient is measured, based on the intracav-ity photoacoustic technology. A laser beam in the acoustic chamber of the instrument heats suspended absorbing par-ticles, by which a pressure wave is produced and detected with a sensitive microphone. A wide-angle integrating re-ciprocal nephelometer in the acoustic chamber measures the light scattering coefficient regardless of the particles’ chem-ical make-up, mixing state, or morphology. In this study, the light absorption atλ=532 nm is measured. Before sampling, nitrogen dioxide (NO2)and ammonium sulfate are used for the calibration of light absorption and scattering, respec-tively. The PAX can provide the light extinction coefficient independently, using laser power. NO2was used to produce
Table 1.Summary of rBC concentrations, the number fraction of coated rBC, light absorption coefficient, and mass absorption cross section
of rBC (MACrBC)during different sampling periods.
rBC Number fraction Absorption MACrBC
(mean±SD, ng m−3) of coated rBC (%) (Mm−1) (m2g−1)
PE∗ CD∗ All PE CD All PE CD All PE CD All
Average 390±207 86±101 160±190 65±5 58±7 59±7 3.7±2.9 1.3±1.6 2.1±2.4 9.3±3.1 14.9±8.9 13.2±8.1
25th 219 40 50 63 53 54 1.4 0.7 0.8 7.4 9.0 8.3
50th 410 68 80 66 58 60 3.4 0.9 1.2 9.0 13.6 11.2
75th 489 103 170 68 63 65 4.4 1.4 2.0 10.7 18.7 16.7
∗PE and CD represent the pollution episode and clean days, respectively.
3 Results and discussion
3.1 Mass, size, and mixing state of rBC aerosol
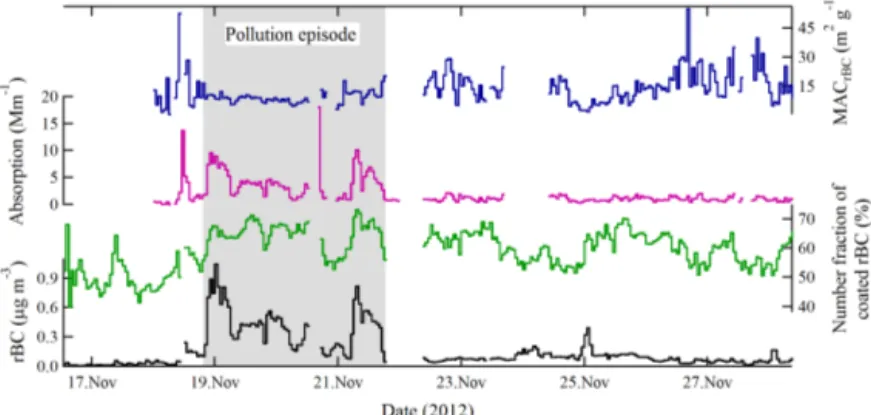
The time series of hourly averaged rBC mass concentra-tions and the mixing state obtained during the campaign are shown in Fig. 2, and a statistical summary of the data is pre-sented in Table 1. The mean concentration of rBC aerosol (±standard deviation) was 160±190 ng m−3during the en-tire campaign period, ranging from 6 to 1040 ng m−3. The mean number fraction of coated rBC is found to be 59±7 % (range 40–73 %), suggesting the majority of aged rBC par-ticles in wintertime in the Qinghai Lake region. It is found that∼25 % of the rBC values are higher than the 75th value, and the variation coefficient (defined by standard deviation (SD)/mean ratio) of rBC values reaches as high as 120 %, suggesting a large rBC burden even at the free tropospheric altitude. Elevated rBC concentration was observed from 19 to 21 November (defined as the “pollution episode” here-after) with an average rBC loading of 390 ng m−3, which is about 4 times higher than that of the rest of measurement period (86 ng m−3, defined as clean days). The mean
num-ber fraction of coated rBC also increases to 65 % during the pollution episode, higher than that in the clean days (58 %). Given that local rBC emissions in the Qinghai Lake region and even the entire Qinghai–Tibetan Plateau are very limited, the enhanced rBC concentrations observed during this cam-paign are most likely from regional transport as discussed below.
Figure 3 shows the mass size distribution of rBC particles for the entire campaign period. A log-normal size distribu-tion pattern in VED for the size of the rBC core of a particle is found, with a very close peak diameter for the rBC pollution episode (188 nm) and clean days (187 nm). The size distribu-tions of the rBC core in the ambient atmosphere are affected by the size of fresh rBC particles and the subsequent atmo-spheric processing (Bond et al., 2013). The growth of rBC particles is a complex process, including water accretion, co-agulation, condensation, and the accumulation of other ma-terials through heterogeneous reactions. However, only the process of coagulation can lead to the increase of the rBC core in VED. The coagulation of particles in ambient air is dominated by Brownian motion, a slow process for
par-ticles in the accumulation mode (Seinfeld and Pandis, 1998). Therefore, the similarity in VED size distribution for the rBC core between clean days and the pollution episode indicates that the measured rBC particles are likely from biomass burn-ing emissions, given that fossil fuel and biomass burnburn-ing tend to have different rBC size distributions and that the peak di-ameter measured in this study is similar to the reported rBC peak diameter from biomass burning plumes (range∼187– 193 nm; see Kondo et al., 2011; Sahu et al., 2012; Taylor et al., 2014).
3.2 rBC potential pollution source areas
To examine the contribution of regional rBC transport, 5-day back trajectories were calculated using the hy-brid single-particle Lagrangian integrated trajectories (HYS-PLIT) model (http://ready.arl.noaa.gov/HYSPLIT.php). The HYSPLIT model was driven with full vertical dynamics us-ing gridded meteorological data (Global Data Assimilation System; GDAS1). Figure 4a shows the hourly results of backward trajectories calculated with the arrival height of 100, 500, and 1000 m above ground level. The rBC data were averaged to 1 h in order to match the time step of the tra-jectories. The different arrival height of trajectories shows similar transport directions, suggesting the air masses mixed well at different altitudes. During the rBC pollution episode, the air masses mainly originated from the regions of high rBC emissions in north India (Sahu et al., 2008), which then passed over the rather clean western Qinghai–Tibetan Plateau (Zhang et al., 2009). In contrast, the air masses orig-inated from Europe and passed through the western part of China during clean days.
The potential source contribution function (PSCF) model (e.g., Wang et al., 2006) was used to further explore the potential source regions which influence rBC concentration in the Qinghai Lake region. To do so, the geographic re-gion covered by the trajectories was divided into an array of 0.5×0.5◦grid cells. The PSCF values for the grid cells were calculated by counting the trajectory segment endpoints that terminate within each cell. The number of endpoints that fall in theijth cell is designated asnij. The number of endpoints
Figure 2.Time series of the rBC mass concentration, number fraction of coated rBC, light absorption atλ=532 nm, and mass absorption cross section of rBC (MACrBC)during the entire campaign period. The pollution episode is highlighted with the gray background.
Figure 3.Mass size distribution of rBC in volume-equivalent
diam-eter during different sampling periods at Qinghai Lake. The solid lines represent log-normal fit. “M” and “D” in they-axis label rep-resent rBC mass and void-free diameter (assuming 2 g cm−3
den-sity), respectively.
PSCF value for theijth cell is defined as PSCFij=mij/nij.
Because of the impact of small values of nij, an arbitrary
weight functionWijwas used to better reflect the uncertainty
in the values for these cells (Polissar et al., 1999). The weight function reduces the PSCF values when the total number of the endpoints in a particular cell is less than about 3 times the average value of the end points per each cell. Here,Wij
is defined as (Polissar et al., 2001)
Wij =
1.00 80< nij
0.70 20< nij≤80
0.42 10< nij≤20
0.05 nij ≤10.
(1)
Although the PSCF model is often used to determine the po-tential source regions (e.g., Wang et al., 2006; Heo et al., 2013; Zhang et al., 2013), a limitation of this model is that grid cells can have the same PSCF value when sample con-centrations at the receptor site are either only slightly higher
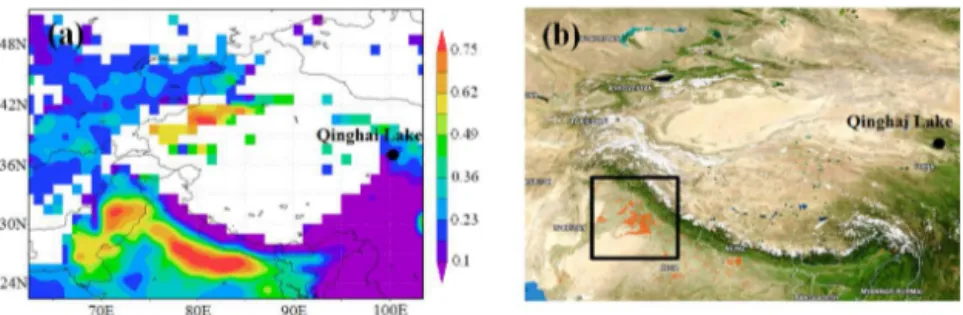
or extremely higher than the criterion. This may lead to diffi-culties in distinguishing moderate sources from strong ones. To compensate for this limitation, the PSCF result calculated from the 75th percentile of all the data is set as the criterion (170 ng m−3)in this study. Figure 4b shows the map of PSCF results for the entire campaign period. High PSCF values are found in north India. The PSCF values are low in the Qinghai Lake and surrounding regions, indicating lower likelihood of high rBC emissions from local sources compared to regional transport from north India. An aerosol optical depth (AOD) map, retrieved from the measurements of Moderate Resolu-tion Imaging Spectroradiometer (MODIS) on the Terra satel-lite, describes the mean atmospheric aerosol loading around the Qinghai–Tibetan Plateau (Fig. 5a). High AOD values can be found along the Indo-Gangetic Basin in India and south Pakistan, indicating heavy pollution in this region. The fire counts map (Fig. 5b) obtained from MODIS observations on NASA satellites also shows a large number of biomass ing activities in north India, indicating large biomass burn-ing aerosol (includburn-ing rBC aerosol) emissions. Although the high altitude of the Himalayas was thought to be a physical wall for atmospheric pollutants, previous studies indicate that the high Himalayan valleys can act as a “direct channel” for the transport of air pollutants up to 5000 m a.s.l. (e.g., Bona-soni et al., 2010). After reaching the north of the Himalayas, the air pollutants can further transport to the central Qinghai– Tibetan Plateau (Hindman and Upadhyay, 2002; Xia et al., 2011). Therefore, the rBC pollution episode observed in the Qinghai Lake measurement site is most likely derived from the biomass burning emissions in north India.
3.3 Optical properties of rBC aerosol
Figure 4. (a)Five-day backward air mass trajectories reaching Qinghai Lake at 100, 500, and 1000 m above ground every 6 h and(b)likely
source areas of rBC identified using potential source contribution function (PSCF) plots during the entire campaign.
Figure 5.Regional distributions of(a)aerosol optical depth (AOD) and(b)fire counts map over the Qinghai–Tibetan Plateau derived from
MODIS observations during 16–27 November 2012.
(1.3±1.6 Mm−1). The rBC mass absorption cross section (MACrBC, expressed here in m2g−1)is one of the most im-portant optical properties for rBC aerosol because this pa-rameter links optical properties to rBC mass. The MACrBC
can be calculated by dividing the absorption coefficient mea-sured with the PAX by the rBC mass concentration from the SP2 (MACrBC=[Absorption]/[rBC]). Due to the difference in cutoff size for PAX (<2.5 µm) and for SP2 (<1.0 µm), the MACrBCmay be overestimated by∼13 % given that BC concentration in PM1.0accounted for∼85 % of PM2.5in the
Tibetan Plateau (Wan et al., 2015).
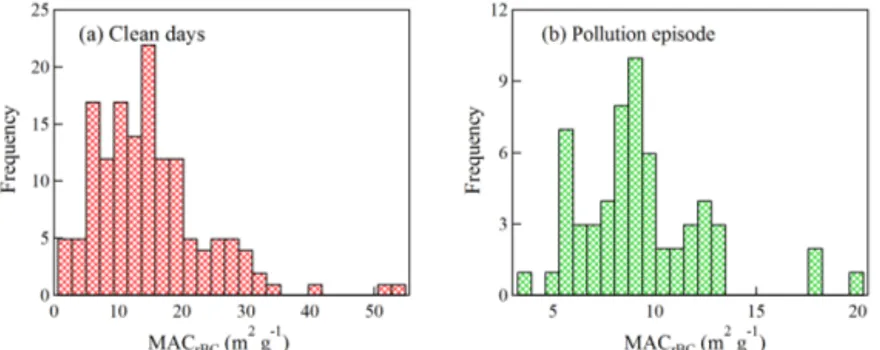
Figure 6a and b show histograms of the MACrBC
val-ues during clean days and the pollution episode, respec-tively. The distribution of MACrBC in clean days tends to
larger values than that during the pollution episode, with an average value of 14.9±8.9 m2g−1 for clean days and 9.3±3.1 m2g−1for the pollution episode. These values are higher than the MACrBC of 7.8 m2g−1 for uncoated rBC
particles (interpolated to 532 from 550 nm, assuming an ab-sorption Ångström exponent of 1.0) suggested by Bond and Bergstrom (2006). It is interesting that the MACrBCin clean
days is∼60 % larger than that during the pollution episode, the reason for which is not clear. A possible explanation in-volves the interference from brown carbon. Previous stud-ies demonstrate that brown carbon, like black carbon, is an important light-absorbing aerosol composition in the atmo-sphere which can absorb light at visible wavelength (e.g., λ=532 nm) (Yang et al., 2009). In the rural areas of
Qing-hai, biofuels including yak and sheep dung, firewood, and crop residues account for ∼80 % of total household en-ergy (Ping et al., 2011). Biofuel/biomass combustion emis-sions are considered as especially significant sources for brown carbon (Andreae and Gelencsér, 2006). It may pro-duce enough brown carbon (particularly during the smol-dering combustion phase) to influence the light absorption when rBC loading is low. Thus, the MACrBC may be
over-estimated in clean days. In addition, the calculation method using the light absorption and rBC mass may also introduce uncertainty, especially when the rBC concentration is low. The high MACrBCvalues always correspond to very low rBC
mass. The MACrBCcalculation method can bring∼30 % un-certainty estimated from the square root of uncertainties in the PAX (10 %) and SP2 (25 %) measurements.
To further investigate the effect of rBC mixing state on MACrBC, the MACrBCvalues were plotted against the
num-ber fraction of coated rBC. As shown in Fig. 7, the MACrBC
was not correlated with the number fraction of coated rBC during clean days, but positive correlation was observed dur-ing the pollution episode, suggestdur-ing that the mixdur-ing state leads to the increase of the MACrBC. The slope of 0.18
(m2g−1)%−1obtained from the linear regression is arguably representative of the rate of the mixing-state effect on the MACrBC.
Figure 7.Mass absorption cross section of rBC (MACrBC)versus number fraction of coated rBC during(a)clean days and(b)the pollution
episode. The error bars correspond to the standard deviations of MACrBCand number fraction of coated rBC.
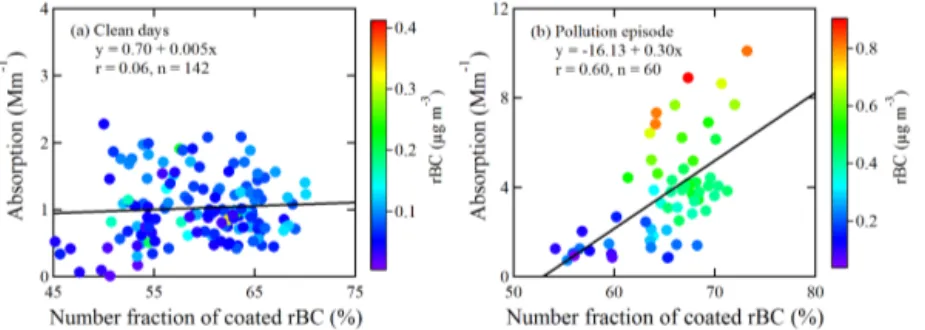
particles are internally mixed with other non-light-absorbing aerosol components including sulfate, nitrate, organics, and water (e.g., Bond et al., 2006; Shiraiwa et al., 2010; Wang et al., 2014b). This is because the non-absorbing materials act like a lens and therefore refract the light toward the absorbing BC core, leading to the enhancement of absorption on visible light. Figure 8 shows the relationship between light absorp-tion and rBC mixing state during clean days and the polluabsorp-tion episode. In clean days the light absorption shows no signif-icant correlation with number fraction of coated rBC, which could be attributed to the influences of brown carbon. In con-trast, during the pollution episodes the light absorption co-efficients generally increase with increasing number fraction of coated rBC, with the latter being positively correlated with the rBC mass concentration during the pollution episode (see Fig. 8b). Such correlation indicates that the outflow from pol-luted south Asia would increase the rBC mass concentration leading to light absorption enhancement on the one hand, and the increased number fraction of coated rBC particles would further enhance the light absorption on the other hand. To fur-ther investigate whefur-ther rBC concentration or mixing state is more important for determining absorption, the increases in light absorption are compared based on the same percentage-wise increment of either rBC mass concentration or number fraction of coated rBC. According to the regression func-tion in Fig. 8b and the correlafunc-tion between absorpfunc-tion and rBC mass (absorption= −0.38+10.17[rBC],r=0.92), the increase of light absorption is larger for number fraction of
coated rBC (e.g.,1 light absorption=1.8 Mm−1)than for the rBC mass (e.g.,1 light absorption=0.5 Mm−1), sug-gesting that, compared to rBC mass concentration, the rBC mixing state is more important in determining absorption during the pollution episode.
3.4 Implications for direct radiative forcing
The direct radiative forcing of BC particles (DRFBC)refers to the change in energy balance at the top of the atmosphere due to absorption and scattering of sunlight by BC particles. Here the DRFBC is estimated from a simple analytical
so-lution derived from the following parameterization (Chylek and Wong, 1995):
DRFBC=S0
4 Tatm2 ×(1−N )
× [4αδab−2×(1−α)2βδsc], (2) whereS0is the solar irradiance (1370 W m−2),Tatmis the
at-mospheric transmission (0.79),Nis the cloud fraction (0.6), a is the surface albedo (i.e., 0.18 at rural region),β is the backscatter fraction, which is assumed to be 0.17 (Kim et al., 2012), and δab and δsc are the absorption and
scatter-ing optical depth, respectively. The daily values ofδab and
δsc are estimated from Aura-OMI (ozone monitoring
Figure 8.Light absorption as a function of number fraction of coated rBC during(a)clean days and(b)the pollution episode. Data points
are color-coded for rBC mass concentration.
to be 0.6±0.4 W m−2for the entire campaign, ranging from 0.05 to 1.6 W m−2. During the rBC pollution episode, the
DRFBC was 0.93±0.57 W m−2, which is about 2 times higher than that in clean days (0.48±0.29 W m−2). It should be noted that the DRFBC is calculated based on the
as-sumption that BC particles are externally mixed with other non-light-absorbing particles. Given that a fraction of BC particles may be internally mixed with other aerosol com-pounds, the DRFBCcalculated here should be considered as
the lower limit. Therefore, the BC mediated radiative forcing is of great importance for the local atmospheric radiative bal-ance in the northeastern Qinghai–Tibetan Plateau. Given the much shorter lifetime of BC aerosol compared with green-house gases, mitigation of BC pollution could be an efficient control strategy for protecting the vulnerable environment in the Qinghai–Tibetan Plateau because it reduces the radiative forcing directly by reducing the BC particle concentration, and indirectly by slowing down the melting of snowpack and ice that can reflect the sunlight. It is worth noting that the rBC concentration during the pollution episode was 4 times higher than that in clean days, but the DRFBCwas only
en-hanced by a factor of 2, suggesting the importance of other aerosol components which made a negative contribution to DRF.
4 Conclusions
The mass concentration, size distribution, mixing state, and optical properties of rBC particles in the Qinghai Lake gion of the Qinghai–Tibetan Plateau were studied. The re-sults show that average rBC concentration and number frac-tion of coated rBC are 160±190 ng m−3and 59 %, respec-tively, for the entire campaign in November 2012. The av-erage rBC mass concentration is about 4 times larger for the pollution episode than for clean days; and the number fraction of coated rBC particles also increases from 58 % for clean days to 65 % for the pollution episode. The mass size distribution of rBC particles shows log-normal distribution with a peak diameter of∼187 nm regardless of the pollution level. Back trajectory analysis and the potential source con-tribution function (PSCF) model study show that north
In-dia is an important region influencing the rBC level in the northeastern Qinghai–Tibetan Plateau during the pollution episode. The fire counts map also suggests that the pollution episode is likely caused by biomass burning in north India.
The average light absorption (atλ=532 nm) is 1.3 Mm−1 for the clean days and increases to 3.7 Mm−1 for the pollution episode. The rBC mass absorption cross sec-tion (MACrBC) at λ=532 nm was larger in clean days (14.9 m2g−1)than during the pollution episode (9.3 m2g−1), likely due to the effects of brown carbon and the uncer-tainty of the MACrBC calculation. The MACrBC was
pos-itively correlated with the number fraction of coated rBC during the pollution episode, with an increasing rate of 0.18 (m2g−1)%−1. The number fraction of coated rBC par-ticles shows positive correlation with light absorption, sug-gesting that the increase of aged rBC particles increases the light absorption. Compared to rBC mass concentration, rBC mixing state is more important in determining absorp-tion during the polluabsorp-tion episode, estimated from the same percentage-wise increment of either rBC mass concentra-tion or the number fracconcentra-tion of coated rBC. The estimated BC direct radiative forcing is about 2 times higher for the pollution episode (0.93±0.57 W m−2)than for clean days (0.48±0.29 W m−2).
T., Cai, Y., Huang, Y., Lu, X., Chang, H., Song, Y., Sun, Y., Xu, H., Liu, W., Jin, Z., Liu, X., Cheng, P., Liu, Y., Ai, L., Li, X., Liu, X., Yan, L., Shi, Z., Wang, X., Wu, F., Qiang, X., Dong, J., Lu, F., and Xu, X.: Interplay between the Westerlies and Asian monsoon recorded in Lake Qinghai sediments since 32 ka, Sci. Rep., 2, 619, doi:10.1038/srep00619, 2012.
Andreae, M. O. and Gelencsér, A.: Black carbon or brown car-bon? The nature of light-absorbing carbonaceous aerosols, At-mos. Chem. Phys., 6, 3131–3148, doi:10.5194/acp-6-3131-2006, 2006.
Anenberg, S. C., Schwartz, J., Shindell, D., Amann, M., Faluvegi, G., Klimont, Z., Janssens-Maenhout, G., Pozzoli, L., Van Din-genen, R., Vignati, E., Emberson, L., Muller, N. Z., West, J. J., Williams, M., Demkine, V., Hicks, W. K., Kuylenstierna, J., Raes, F., and Ramanathan, V.: Global air quality and health co-benefits of mitigating near-term climate change through methane and black carbon emission controls, Environ. Health Persp., 120, 831–839, 2012.
Bonasoni, P., Laj, P., Marinoni, A., Sprenger, M., Angelini, F., Ar-duini, J., Bonafè, U., Calzolari, F., Colombo, T., Decesari, S., Di Biagio, C., di Sarra, A. G., Evangelisti, F., Duchi, R., Facchini, MC., Fuzzi, S., Gobbi, G. P., Maione, M., Panday, A., Roccato, F., Sellegri, K., Venzac, H., Verza, GP., Villani, P., Vuillermoz, E., and Cristofanelli, P.: Atmospheric Brown Clouds in the Hi-malayas: first two years of continuous observations at the Nepal Climate Observatory-Pyramid (5079 m), Atmos. Chem. Phys., 10, 7515–7531, doi:10.5194/acp-10-7515-2010, 2010.
Bond, T. C. and Bergstrom, R. W.: Light absorption by carbona-ceous particles: An investigative review, Aerosol Sci. Tech., 40, 27–67, 2006.
Bond, T. C., Habib, G., and Bergstrom, R. W.: Limitations in the enhancement of visible light absorption due to mixing state, J. Geophys. Res., 111, D20211, doi:10.1029/2006JD007315, 2006. Bond, T. C., Doherty, S. J., Fahey, D. W., Forster, P. M., Berntsen, T., DeAngelo, B. J., Flanner, M. G., Ghan, S., Kärcher, B., Koch, D., Kinne, S., Kondo, Y., Quinn, P. K., Sarofim, M. C., Schultz, M. G., Schulz, M., Venkataraman, C., Zhang, H., Zhang, S., Bel-louin, N., Guttikunda, S. K., Hopke, P. K., Jacobson, M. Z., Kaiser, J. W., Klimont, Z., Lohmann, U., Schwarz, J. P., Shin-dell, D., Storelvmo, T., Warren, S. G., and Zender, C. S.: Bound-ing the role of black carbon in the climate system: A scientific assessment, J. Geophys. Res., 118, 5380–5552, 2013.
Browne, E. C., Franklin, J. P., Canagaratna, M. R., Massoli, P., Kirchstetter, T. W., Worsnop, D. R., Wilson, K. R., and Kroll, J. H.: Changes to the chemical composition of soot from hetero-geneous oxidation reactions, J. Phys. Chem. A, 119, 1154–1163, 2015.
raiwa, M., Gong, Y. G., Shao, M., Hu, M., Zhu, T., Zhang, Y. H., Carmichael, G. R., Wiedensohler, A., Andreae, M. O., and Pöschl, U.: Size-resolved measurement of the mixing state of soot in the megacity Beijing, China: diurnal cycle, aging and parameterization, Atmos. Chem. Phys., 12, 4477–4491, doi:10.5194/acp-12-4477-2012, 2012.
Chung, C. E., Lee, K., and Mueller, D.: Effect of internal mixture on black carbon radiative forcing, Tellus B, 64, 1–13, 2012. Chylek, P. and Wong, J.: Effect of absorbing aerosols on global
ra-diation budget, Geophys. Res. Lett., 22, 929–931, 1995. Collaud Coen, M., Weingartner, E., Apituley, A., Ceburnis, D.,
Fierz-Schmidhauser, R., Flentje, H., Henzing, J. S., Jennings, S. G., Moerman, M., Petzold, A., Schmid, O., and Baltensperger, U.: Minimizing light absorption measurement artifacts of the Aethalometer: evaluation of five correction algorithms, Atmos. Meas. Tech., 3, 457–474, doi:10.5194/amt-3-457-2010, 2010. Cong, Z., Kang, S., Gao, S., Zhang, Y., Li, Q., and Kawamura, K.:
Historical trends of atmospheric black carbon on Tibetan Plateau as reconstructed from a 150-Year lake sediment record, Environ. Sci. Technol., 47, 2579–2586, 2013.
Forbes, M. S., Raison, R. J., and Skjemstad, J. O.: Formation, trans-formation and transport of black carbon (charcoal) in terrestrial and aquatic ecosystems, Sci. Total Environ., 370, 190–206, 2006. Gao, R., Schwarz, J., Kelly, K., Fahey, D., Watts, L., Thompson, T., Spackman, J., Slowik, J., Cross, E., and Han, J. H.: A novel method for estimating light-scattering properties of soot aerosols using a modified single-particle soot photometer, Aerosol Sci. Tech., 41, 125–135, 2007.
Heo, J., McGinnis, J. E., de Foy, B., and Schauer, J. J.: Identification of potential source areas for elevated PM2.5, nitrate and sulfate concentrations, Atmos. Environ., 71, 187–197, 2013.
Hindman, E. E. and Upadhyay, B. P.: Air pollution transport in the Himalayas of Nepal and Tibet during the 1995–1996 dry season, Atmos. Environ., 36, 727–739, 2002.
Immerzeel, W. W., van Beek, L. P. H., and Bierkens, M. F. P.: Cli-mate change will affect the Asian water towers, Science, 328, 1382–1385, 2010.
Jacobson, M. Z.: Strong radiative heating due to the mixing state of black carbon in atmospheric aerosols, Nature, 409, 695–697, 2001.
Koch, D. and Del Genio, A. D.: Black carbon semi-direct effects on cloud cover: review and synthesis, Atmos. Chem. Phys., 10, 7685–7696, doi:10.5194/acp-10-7685-2010, 2010.
Kondo, Y., Matsui, H., Moteki, N., Sahu, L., Takegawa, N., Ka-jino, M., Zhao, Y., Cubison, M. J., Jimenez, J. L., Vay, S., Diskin, G. S., Anderson, B., Wisthaler, A., Mikoviny, T., Fu-elberg, H. E., Blake, D. R., Huey, G., Weinheimer, A. J., Knapp, D. J., and Brune, W. H.: Emissions of black carbon, organic, and inorganic aerosols from biomass burning in North America and Asia in 2008, J. Geophys. Res., 116, D08204, doi:10.1029/2010JD015152, 2011.
Kopacz, M., Mauzerall, D. L., Wang, J., Leibensperger, E. M., Henze, D. K., and Singh, K.: Origin and radiative forcing of black carbon transported to the Himalayas and Tibetan Plateau, Atmos. Chem. Phys., 11, 2837–2852, doi:10.5194/acp-11-2837-2011, 2011.
Kühn, T., Partanen, A. I., Laakso, A., Lu, Z., Bergman, T., Mikko-nen, S., Kokkola, H., KorhoMikko-nen, H., RäisäMikko-nen, P., Streets, D. G., Romakkaniemi, S., and Laaksonen, A.: Climate impacts of changing aerosol emissions since 1996, Geophys. Res. Lett., 41, 4711–4718, 2014.
Kurokawa, J., Ohara, T., Morikawa, T., Hanayama, S., Janssens-Maenhout, G., Fukui, T., Kawashima, K., and Akimoto, H.: Emissions of air pollutants and greenhouse gases over Asian re-gions during 2000–2008: Regional Emission inventory in ASia (REAS) version 2, Atmos. Chem. Phys., 13, 11019–11058, doi:10.5194/acp-13-11019-2013, 2013.
Liu, D., Allan, J., Whitehead, J., Young, D., Flynn, M., Coe, H., McFiggans, G., Fleming, Z. L., and Bandy, B.: Ambient black carbon particle hygroscopic properties controlled by mix-ing state and composition, Atmos. Chem. Phys., 13, 2015–2029, doi:10.5194/acp-13-2015-2013, 2013.
Lohmann, U. and Feichter, J.: Global indirect aerosol effects: a re-view, Atmos. Chem. Phys., 5, 715–737, doi:10.5194/acp-5-715-2005, 2005.
Lu, Z., Streets, D. G., Zhang, Q., and Wang, S.: A novel back-trajectory analysis of the origin of black carbon transported to the Himalayas and Tibetan Plateau during 1996–2010, Geophys. Res. Lett., 39, L01809, doi:10.1029/2011GL049903, 2012. McMeeking, G. R., Morgan, W. T., Flynn, M., Highwood, E. J.,
Turnbull, K., Haywood, J., and Coe, H.: Black carbon aerosol mixing state, organic aerosols and aerosol optical properties over the United Kingdom, Atmos. Chem. Phys., 11, 9037–9052, doi:10.5194/acp-11-9037-2011, 2011.
Ming, J., Wang, P., Zhao, S., and Chen, P.: Disturbance of light-absorbing aerosols on the albedo in a winter snowpack of Central Tibet, J. Environ. Sci., 25, 1601–1607, 2013.
Moteki, N. and Kondo, Y.: Effects of mixing state on black car-bon measurements by laser-induced incandescence, Aerosol Sci. Tech., 41, 398–417, 2007.
Perring, A., Schwarz, J., Spackman, J., Bahreini, R., de Gouw, J., Gao, R., Holloway, J., Lack, D., Langridge, J., and Peischl, J.: Characteristics of black carbon aerosol from a surface oil burn during the Deepwater Horizon oil spill, Geophys. Res. Lett., 38, L17809, doi:10.1029/2011GL048356, 2011.
Ping, X., Jiang, Z., and Li, C.: Status and future perspectives of energy consumption and its ecological impacts in the Qinghai-Tibet region, Renew. Sust. Energ. Rev., 15, 514–523, 2011.
Polissar, A. V., Hopke, P. K., Paatero, P., Kaufmann, Y. J., Hall, D. K., Bodhaine, B. A., Dutton, E. G., and Harris, J. M.: The aerosol at Barrow, Alaska: long-term trends and source locations, Atmos. Environ., 33, 2441–2458, 1999.
Polissar, A. V., Hopke, P. K., and Harris, J. M.: Source regions for atmospheric aerosol measured at Barrow, Alaska, Environ. Sci. Technol., 35, 4214–4226, 2001.
Ramanathan, V. and Carmichael, G.: Global and regional climate changes due to black carbon, Nat. Geosci., 1, 221–227, 2008. Riemer, N., West, M., Zaveri, R., and Easter, R..: Estimating black
carbon aging time-scales with a particle-resolved aerosol model, J. Aerosol Sci., 41, 143–158, 2010.
Rose, D., Gunthe, S. S., Su, H., Garland, R. M., Yang, H., Berghof, M., Cheng, Y. F., Wehner, B., Achtert, P., Nowak, A., Wieden-sohler, A., Takegawa, N., Kondo, Y., Hu, M., Zhang, Y., Andreae, M. O., and Pöschl, U.: Cloud condensation nuclei in polluted air and biomass burning smoke near the mega-city Guangzhou, China – Part 2: Size-resolved aerosol chemical composition, di-urnal cycles, and externally mixed weakly CCN-active soot par-ticles, Atmos. Chem. Phys., 11, 2817–2836, doi:10.5194/acp-11-2817-2011, 2011.
Sahu, S. K., Beig, G., and Sharma, C.: Decadal growth of black carbon emissions in India, Geophys. Res. Lett., 35, L02807, doi:10.1029/2007GL03233, 2008.
Sahu, L. K., Kondo, Y., Moteki, N., Takegawa, N., Zhao, Y., Cu-bison, M. J., Jimenez, J. L., Vay, S., Diskin, G. S., Wisthaler, A., Mikoviny, T., Huey, L. G., Weinheimer, A. J., and Knapp, D. J.: Emission characteristics of black carbon in anthro-pogenic and biomass burning plumes over California dur-ing ARCTAS-CARB 2008, J. Geophys. Res., 117, D16302, doi:10.1029/2011JD017401, 2012.
Schwarz, J. P., Gao, R. S., Fahey, D. W., Thomson, D. S., Watts, L. A., Wilson, J. C., Reeves, J. M., Darbeheshti, M., Baum-gardner, D. G., Kok, G. L., Chung, S. H., Schulz, M., Hen-dricks, J., Lauer, A., Kärcher, B., Slowik, J. G., Rosenlof, K. H., Thompson, T. L., Langford, A. O., Loewenstein, M., and Aikin, K. C.: Single-particle measurements of midlatitude black carbon and light-scattering aerosols from the boundary layer to the lower stratosphere, J. Geophys. Res., 111, D16207, doi:10.1029/2006JD007076, 2006.
Schwarz, J. P., Gao, R. S., Spackman, J. R., Watts, L. A., Thomson, D. S., Fahey, D. W., Ryerson, T. B., Peischl, J., Holloway, J. S., Trainer, M., Frost, G. J., Baynard, T., Lack, D. A., de Gouw, J. A., Warneke, C., and Del Negro, L. A.: Measurement of the mixing state, mass, and optical size of individual black carbon particles in urban and biomass burning emissions, Geophys. Res. Lett., 35, L13810, doi:10.1029/2008GL033968, 2008.
Schwarz, J. P., Spackman, J. R., Gao, R. S., Watts, L. A., Stier, P., Schulz, M., Davis, S. M., Wofsy, S. C., and Fahey, D. W.: Global-scale black carbon profiles observed in the remote at-mosphere and compared to models, Geophys. Res. Lett., 37, L18812, doi:10.1029/2010GL044372, 2010.
Seinfeld, J. H. and Pandis, S. N.: Atmospheric chemistry and physics: From air pollution to climate change, Wiley, New York, 1998.
Oram, D., Forster, G., Lee, J. D., Rickard, A. R., Parrington, M., and Palmer, P. I.: Size-dependent wet removal of black carbon in Canadian biomass burning plumes, Atmos. Chem. Phys., 14, 13755–13771, doi:10.5194/acp-14-13755-2014, 2014.
Taylor, J. W., Allan, J. D., Liu, D., Flynn, M., Weber, R., Zhang, X., Lefer, B. L., Grossberg, N., Flynn, J., and Coe, H.: As-sessment of the sensitivity of core/shell parameters derived us-ing the sus-ingle-particle soot photometer to density and refractive index, Atmos. Meas. Tech., 8, 1701–1718, doi:10.5194/amt-8-1701-2015, 2015.
Tollefsen, P., Rypdal, K., Torvanger, A., and Rive, N.: Air pollution policies in Europe: Efficiency gains from integrating climate ef-fects with damage costs to health and crops, Environ. Sci. Pol., 12, 870–881, 2009.
Wan, X., Kang, S., Wang, Y., Xin, J., Liu, B., Guo, Y., Wen, T., Zhang, G., and Cong, Z.: Size distribution of carbonaceous aerosols at a high-altitude site on the central Tibetan Plateau (Nam Co Station, 4730 m a.s.l.), Atmos. Res., 153, 155–164, 2015.
Wang, Q., Liu, S., Zhou, Y., Cao, J., Han, Y., Ni, H., Zhang, N., and Huang, R.: Characteristics of black carbon aerosol during the Chinese Lunar Year and weekdays in Xi’an, China, Atmosphere, 6, 195–208, 2015.
Wang, Q. Y., Schwarz, J. P., Cao, J. J., Gao, R. S., Fahey, D. W., Hu, T. F., Huang, R.-J., Han, Y. M., and Shen, Z. X.: Black carbon aerosol characterization in a remote area of Qinghai– Tibetan Plateau, western China, Sci. Total Environ., 479, 151– 158, 2014a.
Wang, Q. Y., Huang, R.-J., Cao, J. J., Han, Y. M., Wang, G. H., Li, G. H., Wang, Y. C., Dai, W. T., Zhang, R. J., and Zhou, Y. Q.: Mixing state of black carbon aerosol in a heavily polluted urban area of China: Implications for light absorption enhance-ment, Aerosol Sci. Tech., 48, 689–697, 2014b.
Wang, Y. Q., Zhang, X. Y., and Arimoto, R.: The contribution from distant dust sources to the atmospheric particulate matter load-ings at XiAn, China during spring, Sci. Total Environ., 368, 875– 883, 2006.
2009.
Xu, B., Cao, J., Joswiak, D. R., Liu, X., Zhao, H., and He, J.: Post-depositional enrichment of black soot in snow-pack and acceler-ated melting of Tibetan glaciers, Environ. Res. Lett., 7, 014022, doi:10.1088/1748-9326/7/1/014022, 2012.
Yang, K., Wu, H., Qin, J., Lin, C., Tang, W., and Chen, Y.: Recent climate changes over the Tibetan Plateau and their impacts on energy and water cycle: A review, Global Planet. Change, 112, 79–91, 2014.
Yang, M., Howell, S. G., Zhuang, J., and Huebert, B. J.: Attri-bution of aerosol light absorption to black carbon, brown car-bon, and dust in China – interpretations of atmospheric measure-ments during EAST-AIRE, Atmos. Chem. Phys., 9, 2035–2050, doi:10.5194/acp-9-2035-2009, 2009.
Zhang, Q., Streets, D. G., Carmichael, G. R., He, K. B., Huo, H., Kannari, A., Klimont, Z., Park, I. S., Reddy, S., Fu, J. S., Chen, D., Duan, L., Lei, Y., Wang, L. T., and Yao, Z. L.: Asian emis-sions in 2006 for the NASA INTEX-B mission, Atmos. Chem. Phys., 9, 5131–5153, doi:10.5194/acp-9-5131-2009, 2009. Zhang, R., Jing, J., Tao, J., Hsu, S.-C., Wang, G., Cao, J., Lee,
C. S. L., Zhu, L., Chen, Z., Zhao, Y., and Shen, Z.: Chemi-cal characterization and source apportionment of PM2.5in Bei-jing: seasonal perspective, Atmos. Chem. Phys., 13, 7053–7074, doi:10.5194/acp-13-7053-2013, 2013.
Zhao, S., Ming, J., Sun, J., and Xiao, C.: Observation of carbona-ceous aerosols during 2006–2009 in Nyainqêntanglha Mountains and the implications for glaciers, Environ. Sci. Pollut. R., 20, 5827–5838, 2013.